Evaluation of interfacial properties in SiC composites using an improved cohesive element method
2018-03-07HangZangXingQingCaoChaoHuiHeZhiShengHuangYongHongLi
Hang Zang•Xing-Qing Cao•Chao-Hui He•Zhi-Sheng Huang•Yong-Hong Li
1 Introduction
SiC composites are candidate materials for use in certain fusion reactor designs because of their inherent high-temperature properties and low activation under high-energy neutron irradiation[1,2].An essential issue determining the successful application of such composites is the fiber/matrix interfacialbehavior,because composites transfer stresses between the fiber and the matrix via the interface[3].Different indirect methods such as fragmentation testing,pull-out testing,and push-out testing have been developed to determine the interfacial properties(e.g.,interfacial bond strength and roughness)of composites.Among these techniques,the single- fiber push-out test is regarded as the most important because the procedures for sample preparation and testing are relatively simple.However,only the average interfacial shear strength and sliding friction stress can be obtained from push-out testing,and fiber fracture causes problems during loading or in the case of indenter failure in the experiment[4].Therefore,it is necessary to analyze the fiber push-out process using analytical or numerical methods in order to achieve a better understanding of the interfacial behaviors and to interpret the experimental results of fiber push-out tests.
In the past decade,different analytical methods based on the variational model[5,6]and shear-lag theory[7–9]have been developed to convert the load–displacement data from push-out experiments to interfacial properties.However,these methods usually entail simple assumptions.For example,the shear-lag assumes that load is transferred from an in finite matrix to an in finitely long fiber in the shear direction;hence,the obtained results are approximate values.Recently,some finite element models have been developed to study the interfacial behaviors of composites during push-out tests.Dinter et al.[10]analyzed the distribution of interfacial stresses in the case of complete bonding and sliding.Ananth et al.[11]and Honda et al.[12]performed analyses of interfacial debonding with various shear strength criteria.Some researchers adopted the energy failure criterion to calculate the interfacial fracture energy of various SiC composites[13–15].Zeng et al.[16]conducted single- fiber push-out experiments on SiC/Ti composites in the temperature range from 20 to 530°C and then developed a finite element model based on the spring element method to quantitatively evaluate the interfacial shear strength and sliding friction coef ficient.Geubelle and Baylor[17]developed a cohesive element theory considering sliding friction as a subroutine to analyze the interfacial behaviors of graphite/epoxy laminates.Lin et al.[18]applied this cohesive element theory to a polyester/epoxy system.You et al.[19]de fined a traction–separation law that included the equivalent frictional stress for the cohesive element to study Cu-matrix composites.
Among the finite element models analyzing the interfacial failure of composites during push-out tests of the interphase layer model[20,21],spring element model[4,13,22,23],and cohesive element model[3,18,24],the interphase model de fines a layer with a speci fied physical thickness and material properties.However,it cannot be used to describe interfacial failure.In the spring method based on fracture mechanics,stress easily occurs at crack tips.The cohesive element method is convenient relative to the others;the cohesive elements close to zero thickness are embedded in the interface,while the cohesive damage region is embedded at crack tips where the failure criterion is satis fied.The parameters of this cohesive element without physical meaning are identi fied based on fitting values from push-out experiments.Generally,the cohesive element with a bilinear or exponential constitutive law was used to simulate failure occurring normal to the interface[25].To analyze the tangential failure of the interface,the constitutive law has been appropriately improved.
To analyze the interfacial behaviors of SiC composites during push-out tests,a two-dimensional axisymmetric finite element model based on an improved cohesive element method is presented here.In this analysis, firstly,the validity of this improved cohesive element for simulating interfacial debonding and sliding friction is con firmed.Second,the importance of temperature is discussed;residual thermal stresses are introduced into composites from the stress-free temperature to the test temperature by the mismatch of thermal expansion coef ficients between the fiber and the matrix materials.Finally,the effects of the interfacial shear strength, fiber volume fraction,and interphase thickness on the interfacial behaviors of SiC composites are investigated.
2 Finite element analyses
2.1 Improved cohesive element constitution equation
The interphase layer is a chemical reaction-produced layer between the fiber and the matrix.Hence,the interphase layer is usually very thin,and cohesion is actually the internal force in the interphase layer from atom–molecule interactions.The cohesive element model,simpli fied in this case,can re flect the mechanical behaviors of the reaction product layer when the appropriate parameters are selected.
The cohesive element obeys the de fined traction–separation law,as shown in Fig.1,which assumes initially linear elastic behavior,followed by the initiation and evolution of damage(complete failure at uf).The relation between strain and displacement u is shown below:

where u is the relative displacement of the two contacting element faces attached to a cohesive element and t is the constitutive thickness of the cohesive elements.
Usually,the traction–separation law is expressed in terms of displacement instead of strain.The initial linear elastic constitutive equation is shown below:

where E and K denote the modulus and stiffness,respectively,and σ is the stress.
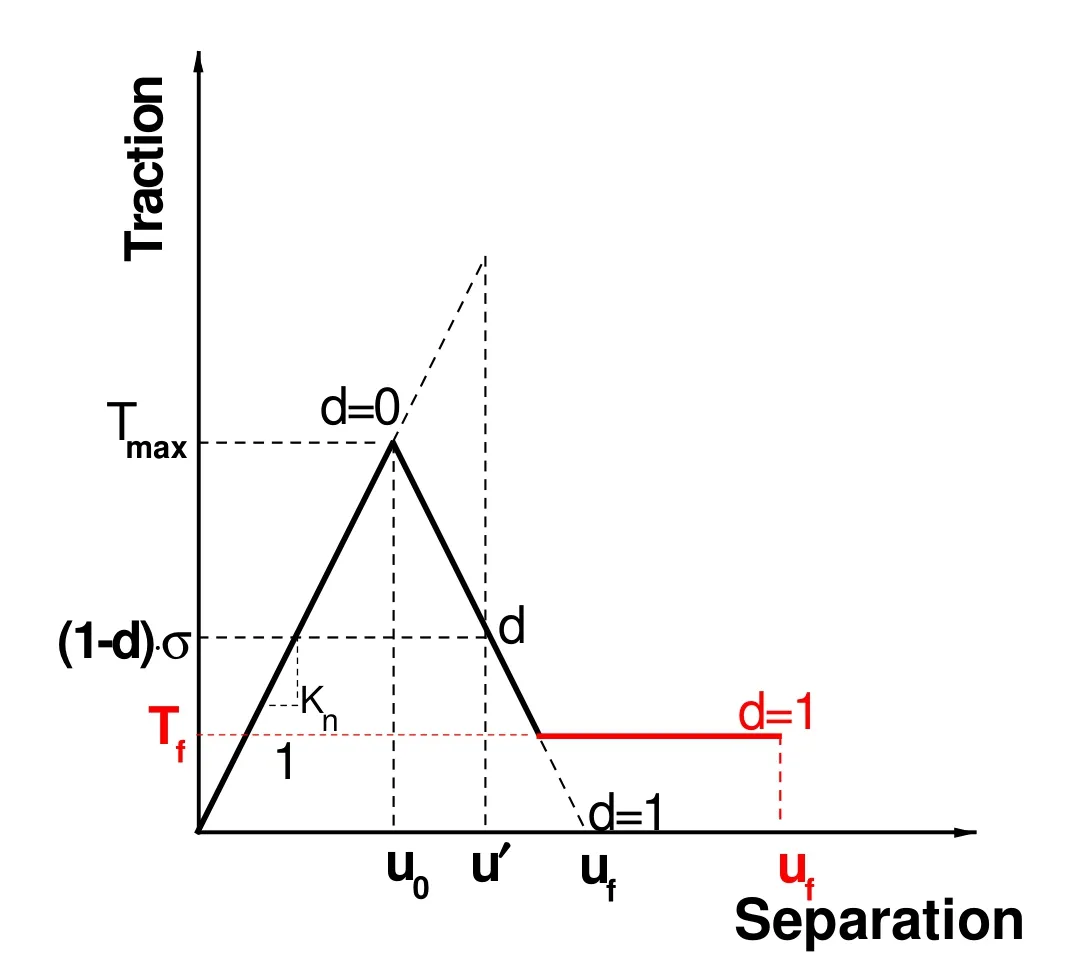
Fig.1 Improved traction–separation law
Several initiation criteria and evolution laws are available in the ABAQUS modeling software[25].Because the main failure mechanism during push-out testing of SiC composites is shear stress failure of the interface,the maximum shear stress failure criterion is used in this study:

where τ*and τfdenote the critical shear strength and sliding frictional stress,respectively,and Tmaxis the maximum shear stress.The cohesive element begins to fail when the shear stress reaches Tmax.
The damage evolution is based on the 1-d reduction of the stiffness,where d is the damage variable.The stress σfof the failure of cohesive elements is expressed as follows:

To ensure that the shear stress declines to the constant value Tf,equal to the sliding frictional stress,after the failure,the damage variable d is given as
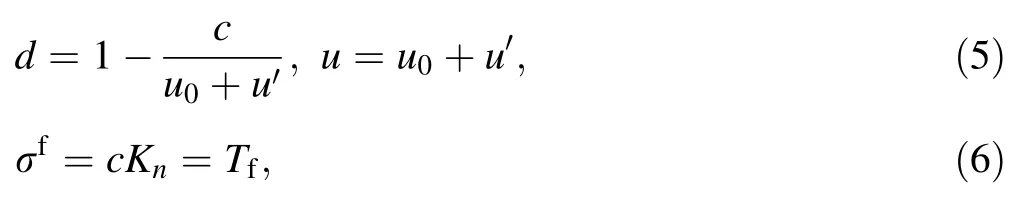
where u0and u′denote the initial and relative failure displacements,respectively,and c is a fitting constant.The damage variable as a function of the displacement is achieved through tabulation.
2.2 Modeling the fiber push-out test
The 2D axisymmetric finite element model shown Fig.2 was proposed to simulate the single- fiber push-out test.In order to compare the experimental results with those reported by Zeng et al.[16],SiC/Ti-matrix composites were chosen to build the model.The model de fines four zones:(1)the SiC fiber;(2)the cohesive zone;(3)the Ti matrix;and(4)the average material surrounding the matrix,having effective composite properties calculated from the linear rule of mixtures.In this analysis,the SiC fibers and Ti matrix are regarded as perfectly isotropic elastic materials,while the average material is treated as a transverse isotropic elastic material.The slice height is 0.43 mm,SiC fiber radius is 71 μm(including an 18-μmthick carbon core and a 3-μm-thick pyrolytic carbon protection layer),Ti matrix radius is 112 μm with a fiber volume fraction equal to 40%,and the outer radius of the composite slice is 1.75 mm.The radii of the indenter and the constraint boundary are 50 and 250 μm,respectively.The single- fiber push-out test model is established at 20,300 and 530°C,using the material data given in Ref.[16].The stress-free temperature is assumed to be 770°C,which is the sample preparation temperature.

Fig.2(Color online)Finite element model of single- fiber push-out test for SiC/Ti composite
The finite element analysis was performed using ABAQUS.The elements of the fiber,matrix,and average material are CAX4 (four-node bilinear axisymmetric quadrilaterals);the elements of the cohesive zone are COHAX4(four-node axisymmetric cohesive elements);and the elements of the indenter are RAX2(two-node linear axisymmetric rigid links).Zero-thickness cohesive elements are embedded between the fiber and matrix elements.The chosen element size(including the cohesive element)is 6.32 μm in the z-direction.The fiber push-out analysis involves the following steps.
First,the sample is cooled from the stress-free temperature to the testing temperature;then,residual thermal stresses are introduced by the mismatch of thermal expansion coef ficients between SiC and Ti.In this analysis,the cooling process is modeled by temperature loading from the initial temperature of 770°C.The boundary conditions on Set 1 and Set 2 in this step are described as

The second step is the loading of a small displacement to establish stable contact between the rigid indenter and the fiber.The indenter is square instead of pyramidal to avoid stress concentration,and the contact is modeled as frictionless to improve the convergence;otherwise,the contact iteration solution could be disconcerted divergence by a sudden large load.The boundary condition on Set 3 in this step is described as

where Raveis the outer radius of the average material.
The third step is the modeling of the fiber push-out process.Fiber push-out is simulated with the displacementcontrolled loading of a single fiber until this fiber is pushed out completely from the matrix.The cohesive elements start to fail when the shear stress reaches the maximum shear stress during the fiber push-out test;this means that the crack grows before the shear stress reaches a constant value,similar to the sliding frictional stress.
2.3 Veri fication of the improved cohesive element method
2.3.1 Damage evolution law and traction–separation relation
Since the failure mechanism is mainly shear failure,as mentioned earlier,only the shear damage evolution law is discussed here,although cases of both normal and shear damages are considered.The previously described damage evolution law is plotted in Fig.3a.The cohesive element does not fail before the initial failure displacement u0,at which the shear stress is equal to the maximum shear stress and the damage variable d always remains equal to zero.The sudden increase in d as it rapidly approaches 0.9 indicates the beginning of failure,meaning that debonding occurs,since d then increases very slowly from 0.9 to 1( final failure).
The relationship between the traction and the separation distance of the cohesive element is shown in Fig.3b.In the early stage of separation,the traction increases linearly with the separation distance.When the shear stress reaches the critical value,the interface falls off,and the traction drops to a constant value related to the temperature.Usually,the solution of this drastic change is dif ficult to converge.In this study,viscous regularization is introduced to improve the convergence.
2.3.2 Veri fication process
Fiber push-out tests were simulated using this improved cohesive element method.The validity of the method for simulating interfacial debonding and sliding friction should be con firmed,and the effects of some geometry and physical parameters on the mechanical behaviors of the compositeswereinvestigated.Figure 4a exhibitsthe experimental load–displacement curve of the push-out test of the SiC/Ti composites at 20°C from Ref.[16].The relation between load and displacement is nearly linear for loads below the maximum load Pmax.Piis approximately 17 N according to the displacement of the fiber protruding from the bottom of the slice after complete(instable)debonding.According to Ref.[11],the linear relation remains because of the very slow crack expansion.The interface debonds fully at Pmax.Hereafter,the load decreases to the sliding frictional force from the existence of interfacial roughness.
Under the critical shear strength τ*of 500 MPa and the constant frictional stress Tfof 84 MPa,the simulated load–displacement curves with various indenter radii at 20°C are shown in Fig.4b.From the comparison of the experimental and computational curves,the simulated maximum load and frictional force show good agreement with the experimental values,and the Pivalue of 15 N is similar to that in the experiment(17 N).As shown in Fig.4b,the simulated value is lower than the experimental value in Fig.4a,and the displacement increases with decreasing indenter radius R.The difference may be related to the shape selection of the indenter;in order to facilitate convergence,a square indenter is used in the simulation instead of the triangular indenter in the experiment.
1.1 研究对象 以中国知网(CNKI)收录的我国体育教学评价相关文献为研究对象,在理论分析的基础上,着重探索1987-2017年来我国体育教学评价研究现状及热点。

Fig.3(Color online)Variation of damage variable(a)and traction(b)with separation distance at 20°C

Fig.4(Color online)The experimental and computational Load–displacement curves at RT,which(a)is the push-out test[16]and b is the simulation under different indenter radii
Figure 5a describes the corresponding distribution of shear stress from the bottom to the top of the interface.It clearly demonstrates that the shear stress introduced by loading is negative;as a result,the bottom residual shear stressislargerandthetopshearstressissmaller.Thebottom of the interface starts to fail when the load reaches the initial failure load of 15 N;then,as the load increases,the cracks propagate from the bottom to the top.However,the propagation direction of the cracks relates to the height of the sample.According to Ananth et al.[11],a critical height of~ 0.5–0.75 mm is observed in SiC/Ti composites;the crack propagates from the top to the bottom along the interfacewhenthesampleheightexceedsthiscriticalheight.
As mentioned earlier,the viscous coef ficient is introduced to resolve the severe nonlinearity of the cohesive element after failure.Viscous regularization is discussed in detail in Ref.[25].The variations in external work,total energy,internal energy,and viscous energy over time are shown in Fig.5b.Note that the time is calibrated by the analysis steps.The total energy increases from zero to 0.02 mJ only during the cooling stage as thermal energy converts to internal energy;the external work only increases during the fiber push-out.This means that the effect of the viscous coef ficient introduced on the model can be ignored by comparing the internal energy and viscous energy.

Fig.5(Color online)Veri fication simulation:a distribution of the shear stress,b changes in energy with time,c relationship between crack length and load
Figure 5c shows the relationship between the crack length and the load.The crack does not propagate before the initial failure load,and crack propagation is based on whether sliding occurs.The load first increases quickly to~15 N and then increases slowly until it reaches the maximum load(30.6 N).The crack becomes unstable when the crack tip reaches a distance equal to twice the fiber radius from the bottom of the interface and the propagation speed is higher in this stage.
The experimental and simulated averaged values of the maximum load of the fiber/matrix interfacial area and the frictional shear stress are given in Table 1.The simulated averaged maximum shear stresses and frictional shear stresses are in good agreement with the experimental results at 20,300 and 530°C.In addition,both the maximum and frictional shear stresses decrease with increasing test temperatures.All the compared results demonstrate that the improved cohesive element method can accurately simulate the interfacial debonding and sliding friction of SiC composites.
3 Results and discussion
3.1 Distribution of residual thermal stresses
The state of residual thermal stress is important in the fiber push-out test according to Zeng et al.[16]and Koss et al.[26],especially in metal matrix composites.The residual thermal stresses are introduced after cooling from the stress-free temperature to the testing temperature by the mismatched thermal expansion coef ficients of SiC and Ti.Therefore,it is necessary to study the effects of the residual thermal stresses on the interfacial debonding and sliding friction.
Theradial andaxialresidualthermalstressesatthecenter of the 430-μm-high slice in the radial direction at 20 °C are shown in Fig.6a.The radial stress σrris negative,because compression occurs after cooling from high to low temperature.However,it becomes positive at the matrix/average materialinterfacebecausetheirinteractionisgreaterthanthe thermaleffect.Intheaxialdirection,thestressσzzisnegative in the fiber but positive in the matrix,because the thermal expansion coef ficient of the fiber is smaller than that of the matrix;thus,the fiber undergoes compressive stress while thematrixendures tensilestress.The distribution of residual shearstressattheinterfaceisgiveninFig.6b,indicatingthat theshearstressσrzpresentsanaxiallysymmetricshapeabout the half-thickness of the sample,because of the axial displacement difference between the fiber and matrix at the interface.The maximum shear stress occurs at both ends of the specimen,which means that the crack is most likely to expand from both sides.
3.2 Effect of temperature
3.3 Effect of fracture strength
The critical shear strength re flects the adhesive strength between the fiber and matrix.In real applications,the cohesive strength cannot be too strong or too weak.Excessively strong cohesion easily causes fiber fracture before interfacial failure,and weak cohesion hinders the speed of load transfer from the matrix to the fiber.Figure 8 shows that the load required to cause complete interfacial failure increases with an increase in the critical shear strength,which means that the interfacial bond strength increases with the critical shear strength.

Table 1 Comparison of simulated averaged maximum and frictional shear stress with experimental values under different test temperatures

Fig.6(Color online)Distribution of residual thermal stresses in the middle of the slice in the radial direction(a)and residual shear stress from bottom to top along the interface(b)

Fig.7(Color online)Effect of temperatures:a distribution of shear stress at the interface,b load–displacement curves under different temperatures
3.4 Effect of fiber volume fraction
The properties of a composite depend not only on its constituents but also on the volume fraction and distribution of fibers.In various processing methods,the fiber radius varies;theradiusofchemicalvapordeposition(CVD)ofSiC fibers is approximately 100 μm.Typically,hundreds of fibers are woven together during prefabrication.The weaving methods and fiber volume fractions are critical in determining the behaviors of composites.The effect of the fiber volume fraction on the initial failure load is shown in Table 2.The initial failure load increases with increasing fiber volume fraction,meaning that a composite material with a higher fiber volume fraction has a higher bearing capacity.
3.5 Effect of interphase layer
The interphase layer is a chemical reaction layer formed during the fiber impregnation process.The interfacial layer in SiC composites comprises TiC,especially when the SiC fiber has a pure C coating[27].In this analysis,the interphase thickness is assumed as 3 μm,6 μm,and 9 μm,respectively.Some data[28–30]suggest that the critical shear strength and sliding frictional stress increased signi ficantly as the interfacial reaction proceeded and that the pyrolytic carbon layer on the SiC fibers was consumed.According to Table 3,the initial failure load increases with the interfacial thickness.This is consistent with the phenomenon reported in the literature.However,the effect of the interphase is limited because the overall composite behaviors also relate to the fiber volume fraction;thus,the thickness of the interphase should not be too large.
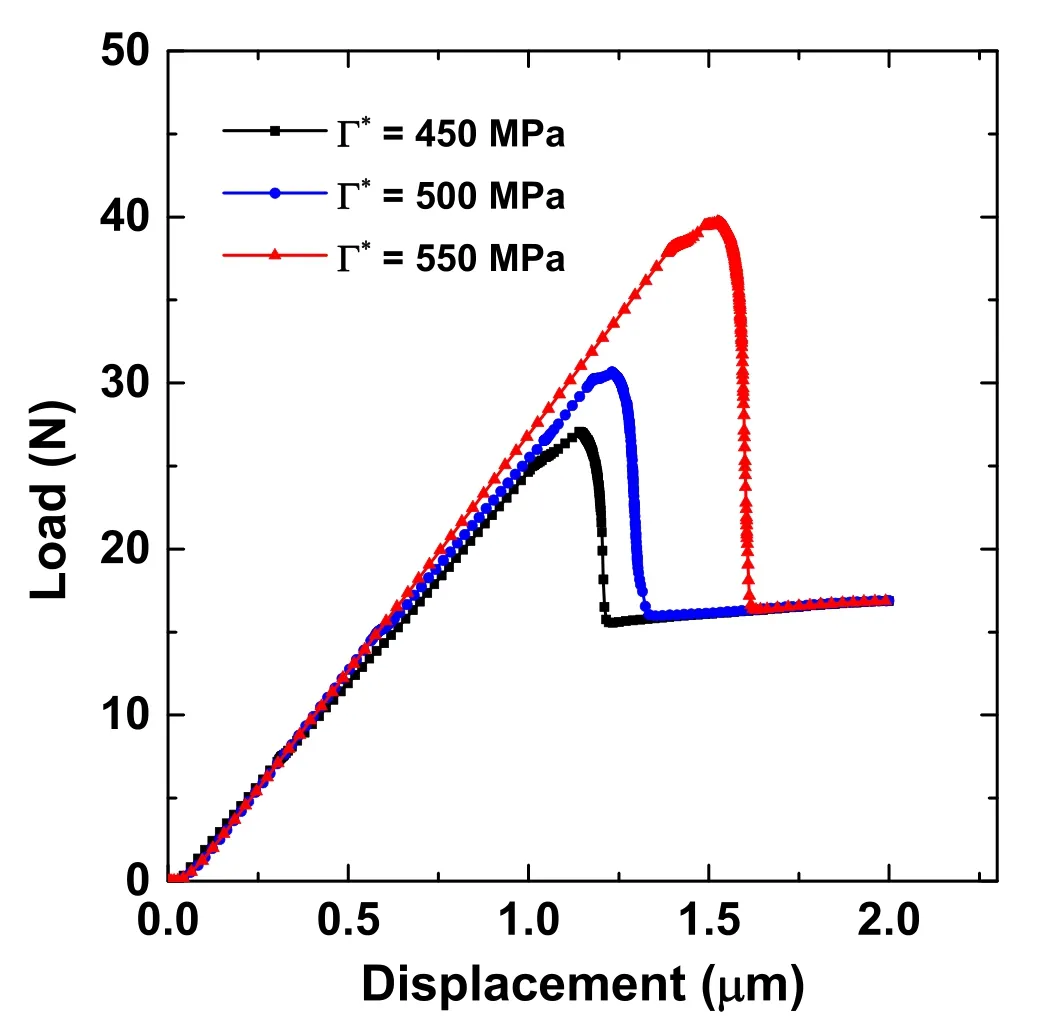
Fig.8(Color online)Load–displacement curves under different critical shear strengths

Table 2 Variation in the initial failure load with the fiber volume fraction

Table 3 Variation in the initial failure load with the interfacial thickness
4 Conclusion
To model sliding friction by reducing stiffness,an improved cohesive element method was presented.A finite element model based on this cohesive element was developed to evaluate the interfacial properties and analyze the effect of some geometrical and physical parameters on the behaviors of SiC fiber-reinforced Ti-matrix composites.The simulation results revealed the following:
1. According to the study of the distribution of residual shear stress,the maximum shear stress occurs at both ends of the specimen,which are the most likely locations for crack formation and propagation.
2. The temperature affects the interfacial behaviors of composites during push-out testing.Both the interfacial shear strength and the constant sliding frictional stress decrease with increasing temperature.At 20,300 and 530°C,the maximum residual shear stresses are 426,225,and 105 MPa,respectively.
3. The interfacial bond strength is related to the critical shear strength,and the shear bearing capacity of the composites increases with the fiber volume fraction.
4. With the increase in interphase thickness between the matrix and the impregnated fibers,the initial failure load increases and the composite becomes more resistant to failure during the push-out test.However,the effect of the interphase is limited;this phenomenon can probably be attributed to the fiber volume fraction,which also affects the overall composite behaviors.
1.M.I.Idris,H.Konishi,M.Imai et al.,Neutron irradiation swelling of SiC and SiCf/SiC for advanced nuclear applications.Energy Procedia.71,328–336(2015).https://doi.org/10.1016/j.egypro.2014.11.886
2.T.S.Duh,K.M.Yin,J.Y.Yan,P.C.Fang,C.W.Chen,J.J.Kai et al.,Study of helium bubble formation in SiCf/PyC/??-SiC composites by dual-beam irradiation.J.Nucl.Mater.329–333,518–523(2004).https://doi.org/10.1016/j.jnucmat.2004.04.218
3.N.Chandra,H.Li,C.Shet,H.Ghonem,Some issues in the application of cohesive zone models for metal-ceramic interfaces.Int.J.Solids Struct.39,2827–2855(2002).https://doi.org/10.1016/S0020-7683(02)00149-X
4.M.N.Yuan,Y.Q.Yang,Z.J.Ma,X.Luo,B.Huang,Y.Chen,Analysis of interfacial behavior in titanium matrix composites by using the finite element method(SCS-6/Ti55).Scr.Mater.56,533–536(2007).https://doi.org/10.1016/j.scriptamat.2006.11.018
5.G.P.Tandon,N.J.Pagano,Micromechanical analysis of the fiber push-out and re-push test.Compos.Sci.Technol.58,1709–1725(1998).https://doi.org/10.1016/S0266-3538(98)00037-2
6.N.J.Pagano,Axisymetric micromechanical stress fields in composites,Local Mechanics Concepts for Composite Material Systems,1991
7.D.K.Shetty,Shear-Lag Analysis of Fiber Push-Out(Indentation)Tests for estimating interfacial friction stress in ceramic-matrix composites.,J.Am.Ceram.Soc.71,c.107-c.109(1988).https://doi.org/10.1111/j.1151-2916.1988.tb05843.x
8.C.H.Hsueh,Strength versus energy debonding criteria at fiber/matrix interfaces.Compos.Eng.2,665–675(1992).https://doi.org/10.1016/0961-9526(92)90024-Z
9.Q.Sun,X.Luo,Y.Q.Yang,B.Huang,N.Jin,W.Zhang et al.,Micromechanical analysis of fiber and titanium matrix interface by shear lag method.Compos.Part B Eng.79,466–475(2015).https://doi.org/10.1016/j.compositesb.2015.05.001
10.J.Dinter,P.W.M.Peters,J.Hemptenmacher,Finite element modelling of the push-out test for SiC fibre-reinforced titanium alloys.Compos.Part A Appl.Sci.Manuf.27,749–753(1996).https://doi.org/10.1016/1359-835X(96)00025-5
11.C.R.Ananth,N.Chandra,Numerical modeling of fiber push-out test in metallic and intermetallic matrix composites-mechanics of the failure process.J.Compos.Mater.(1995).https://doi.org/10.1177/002199839502901105
12.K.Honda,Y.Kagawa,Analysisofshearstressdistributioninpushout process of fiber-reinforced ceramics.Acta Metall.Mater.43,1477–1487(1995).https://doi.org/10.1016/0956-7151(94)00355-L
13.M.N.Yuan,Y.Q.Yang,B.Huang et al.,Evaluation of interface fracture toughness in SiC fiber reinforced titanium matrix composite.Trans.Nonferrous Met.Soc.China 18,925–929(2008).https://doi.org/10.1016/S1003-6326(08)60160-0
14.A.F.Kalton,S.J.Howard,J.Janczak-Rusch,T.W.Clyne,Measurement of interfacial fracture energy by single fibre push-out testing and its application to the titanium–silicon carbide system.Acta Mater.46,3175–3189 (1998).https://doi.org/10.1016/S1359-6454(98)00009-3
15.Y.F.Liu,Y.Kagawa,Analysis of debonding and frictional sliding in fiber-reinforced brittle matrix composites:basic problems.Mater.Sci.Eng.A 212,75–86(1996).https://doi.org/10.1016/0921-5093(96)10196-9
16.W.D.Zeng,P.W.M.Peters,Y.Tanaka,Interfacial bond strength and fracture energy at room and elevated temperature in titanium matrix composites(SCS-6/Timetal 834).Compos.Part A Appl.Sci.Manuf.33,1159–1170 (2002).https://doi.org/10.1016/S1359-835X(02)00089-1
17.P.H.Geubelle,J.S.Baylor,Impact-induced delamination of composites:a 2D simulation.Compos.Part B Eng.29,589–602(1998).https://doi.org/10.1016/S1359-8368(98)00013-4
18.G.Lin,P.H.Geubelle,N.R.Sottos,Simulation of fiber debonding with friction in a model composite pushout test.Int.J.Solids Struct.38,8547–8562(2001).https://doi.org/10.1016/S0020-7683(01)00085-3
19.J.H.You,W.Lutz,H.Gerger et al.,Fiber push-out study of a copper matrix composite with an engineered interface:experiments and cohesive element simulation.Int.J.Solids Struct.46,4277–4286(2009).https://doi.org/10.1016/j.ijsolstr.2009.08.021
20.H.Chen,W.Hu,Y.Zhong,G.Gottstein,Finite element analysis of single- fiber push-out tests of continuous Al2O3fiber-reinforced NiAl composites.Mater.Sci.Eng.A 460–461,624–632(2007).https://doi.org/10.1016/j.msea.2007.01.087
21.H.Ho,L.T.Drzal,Evaluation of interfacial mechanical properties of fiberreinforced compositesusing the microindentation method.Compos.Part A Appl.Sci.Manuf.27,961–971(1996).https://doi.org/10.1016/1359-835X(96)84802-0
22.S.Mukherjee,C.R.Ananth,N.Chandra,Effect of residual stresses on the interfacial fracture behavior of metal-matrix composites.Compos.Sci.Technol.57,1501–1512(1997).https://doi.org/10.1016/S0266-3538(97)00081-X
23.M.N.Yuan,Y.Q.Yang,H.J.Luo,Evaluation of interfacial properties in SiC fiber reinforced titanium matrix composites using an improved finite element model.Mater.Charact.59,1684–1689(2008).https://doi.org/10.1016/j.matchar.2008.03.010
24.N.Chandra,Evaluation of interfacial fracture toughness using cohesive zone model.Compos.Part A.Appl.Sci.Manuf.33(10),1433–1447(2002).https://doi.org/10.1016/S1359-835X(02)00173-2
25.Dassault Syste`mes,ABAQUS Version 6.10 HTML Documentation,2010
26.D.A.Koss,M.N.Kallas,J.R.Hellmann,Mechanics of interfacial failure during thin-slice fiber pushout tests.MRS Proc.(1993).https://doi.org/10.1557/proc-273-303
27.X.Yanfang,S.Tiexiong,Y.Meini,Study of interfacial stress distribution in SiC fiber reinforced titanium matrix composites on transverse tensile tests.J.Mater.Eng.Perform.21,2446–2450(2012).https://doi.org/10.1007/s11665-011-0094-y
28.J.I.Eldridge,P.K.Brindley,Investigation of interfacial shear strength in a SiC fibre/Ti-24Al-11Nb composite by a fibre pushout technique.J.Mater.Sci.Lett.8,1451–1454(1989).https://doi.org/10.1007/BF00720221
29.C.J.Yang,S.M.Jeng,J.M.Yang,Interfacial properties measurement for SiC fiber-reinforced titanium alloy composites.Scr.Metall.Mater.24,469–474(1990).https://doi.org/10.1016/0956-716X(90)90184-I
30.M.C.Watson,T.W.Clyne,The use of single fibre pushout testing to explore interfacial mechanics in SiC mono filament-reinforced Ti-I.A photoelastic study of the test.Acta Metall.Mater.40,131–139(1992).https://doi.org/10.1016/0956-7151(92)90206-T
猜你喜欢
杂志排行

Nuclear Science and Techniques的其它文章
- B4C/NRL flexible films for thermal neutron shielding
- Wetting behaviors of methanol,ethanol,and propanol on hydroxylated SiO2substrate
- Design and implementation of power and phase feedback control system for ICRH on EAST
- Data decomposition method for full-core Monte Carlo transport–burnup calculation
- New design for multi-crystal data collection at SSRF
- Design of a control system with high stability for a streak camera using isolated ADC