Design of a control system with high stability for a streak camera using isolated ADC
2018-03-07YuManFangXiangYanXuJinShouTianChengQuanPei
Yu-Man Fang•Xiang-Yan Xu•Jin-Shou Tian•Cheng-Quan Pei
1 Introduction
The streak camera is an indispensable instrument for studying X-ray burn duration and time of peak emission of imploding inertial con finement fusion(ICF)capsules,as well as beam pro file measurements of electron–positron colliders,due to its extremely high temporal and spatial resolution[1–3].At present,high-performance streak cameras have been developed in Japan[4,5],Russia[6],Germany[7],France[8],and USA[9,10].In addition to the main characterizations of the streak camera such as the temporal and spatial resolution,a high stability remains to be achieved.In an earlier paper[11],Liu et al.developed a C51 microcontroller unit(MCU)-based modular hardware system for the streak camera.However,the system stability suffered from a drastic decrease in the internal electromagnetic interface(EMI)and interference of high-voltage electrodes introduced through the ground of the analog-todigital converter(ADC)module.
As the electrode voltage can be up to hundreds or thousands of volts when a streak camera is operational[12],the high-voltage–power monitoring system needs to be isolated from the high-voltage system.To achieve this,we propose an isolated ADC design to monitor the highvoltage–power in the streak camera.This design is based on an isolated power supply and magnetically isolated device.With the isolated ADC technique,low-voltage electronic devices can be isolated from the high current if discharging occurs between parallel electrodes[13].Under this condition,the system performance is not limited by the local instability,ensuring normal operation of streak camera.
Furthermore,the streak camera requires remote-controlled operation,because the strong electromagnetic rich environment of the ICF is harmful to humans[14,15].Distributed control systems are widely employed in large facilities,such as the Beijing Spectrometer and Shanghai Synchrotron Radiation Facility[16–18].In this paper,a modular distributed control system and a graphical language(LabVIEW)-based software[19,20]were designed to realize a remote control.
2 System architecture
The X-ray streak camera is used to convert the temporal characteristic of an X-ray into the spatial characteristic.
The basic con figuration of the streak camera is shown in Fig.1,which consisted of an input optical element,streak tube, fiber optic taper,charge-coupled device(CCD)recording system,and control system.The streak tube was comprised of a photocathode,prefocusing electrodes,electric quadrupole lens,focusing electrodes,de flector,micro-channel plate(MCP),and phosphor screen.These components were housed in an air chamber.The communication of the programmable modules and industrial computer was realized with a controller area network(CAN)bus and Ethernet,and the host computer software was based on LabVIEW.The operation mode and other parameters were set up via a computer software interface.Therefore,the distributed remote control of the streak camera was realized.
An incident X-ray on the photocathode is converted into a number of electrons that are proportional to the intensity of the X-ray.Then,the produced electrons pass through the streak image tube.The prefocusing electrodes,electric quadrupole lens,and focusing electrodes are used to focus and accelerate the electrons.A high-speed push–pull scan ramp voltage is applied to the de flector when the electrons arrived.During the high-speed scan,the electrons,which arrive at different times,are de flected in different angles in the vertical direction and enter the MCP.As the electrons pass the MCP,they are multiplied several thousands of times.Then,the electrons impact against the phosphor screen and are converted to light.The brightness of the phosphor image is proportional to the intensity of the respective incident X-ray pulse.Finally,the phosphor images are coupled to the CCD recording system using a fiber optic taper,read out by CCD recording system,and displayed on the monitor.
2.1 Hardware system
The CAN bus is an ef ficacious serial communication network for the distributed control system.However,an isolation between the bus and module is required since an abnormal current may cause a CAN bus instability.In order to ensure normal operation and improve the internal EMI immunity,a separate ground system was employed.
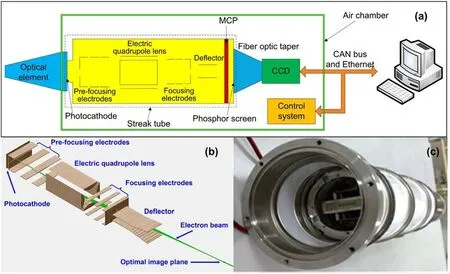
Fig.1(Color online)Basic con figuration of the streak camera:a streak camera schematic,b streak tube framework,and c streak tube appearance
The EMI immunity for a camera control system is very stringent due to the strong electromagnetic rich environment seen in ICF diagnosis.As the power supply stability is a key factor for stable operation of a digital device,the internal EMI immunity can be highly ensured by designing an ef ficacious power supply system and suitable overall architecture[21].The modular isolated power supply architecture is shown in Fig.2a.A magnetic isolation was employed between the processor and different modules.The modules contain the ADC acquisition module,digitalto-analog converter(DAC)control module,general-purpose input/output(GPIO)module,and environment monitoring module.A DC/DC converter with multi-output was designed to supply the power for the processor and different modules;the GND of the power supply for each module was separated completely.Furthermore,in order to reduce interferencefrom the high-voltageelectrodes introduced through the ADC module,the output side of the ADC module was isolated from its direct measurement side.The separated GND for the ADC acquisition module is shown in Fig.2b.With these methods,system malfunctions caused by local instability can be avoided.In addition,a transient voltage suppressor(TVS)and diode were employed to suppress the transient response.To ensure normal communication,a high-speed device based on iCoupler technology was used for magnetic isolation[22].
2.1.1 Hardware system architecture
The hardware system architecture of the control system is shown in Fig.3.The CAN bus and Ethernet were used for internal and external communications,respectively.The CAN bus was used for the data exchange between submodules and the main controller. Data from submodules were analyzed and processed by the main controller.Then,the generated command from the main controller was sent to the submodules.The main controller played a key role to manage submodules.The entire system communicated with the computer through a single optical fiber and a network module.The network module converted the optical signal to an electrical signal in which the TCP/IP was inserted.
The submodules containing the GPIO,ADC acquisition,DAC control,and environment monitoring modules were responsible for collecting data and executing output,but did little of the data processing.Each module had a speci fic function and was separated from each other.The combined sequence was remotely downloaded and modi fied to meet the control requirements of different conditions.
2.1.2 Isolated ADC
The isolated ADC was based on a Σ–Δ modulator and digital filter and is shown in Fig.4.Firstly,the Σ–Δ modulator was used to sample and quantize the analog signal at a sampling rate that was much larger than the Nyquist rate,and the output was a 1-bit data stream.Therefore,the quantization noise was moved from the baseband to higher frequencies,and the baseband quantization noise was reduced[23].Secondly,the digital filter was used to achieve low-pass filtering and decimation.Therefore,the high-frequency components of the modulation noise were attenuated.Due to the implementation of over-sampling technology,it was necessary for the modulated signal to be decimated.After filtering and decimation,the high-rate low-precision data stream was eventually converted into a low-rate high-precision digital signal.
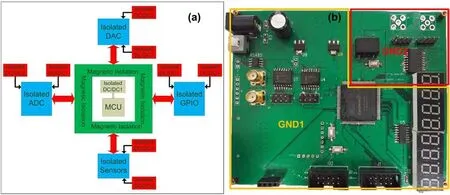
Fig.2(Color online)a Modular isolated power supply architecture and b separated GND diagram of the ADC acquisition module

Fig.3(Color online)Hardware architecture of the control system

Fig.4 Composition block diagram of the isolated ADC
The Σ–Δ modulator was a feedback loop,based on a differentiator,integrator,and comparator.It converts an analog signal into a high-speed 1-bit data stream with the delta modulation method.The principle diagram of the second-order Σ–Δ modulator is shown in Fig.5.
The z-transform function of the second-ordermodulator shown above is

Equation(1)shows that an input signal X(z)is transmitted without distortion.While the quantization noise E(z)is transmitted with a high-pass characteristic of second-order,the quantization noise is removed from the baseband.
The output of the Σ–Δ modulator is a serial data stream.In order to reconstruct an original input signal,the data stream is decimated and filtered by a cascaded integrator–comb(CIC) filter.The order of the filter should be higher by one,than the order of the noise-shaping function.The speci fied transfer function of the filter can be described by

where Mcis the decimation rate.The throughput of the filter is determined by the sampling and decimation rates of the modulator as follows

where fsis the sampling rate of the modulator.The principle diagram of the CIC filter is shown in Fig.6.
The front anti-aliasing filter can be simpli fied as a firstorder low-pass RC filter due to the implementation of oversampling technology.Compared to the ADC which samples at the Nyquist rate,an isolated ADC replaced most of the complex analog components with digital signal processing components.Therefore,the design and debugging were relatively simpler.

Fig.5 Principle diagram of the second-order Σ–Δ modulator

Fig.6 Principle diagram of CIC filter

Fig.7 Software framework of the control system
2.2 Software system
2.2.1 Software system architecture
The main control program was responsible for collecting data from the submodules,running module sequence combinations,and generating commands.The main controller was remotely accessed through an interface provided by the network communication program,which operated as a server.By inputting appropriate commands,the combined sequence and parameters of the submodules were modi fied.When the main control program was operating,the input data were read from the input BUFFER rather than from the submodules directly.At first,the resultant program operation was also stored in the output image area and transferred to the output BUFFER until the operation was complete.Therefore,the program could operate without considering the data exchange,and the design of software was subsequently simpli fied.The software framework of the control system is shown in Fig.7.

Fig.8(Color online)Software interface of the control system

Fig.9 Work flow of the program

Table 1 X-ray streak camera speci fications
The software system was based on LabVIEW,and the controlinterface is shown in Fig.8.Multithreading technology was employed in this design,so that the data transmission,data reception,and interrupt handling were processed using separate threads.Thus,the stability and processing speed of the software were improved.
2.2.2 Work flow

Fig.10(Color online)Photograph of the experimental setup
To meet the diagnostic requirement of ICF,the work flow of the program is shown in Fig.9.When the streak camera started to operate,the main control program firstly checked the environment conditions,and if these met the requirements,then the operation voltages were turned on.The high voltages were simultaneously monitored and compared with the default values.If the detected voltages matched the default values,the operation parameters of the camera were con figured.Otherwise,the program would set off an alarm and turn off the camera.
3 Results
The diagnostic requirement of the ICF was derived from the speci fications for the x-ray streak camera.Some of these,such as the spatial resolution,dynamic range,and temporal resolution,are listed in Table 1.
Figure 10 shows the X-ray streak camera with the designed control system in the experimental setup.With this control system,the static and dynamic spatial resolutions,dynamic range,and temporal resolution of the camera were measured.
The static spatial resolution was measured with the arrangement of Fig.11a.A mode-locked Nd:YLF pulsed laser(pulse width 7 ps and wavelength 263 nm)was used to generate the test pulse.
The spatial resolution was tested with a gold photocathode with a 200-μm-width slit and periodic pattern.

Fig.11(Color online)Experimental arrangements for:a static spatial resolution measurement,b dynamic spatial resolution measurement,c dynamic range and temporal resolution measurement,and d test pulse separated by the Fabry–Perot etalon

Fig.12(Color online)Gold photocathode and its slit pattern
Each period contained seven groups,and each group contained four bars.The resolutions of the bars in each group were 5,10,15,20,25,30,and 35 lp/mm.The gold photocathode and its slit pattern are shown in Fig.12.
The streak image and intensity distribution of the static spatial resolution test are shown in Fig.13.A static spatial resolution of 25 lp/mm(CTF=20%)was achieved.
The dynamic spatial resolution was measured with the arrangement of Fig.11b.The laser pulse from the Nd:YLF pulsed laser was injected into an air-gap Fabry–Perot etalon.Therefore,a train ofpulsesofmonotonically decreasing intensities,separated by the double-transit time of the etalon,was generated from each incoming laser pulse(Fig.11d).It was then necessary to record the train of pulses in a single streak photograph to obtain the direct measurement of the dynamic spatial resolution.The streak photograph for the measurement of the dynamic range and temporal resolution was recorded in the same method,except the gold photocathode did not have a periodic pattern,as shown in the arrangement of Fig.11c.
In the dynamic spatial resolution test,the full screen scan time was 4.5 ns,the full screen height was 2048 pixel,and the gap of the Fabry–Perot etalon was 45 mm.The streak image and intensity distribution of the dynamic spatial resolution test are shown in Fig.14.A dynamic spatialresolution of 20 lp/mm (CTF=20%)was achieved.
In the dynamic range test,the full screen scan time was 3.5 ns,the slit width of the photocathode was 100 μm,and the gap of the Fabry–Perot etalon was 30 mm.The scan image and intensity distribution are shown in Fig.15.The maximum and minimum intensities of the detected pulses were Imax=4960 and Inoise=2.994,respectively.Therefore,the dynamic range was

In the temporal resolution test,the full screen scan time was 500 ps,the slit width of the photocathode was 30 μm and the gap of the Fabry–Perot etalon was 1.1 mm.The scan image and intensity distribution are shown in Fig.16.Therefore,achieved temporal resolution was

4 Conclusion
In this paper,a modular distributed control system was developed to realize the remote control of a streak camera.We proposed an isolated ADC design to monitor the highvoltage–power in the streak camera.Compared to traditional methods,the entire scheme can be used to ef ficaciously enhance internal EMI hardening, thereby enhancing the system stability.Finally,some characterizations of the streak camera were measured.Static and dynamic spatialresolutions of 25 and 20 lp/mm(CTF=20%)were obtained,respectively.A dynamic range of 552:1 and a temporal resolution of 7.3 ps were achieved.These results con firmed that these characterizations are suf ficient for the speci fications that are derived from the diagnostic requirement of ICF.The distributed control system was successfully used in a streak camera to verify the synchronization of a multichannel laser on the ICF facility.With further updates,it can be used in a femtosecond streak camera.

Fig.14(Color online)Dynamic spatial resolution test:streak image and intensity distribution of central image

Fig.15(Color online)Dynamic range test:a scan image and b intensity distribution

Fig.16(Color online)Temporal resolution test:a scan image and b intensity distribution
1.S.F.Khan,J.J.Lee,N.Lzumi et al.,Characterization of the X-ray sensitivity of a streak camera used at the National Ignition Facility(NIF),in Proceedings of Target Diagnostics Physics and Engineering for Inertial Con finement Fusion II,San Diego,USA,27–28 Aug 2013.https://doi.org/10.1117/12.2024555
2.S.F.Khan,P.M.Bell,D.K.Bradley et al.,Measuring x-ray burn history with the Streaked Polar Instrumentation for Diagnosing Energetic Radiation(SPIDER)at the National Ignition Facility(NIF),in Proceedings of Target Diagnostics Physics and Engineering for Inertial Con finement Fusion,San Diego,USA,14 Aug 2012.https://doi.org/10.1117/12.930032
3.C.P.Welsch,H.H.Braun,E.Bravin et al.,Longitudinal beam pro file measurements at CTF3 using a streak camera.J.Instrum.1, P09002 (2006). https://doi.org/10.1088/1748-0221/1/09/P09002
4.A.Takahashi,M.Nishizawa,Y.Inagaki et al.,New femtosecond streak camera with temporal resolution of 180 fs,in Proceedings of Generation,Ampli fication,and Measurement of Ultrashort Laser Pulses,Los Angeles,USA,25–27 Jan 1994.https://doi.org/10.1117/12.175863
5.T.Yanagida,Y.Fujimoto,A.Yoshikawa et al.,Development and performance test of picosecond pulse X-ray excited streak camera system for scintillator characterization.Appl.Phys.Express 3,056202(2010).https://doi.org/10.1143/APEX.3.056202
6.N.V.Ageeva,S.V.Andreev,V.P.Degtyareva et al.,Sub-100 fs streak tube:computer-aided design,manufacturing,and testing,in Proceedings of 28th International Congress on high-Speed Imaging and Photonics,Canberra,Australia,9–14 Nov 2008.https://doi.org/10.1117/12.821666
7.W.Uhring,C.V.Zint,P.Summ et al.,Very high long-term stability synchros can streak camera.Rev.Sci.Instrum.74,2646–2653(2003).https://doi.org/10.1063/1.1569409
8.G.A.Naylor,K.Scheidt,J.Larsson et al.,A sub-picosecond accumulating streak camera for X-rays.Meas.Sci.Technol.12,1858–1864(2001).https://doi.org/10.1088/0957-0233/12/11/314
9.J.Feng,H.J.Shin,J.R.Nasiatka et al.,An X-ray streak camera with high spatio-temporal resolution.Appl.Phys.Lett.91,134102(2007).https://doi.org/10.1063/1.2793191
10.P.Gallant,P.Forget,F.Dorchies et al.,Characterization of a subpicosecond X-ray streak camera for ultrashort laser-produced plasmas experiments.Rev.Sci.Instrum.71,3627–3633(2000).https://doi.org/10.1063/1.1310347
11.J.Liu,Y.K.Ding,J.S.Tian et al.,Modular remote-controllable anisotropic focusing streak camera.High Power Laser Part.Beams 24, 2405–2410 (2012). https://doi.org/10.3788/HPLPB20122410.2405.(in Chinese)
12.V.N.Rai,M.Shukla,H.C.Pant et al.,Development of picosecond time resolution optical and X-ray streak cameras.Sadhana-Acad.P.Eng.S.20,937–954(1995).https://doi.org/10.1007/bf02745874
13.Z.C.Tan,M.Mueck,X.H.Du et al.,A fully isolated delta-sigma ADC for shunt based current sensing.IEEE J.Solid State Circuits 51, 2232–2240 (2016). https://doi.org/10.1109/JSSC.2016.2581800
14.J.W.Yang,T.S.Li,T.Yi et al.,Electromagnetic pulses generated from laser target interactions at Shenguang II laser facility.Plasma Sci.Technol.18,1044–1048(2016).https://doi.org/10.1088/1009-0630/18/10/13
15.P.Bell,D.Lee,A.Wooton et al.,Target area and diagnostic interface issues on the National Ignition Facility,in Proceedings of 13th Topical Conference on High-Temperature Plasma Diagnostics,Tucson,USA,18–22 June 2000.https://doi.org/10.1063/1.1310582
16.X.H.Chen,X.X.Xie,C.S.Gao et al.,Design and implementation of the BESIII detector-control system.Nucl.Instrum.Methods A 592,428–433(2008).https://doi.org/10.1016/j.nima.2008.04.072
17.G.H.Chen,J.F.Chen,T.M.Wan et al.,Database application research in real-time data access of accelerator control system.Nucl.Sci.Tech.23,267–271(2012).https://doi.org/10.13538/j.1001-8042/nst.23.267-271
18.Q.B.Yuan,M.Gu,R.P.Wang et al.,The control system for SSRF injection and extraction.Nucl.Sci.Tech.18,326–329(2007).https://doi.org/10.1016/S1001-8042(08)60002-0
19.J.Yan,R.Liu,C.Li et al.,LabVIEW-based auto-timing counts virtual instrument system with ORTEC 974 Counter/Timer.Nucl.Sci.Tech.20,307–311(2009).https://doi.org/10.13538/j.1001-8042/nst.20.307-311
20.P.Liu,Y.Wang,R.Z.Tai et al.,Implementation of effective control system for variable-included angle plane-grating monochromator.Nucl.Sci.Tech.22,9–12(2011).https://doi.org/10.13538/j.1001-8042/nst.22.9-12
21.B.K.Chung,A experiment on the layout and grounding of power distribution wires in a printed circuit board.IEEE Trans.Edu.44,315–321(2001).https://doi.org/10.1109/13.965778
22.R.Kliger,Integrated transformer-coupled isolation.IEEE Instru.Meas.Mag.6,16–19(2003).https://doi.org/10.1109/MIM.2003.1184271
23.J.C.Candy,A use of double integration in sigma delta modulation.IEEE Trans.Commun.33,249–258(1985).https://doi.org/10.1109/TCOM.1985.1096276
杂志排行

Nuclear Science and Techniques的其它文章
- B4C/NRL flexible films for thermal neutron shielding
- Wetting behaviors of methanol,ethanol,and propanol on hydroxylated SiO2substrate
- Design and implementation of power and phase feedback control system for ICRH on EAST
- Data decomposition method for full-core Monte Carlo transport–burnup calculation
- New design for multi-crystal data collection at SSRF
- Energy distributions of multiple backscattered photons in materials