ENSO Frequency Asymmetry and the Pacific Decadal Oscillation in Observations and 19 CMIP5 Models
2018-03-07RenpingLINFeiZHENGandXiaoDONG
Renping LIN,Fei ZHENG∗,2,and Xiao DONG
1International Center for Climate and Environment Sciences,Institute of Atmospheric Physics,Chinese Academy of Sciences,Beijing 100029,China
2Collaborative Innovation Center on Forecast and Evaluation of Meteorological Disasters,Nanjing University of Information Science and Technology,Nanjing 210044,China
1.Introduction
The El Niño–Southern Oscillation(ENSO),as the most important natural variation on the interannual timescale,exerts considerable impacts on global climate.Thus,for several decades,great attention has been paid to investigating the mechanisms of ENSO(Bjerknes,1969;Jin,1997;Wang and Picaut,2004).In recent years,the decadal modulations of ENSO have attracted significant attention(An and Wang,2000).Timmermann(2003)suggested a nonlinear mechanism that generates decadal ENSO amplitude modulations without invoking extratropical dynamics.Yeh et al.(2004)stated that the decadal modulation of ENSO is primarily due to atmospheric noise processes.
The Pacific Decadal Oscillation(PDO)is a climate mode on the decadal timescale that can influence global and regional climate(Mantua et al.,1997;Newman et al.,2016).Yeh and Kirtman(2005)investigated the relationship between Pacific decadal variability and decadal ENSO amplitude modulation and found that the PDO is unrelated to the modulation of ENSO amplitude.However,others have argued that the decadal modulations of ENSO variability are related to decadal climate modes,such as the PDO(Kravtsov,2011).Besides,Feng et al.(2014)claimed that the PDO can impact the evolution of ENSO,e.g.,El Niño(EN)decays slowly(rapidly)during positive(negative)PDO phases.Verdon and Franks(2006)investigated the interaction between ENSO and the PDO using proxy climate records derived from paleoclimate data of the past 400 years.
However,decadal modulation of ENSO frequency asymmetry has not been intensively studied.For example,are there more(fewer)EN events than La Niña(LN)events in positive(negative)PDO phases?In this study,using the output of 19 models from the Coupled Model Intercomparison Project Phase 5(CMIP5)experiments combined with observational data,we investigate the modulation of ENSO frequency asymmetry(EN and LN occurrence frequency)by the phases of the PDO.Specifically,the following two questions are addressed:(1)Is the frequency of EN and LN events modulated by different PDO phases?(2)If so,what is the reason for this decadal modulation?
2.Data and methods
The following datasets are used in this study:(1)monthly mean sea surface temperature data provided by the NOAA’s Extended Reconstructed SST dataset,version 3b(ERSST.v3b),with a horizontal resolution of2°×2°(Smith et al.,2008).This dataset is available from 1854 to the present day.(2)The Kalnay et al.(1996)NCEP–NCAR reanalysis(R1)dataset,with a resolution of 2.5°×2.5°and covering the period 1948–2014.(3)Global sea level pressure(SLP)data from the Second Hadley Centre SLP dataset(HadSLP2),with a resolution of 5°×5°(Allan and Ansell,2006).The period 1900–2014 is used to investigate the modulation of ENSO frequency asymmetry by the PDO.When the mechanism is examined,we use the circulation data from R1 over the period 1948–2014.
Additionally,outputs from the pre-industrial runs of 19 CMIP5 models are analyzed to validate observational results(Taylor et al.,2012).Details of the CMIP5 models used in this study are listed in Table 1.The coupled models are freely integrated for several hundred years—much longer than the time span of the observational data.Thus,more robust conclusions can be drawn if the results derived from the ensemble mean of the models are consistent with those from observation.
The commonly used Niño3.4 index associated with ENSO is defined as the area average of monthly SST anomalies in the region(5°N–5°S,170°–120°W)(Trenberth et al.,2002).The climatology is derived from the whole period of each dataset.The December–January–February(DJF)averaged Niño3.4 SST anomalies from the ERSST.v3b observations of 1900–2014 are shown in Fig.1a.The Niño3.4 index reveals substantial multi-decadal oscillations superimposed on interannual variability.Because our focus here is on the interannual variability of the Niño3.4 index,we apply a nineyear high-pass filter to the original Niño3.4 index,and obtain a new result for the Niño3.4 index without multi-decadal variability(Fig.1b).
We select EN(LN)events by identifying years when the Niño3.4 SST index exceeds 1(is less than−1)standard deviation.Additionally,the an indexRis calculated to reveal the difference between EN and LN event occurrence:
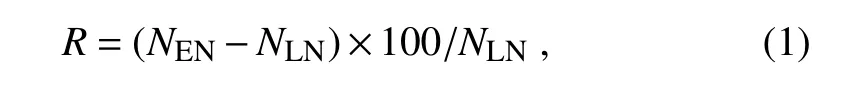
in whichNEN(NLN)denotes the number of EN(LN)events.R=0 means that the number of EN events is the same as the number of LN events.
The monthly PDO index is defined as the time series of the leading empirical orthogonal function(EOF)of monthly mean SST anomalies for the Pacific Ocean north of 20°N in the observational data(Mantua et al.,1997;Wang et al.,2012).Before performing the EOF calculation,the global mean SST anomaly is firstly removed to reduce the influence of long-term trends.Here,we mainly concentrate on the decadal modulation by the PDO,as in Feng et al.(2014).Following Wang et al.(2012),the Pacific decadal variability considered in this study is the first two EOFs of monthly SST anomalies in the North Pacific: the PDO and the North Pacific Gyre Oscillation(NPGO).In the observational data,the first(second)EOF is defined as the PDO(NPGO)(Wang et al.,2012).In the CMIP5 models,we provide the pattern correlation coefficients(PCCs)between two EOF modes of CMIP5 models and the observed PDO mode and NPGO mode(Table 2).We define the mode of a model as the PDO mode when the PCC of that mode with the observed PDO(NPGO)mode is higher(lower).According to this criterion,the second mode of eight models(ACCESS1.0,BCC CSM1.1,CanESM2,CESM1(CAM5),CNRM-CM5,CSIRO Mk3.6.0,FGOALS-s2 and MRI-CGCM3)is defined as the PDO mode.The final PDO patterns are also shown in Fig.2.The November–March(NDJFM)average is regarded as the PDO index(Fig.1c).Following Feng et al.(2014),positive(negative)PDO years are identified when the PDO index is greater(less)than zero.Furthermore,to exclude years when the PDO index is rather neutral,we select a threshold of the PDO index as 0.2 standard deviations,rather than zero as in Feng et al.(2014).The black line in Fig.1c denotes 0.2 standard deviations of the PDO index.Actually,the main results are insensitive to our chosen threshold.When identifying the numbers of EN and LN events,positive(negative)PDO years are considered as warm(cold)phases in the following analysis.

Table 1.Details of the pre-industrial control simulation experiments of the 19 CMIP5 models chosen in this study.
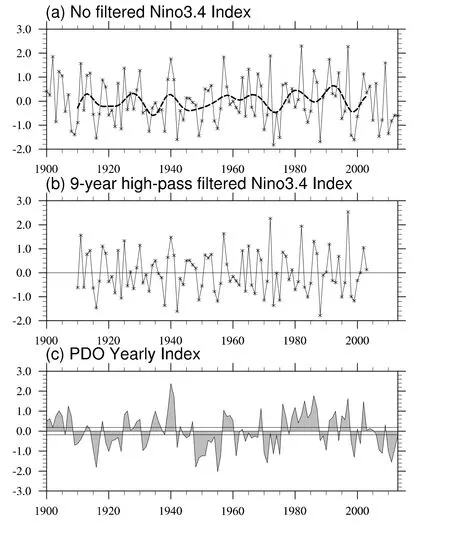
Fig.1.Time series of(a)unfiltered and(b)nine-year high-pass filtered DJF Niño3.4 index,and(c)yearly PDO index,derived from ERSST.v3b during 1900 to 2014.The dashed line in(a)is the nine-year low-pass filtered Niño3.4 index.The black lines in(c)denote 0.2 standard deviations of the yearly PDO index.
To test the significance of the modulation of ENSO frequency asymmetry by PDO phases,we use the Monte Carlo method(Chu and Wang,1997).In the 115 years of the observed time series(1900–2014),there are 45 positive PDO years.Thus,we choose 45 years randomly from the observed time series,one million times,to obtain one million samples.We then calculateRfor each sample.The probability distribution function(PDF)of the one millionRvalues is obtained.If the observedRis outside the 99%range of the PDF,we consider it to have reached the 99%level of significance according to the Monte Carlo test.The method is similar when the negative PDO phase is tested.
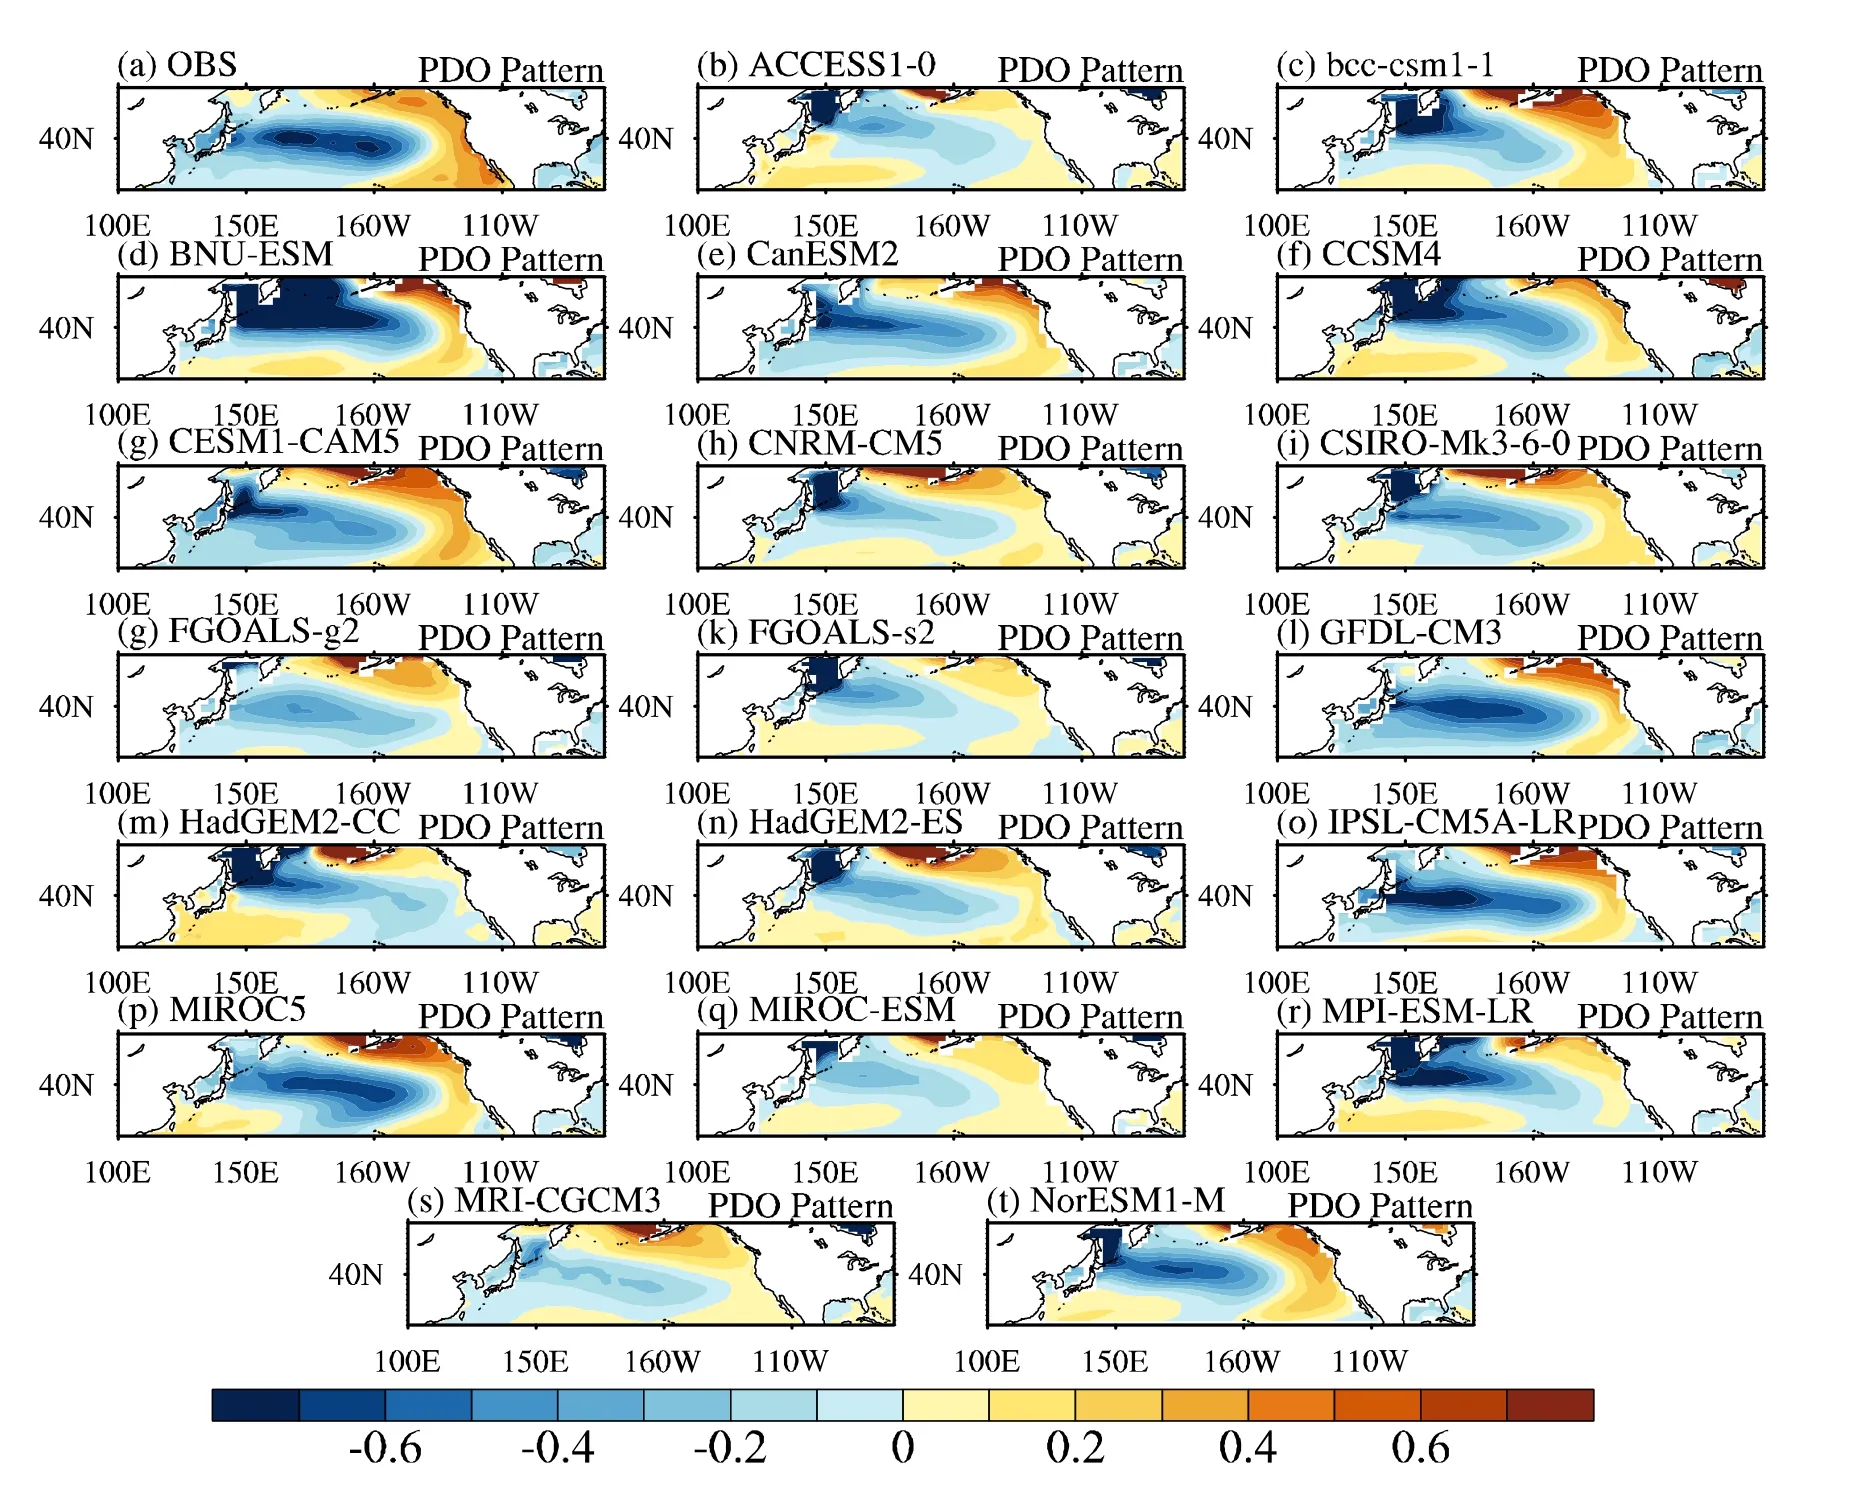
Fig.2.PDO patterns of the(a)observational data and(b–t)simulations of 19 CMIP5 models(names given above each panel).In ACCESS1.0,BCCCSM1.1,CanESM2,CESM1(CAM5),CNRM-CM5,CSIRO Mk3.6.0,FGOALS-s2 and MRI-CGCM3,the PDO patterns are defined as the second EOF mode of the North Pacific SST anomalies.In the observational data and other models,the PDO patterns are defined as the first EOF mode of the North Pacific SST anomalies.
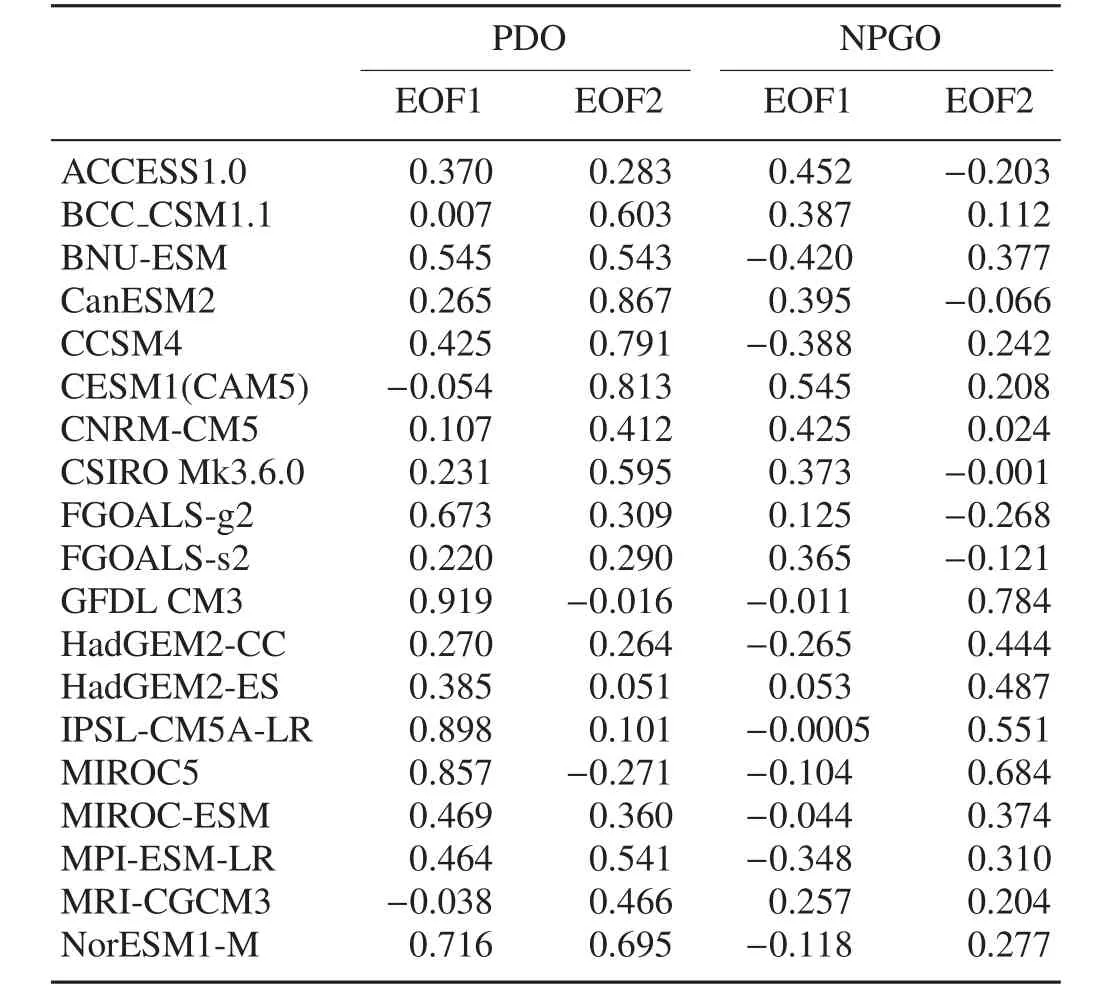
Table 2.PCCs between the observed EOF1 mode and simulated EOF1 and EOF2 modes in 19 models.
3.Results
3.1.SST difference between positive and negative PDO phases
Before examining the ENSO frequency asymmetry modulated by PDO phases,we firstly show the differences in SST,SLP and the wind field at 850 hPa between positive and negative PDO phases in Fig.3,in the observational data and in the multi-model simulations.The observational data show that the SLP difference between positive and negative PDO phases mainly occurs at midlatitudes.A notable negative anomaly occurs in the North Pacific,which is associated with the deepened Aleutian low in positive PDO phases.Additionally,although the PDO is defined as the leading empirical SST mode in the North Pacific,it has a considerable influence on the tropical Pacific.According to previous studies,this influence of the PDO on the tropics takes place via atmospheric teleconnections associated with the decadal background change(Barnett et al.,1999;Pierce et al.,2000;Wang and An,2002;Feng et al.,2014).In positive PDO phases,the eastern equatorial Pacific is anomalously warm.Similar conclusions have also been made by Feng et al.(2014)and Dong and Xue(2016).Additionally,compared to negative PDO phases,in positive PDO phases there are notable anomalous westerlies over the central equatorial Pacific.These PDO phase–dependent background westerly anomalies on the decadal timescale may be associated with the fact that more EN events tend to occur in positive PDO phases,although it is well known that westerly wind bursts are essential to triggering EN events(Lengaigne et al.,2004).

Fig.3.(a)Observed and(b–t)simulated(model names given above each panel)differences in SST(color shading;units: °C),SLP(contours;units:hPa)and 850-hPa wind(vectors;units:m s−1)between positive and negative PDO phases.
As for the simulation results,most models reproduce the negative SLP anomaly in the North Pacific,albeit with a slightly different location of the anomaly center.However,the magnitude of the SST anomaly—especially in the tropical eastern Pacific—is underestimated in most of the CMIP5 coupled models,which is associated with the weakly portrayed low-level westerly anomaly in the equatorial central Pacific.
3.2.ENSO composition in positive and negative PDO phases
To compare the EN/LN events between positive and negative PDO phases,we examine the spatial pattern of SST composition in EN/LN mature winter(DJF)in positive and negative PDO phases,separately(Fig.4).In positive PDO phases,in the observational data,with EN events the equatorial eastern Pacific is anomalously warm,and in the northern/southern central Pacific and equatorial western Pacific it is anomalously cool(Fig.4).The cooling anomaly in the northern and southern Pacific may be associated with the occurrence of a positive PDO phase,while that in the equatorial western Pacific may be associated with EN events(Shakun and Shaman,2009).Most models reproduce this spatial pattern of global SST,with respective regional bias( figure omitted).In negative PDO phases,with the positive SST anomaly in the central and eastern equatorial Pacific in EN events,the positive SST anomaly in the North Pacific is more significant than its South Pacific counterpart(Fig.4).Note that in positive PDO phases with EN events,the SST near the western coast of the American continent is anomalously warm;whereas,in negative PDO phases with EN events there is no significant signal.Besides,in the observational data,with EN events the positive SST anomaly in the equatorial eastern Pacific is much stronger in positive PDO phases than in negative PDO phases.Meanwhile,in the simulation results,models cannot reasonably reproduce this difference.That is,in the simulation results the contrast in magnitude between positive and negative PDO phase is negligible.

Fig.4.Composite SST anomaly spatial pattern(color shading;units:°C)in(a,b)EN and(c,d)LN mature winter(DJF)in(a,c)positive(i.e.,warm)and(b,d)negative(i.e.,cool)PDO phases,based on the observational data(lefthand panels)and multi-model ensemble mean(right-hand panels).The oblique lines denote values that exceed the 95%confidence level in the observational results.
With respect to LN events,the observational data in Fig.4c show that in positive PDO phases there are significantly negative SSTs in the equatorial central and eastern Pacific and central and western North Pacific.Meanwhile,a positive SST anomaly is located in most regions of the Pacific Ocean.The magnitude of the negative SST anomaly in the central and eastern equatorial Pacific in the multi-model ensemble of the CMIP5 models is stronger than that in the observational data.Besides,not all of the CMIP5 models reproduce the concurrent negative SST anomaly in both the northern and equatorial Pacific in positive-PDO-phase LN events.Even in those models that do,the location of the negative SST anomaly in the northern Pacific is considerablely biased compared to the observed location.Thus,as stated in previous studies,it is still a difficult task to simulate the connection between the PDO and ENSO,or between the midlatitudes and equatorial ocean(Newman et al.,2016).In negative PDO phases with LN events,the observed positive SST anomaly in the North Pacific shifts eastward compared to in positive phases,and a South Pacific counterpart exists(Fig.4d).Most of the CMIP5 models reproduce the horseshoe pattern in the Pacific reasonably.The main deviation of the models is the overly westward shifted cold tongue in the equatorial Pacific,which is an unresolved problem in the current CMIP5 models.In addition,the negative SST anomaly in the equatorial Pacific is much stronger in negative PDO phases than in positive PDO phases.As mentioned for the EN events,in the simulation results,models cannot reproduce this difference reasonably.The contrast in magnitude between positive and negative PDO phases in the simulation results is negligible.
Figure 5 shows the SST difference between positive and negative PDO phases in EN/LN events,separately.The results for EN and LN events are similar,i.e.,a negative(positive)center in the western and central North Pacific(equatorial central and eastern Pacific and coastline of the American continent).The multi-model ensemble reproduces the negative center in the North Pacific with only a slight location bias.However,the SST difference in the equatorial Pacific is rather weak.This indicates that many climate models suf-fer from bias in simulating the connection between the PDO and ENSO,or between the midlatitudes and equatorial ocean(Newman et al.,2016).

Fig.5.Composite spatial pattern of SST anomaly differences(color shading;units:°C)in(a)EN and(b)LN events between different PDO phases[positive(i.e.,warm)minus negative(i.e.,cool)],based on the observational data(left-hand panels)and multi-model ensemble mean(right-hand panels).
3.3.ENSO frequency asymmetry in different PDO phases
Next,we investigate the PDO phase–dependent ENSO frequency asymmetry using the method defined in section 2.As shown in Fig.6,results show that in positive(negative)PDO phasesRis positive(negative),indicating that EN is more frequent than LN in positive PDO phases,while LN is more frequent than EN in negative PDO phases.In the observational data,EN is 300%more(58%less)frequent than LN in positive(negative)PDO phases.That is,positive(negative)PDO phases are conducive to the occurrence of more EN(LN)events.Besides,the amplitude ofRis also asymmetric in positive and negative PDO phases.For instance,in positive PDO phases EN is 300%more frequent than LN,which is much larger than its counterpart in negative PDO phases(58%).We also drew the above figure with unfiltered Niño3.4 index values,and the results were almost the same( figure not shown).
To test the significance of our results,we apply the Monte Carlo significant test to the observational data.The PDF ofRin positive and negative PDO phases is shown in Fig.7.In positive(negative)PDO phases,the observedRvalue is positive(negative),which means that in positive(negative)PDO phases EN is more(less)frequent than LN.The same conclusion can be drawn from Fig.6.Besides,from Fig.7 it can be seen that the observedRvalue(red line)is beyond the threshold in both positive and negative PDO phases,indicating that our above conclusion,i.e.,that EN is more(less)frequent than LN in positive(negative)PDO phases,is significant at the 99%confidence level.The PDF distributions of the CMIP5 models are shown in Fig.8.Most of the CMIP5 model results are consistent with the observational results.However,there are six(seven)models that cannot reproduce the significant PDO phase–dependent ENSO asymmetry in positive(negative)PDO phases.This conclusion can also be drawn from Fig.6.
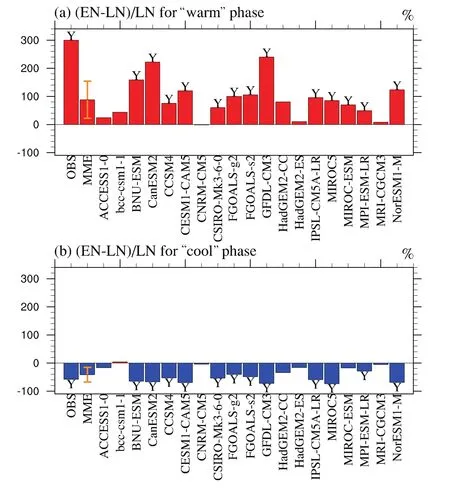
Fig.6.The R values(percentage difference between the number of EN and LN events relative to the number of LN events)based on the observational data(OBS),multi-model ensemble(MME),and 19 CMIP5 models.The letter“Y”indicates that the R value is statistically significant at the 1%level.The vertical line(orange)denotes one standard deviation for the 19 model results.

Fig.7.PDF of R in(a)positive and(b)negative phases of the PDO in the Monte Carlo test with a sample size of 1 000 000.The red line denotes the observed value of R and the blue line denotes the threshold[99%percentile for(a)and 1%percentile for(b)]beyond which the observed R can be regarded as significant.
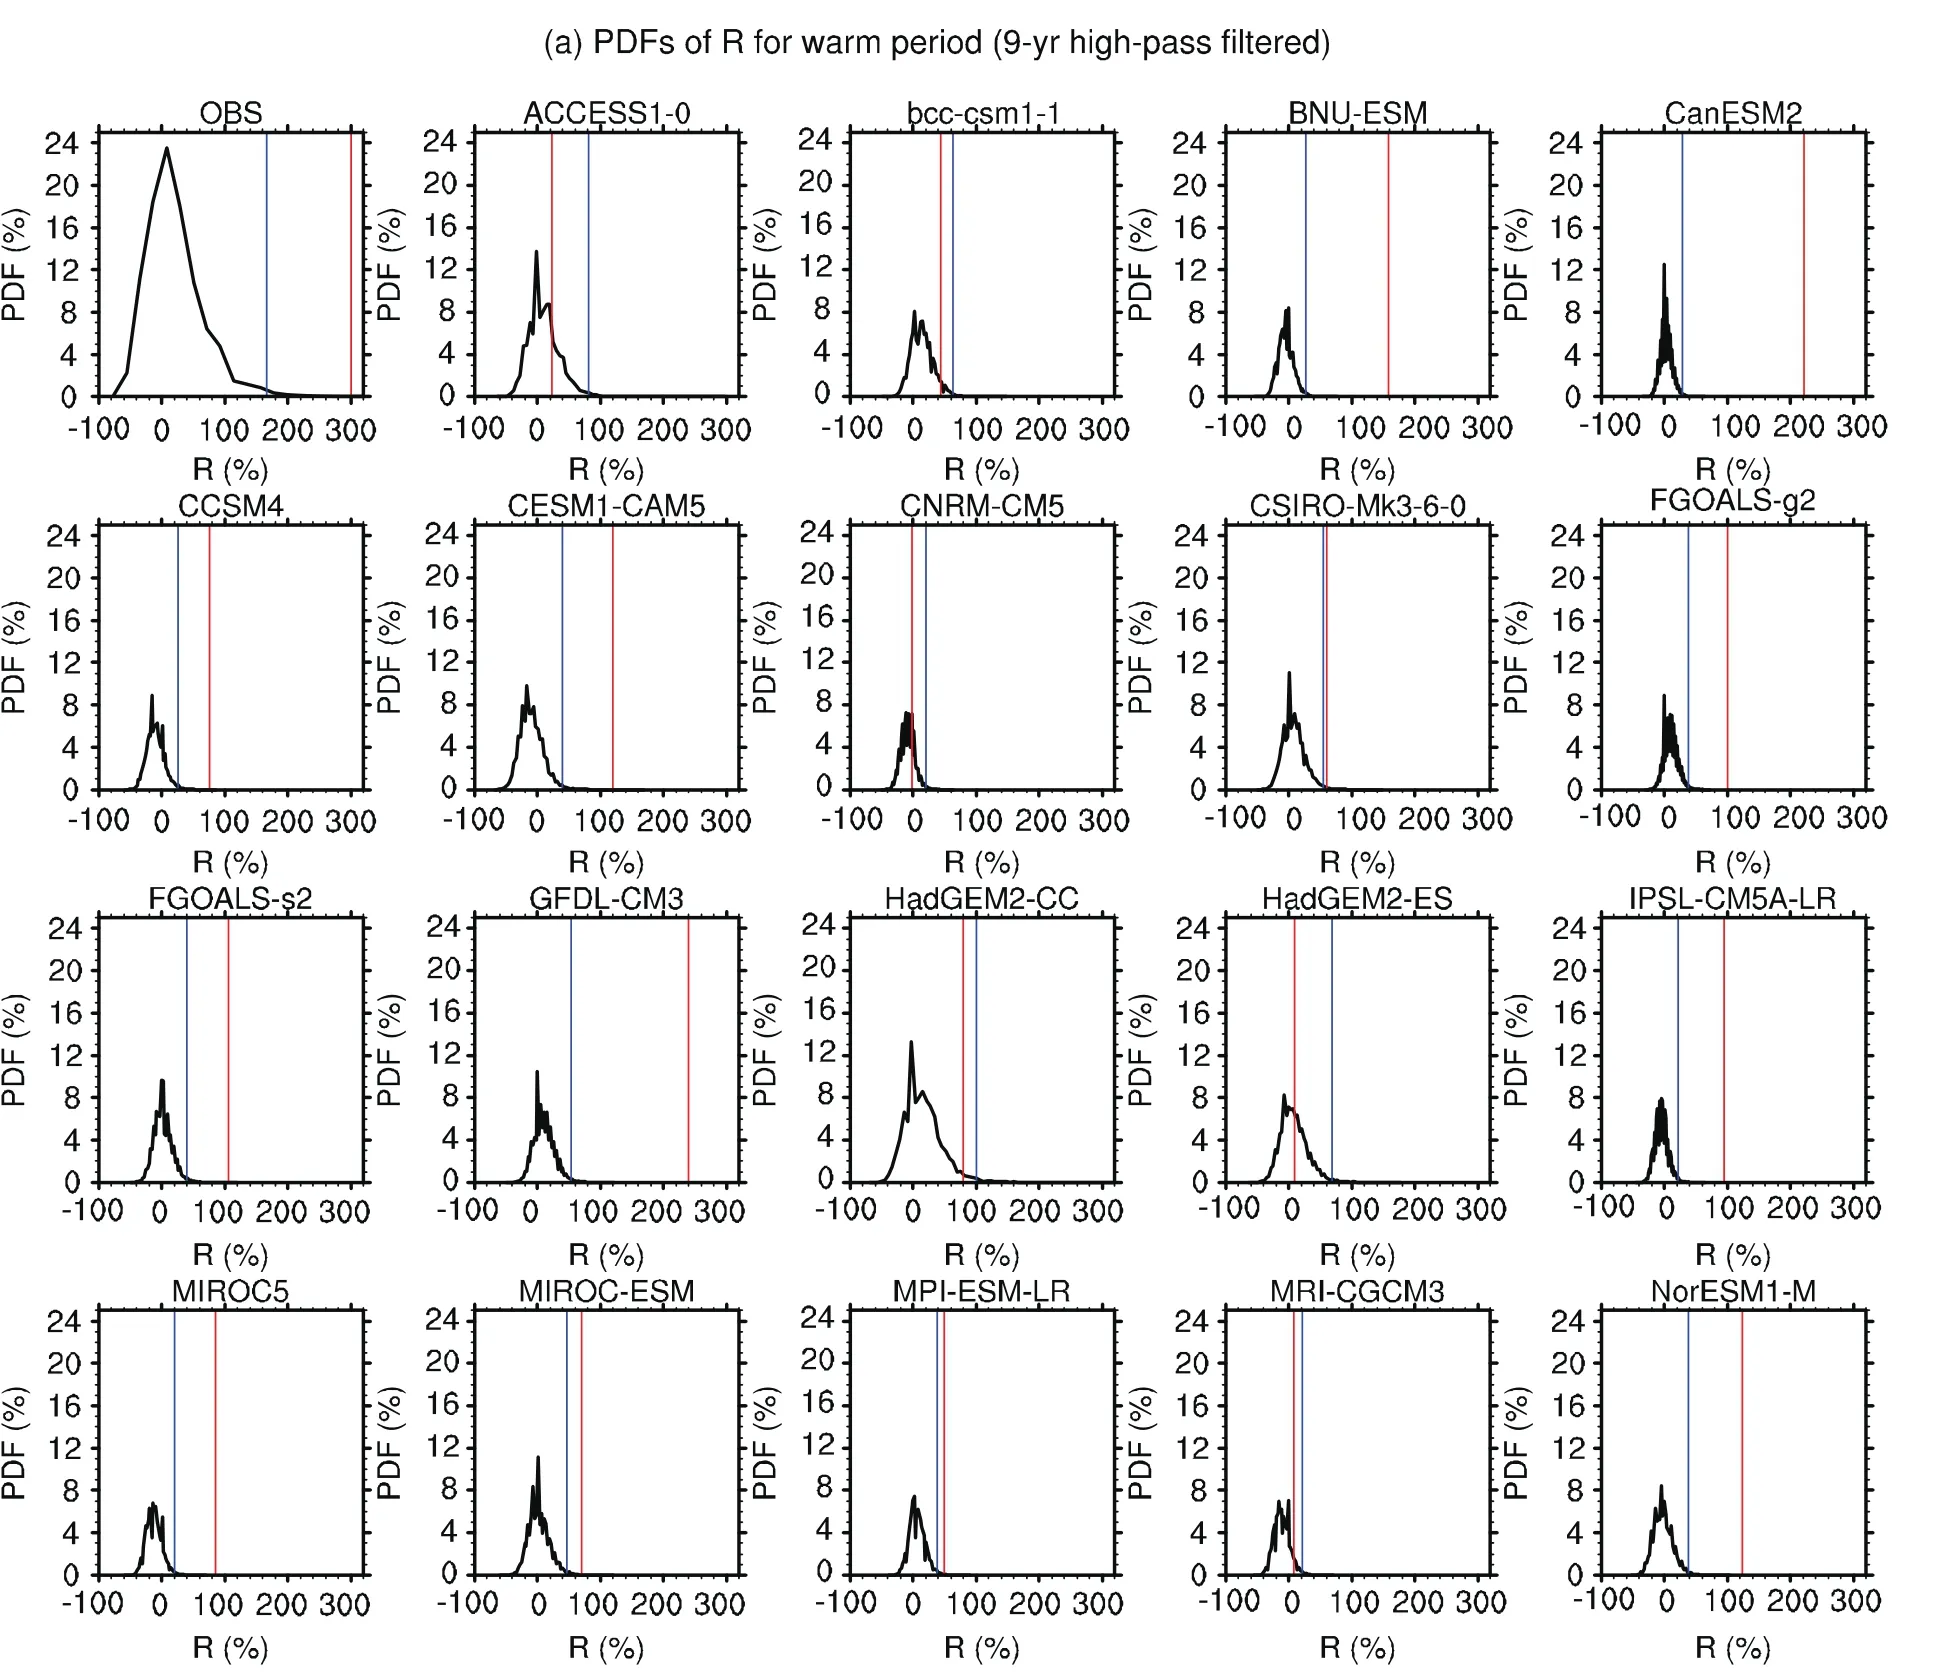
Fig.8.PDF of R derived from the observational data(OBS)and 19 CMIP5 models in(a)positive and(b)negative phases of the PDO in the Monte Carlo test with a sample size of 1 000 000.The red line denotes the value of R and the blue line denotes the threshold(99%percentile)beyond which R can be regarded as significant.

Fig.8.(Continued)
3.4.Discussion on the relationship between the PDO and ENSO
To examine the possible causes of the ENSO frequency asymmetry between positive and negative PDO phases,the differences in SST,SLP and the wind field at 850 hPa between positive and negative PDO phases can be referred to,as mentioned in subsection 3.1(Fig.3).It can be seen that,although the PDO is defined as the leading empirical SST mode in the North Pacific,it has a considerable influence on the tropical Pacific.In positive PDO phases,the eastern equatorial Pacific is anomalously warm.Additionally,compared to negative PDO phases,in positive PDO phases there are notable anomalous westerlies over the central equatorial Pacific.This PDO-dependent westerly anomaly over the central equatorial Pacific on the decadal timescale may be with the fact that more EN rather than LN events tend to occur in positive PDO phases.However,it should be acknowledged that,from the evidence shown here, one cannot say for certain that it is the PDO that results in the occurrence of more EN events.Notably,previous studies(e.g.,Newman et al.2003)argue that the PDO is an ENSO-forced signal.In this paper,using observational data and CMIP5 coupled model results,we only reveal the phenomenon that there tend to be more EN events in positive PDO phases.Of course,two possibilities exist,i.e.,that the PDO influences ENSO or vice versa.More work(e.g.,numerical sensitivity experiments)should be carried out to explore the mechanisms involved(i.e.,whether the PDO influences ENSO,or the other way around).
4.Conclusions and discussion
This study examines the modulation of ENSO frequency asymmetry by the different phases of the PDO.Results from observational data show that more EN(LN)events tend to occur in positive(negative)PDO phases.Specifically,EN is 300%more(58%less)frequent than LN in positive(negative)PDO phases.Monte Carlo testing is used to check the significance of the above observational evidence,and the results show that the conclusion,i.e.,that EN is more(less)frequent than LN in positive(negative)PDO phases,is statistically significant at the 99%confidence level.Besides the observational evidence,the pre-industrial simulations of 19 CMIP5 models are analyzed using the same method as with the observed data.We find that most of the CMIP5 models exhibit the same results as observed in both positive and negative PDO phases,indicating that ENSO frequency asymmetry is indeed modulated by the PDO phases.
The modulation of ENSO frequency asymmetry by the PDO may be due to the background SST and circulation patterns in different PDO phases.In positive PDO phases there are notable anomalous westerlies over the central equatorial Pacific,which are associated with the warming SST east of the anomalous low-level wind.Thus,this decadal-scale westerly wind anomaly associated with positive PDO phases may encourage more EN events,rather than LN events,to occur.However,in previous studies(e.g.,Newman et al.,2003)it has been argued that the PDO is an ENSO-forced signal.Of course,two possibilities exist—that the PDO influences ENSO or vice versa.In this paper,using observational data and CMIP5 coupled model results,we only seek to reveal the phenomenon that there tend to be more EN events in positive PDO phases,and in doing so we find that this relationship between the PDO and ENSO is statistically significant based on the Monte Carlo test.
Besides analysis of observational data and CMIP5 multimodel pre-industrial control simulations,sensitivity experiments using numerical models are necessary to fully explore the modulation of ENSO frequency asymmetry by the different PDO phases.Such work has recently begun using a coupled climate model with assimilated SST in the ocean component(Dong et al.,2016).Indeed,it has already been found that this method can reproduce the decadal variation of the East Asian summer monsoon reasonably well(Lin et al.,2016).Thus,further study using model experiments to investigate the associated mechanisms is warranted.
Acknowledgements.We appreciate the suggestions and comments from the two anonymous reviewers and the Editor,which helped to improve the quality of the original paper.This work was jointly supported by the National Key R&D Program of China(Grant No.2017YFA0604201),the National Natural Science Foundation of China(Grant Nos.41576019,41606027 and 41706028),and the China Postdoctoral Science Foundation(Grant No.2015M571095).
Allan,R.,and T.Ansell,2006:A new globally complete monthly historical gridded mean sea level pressure dataset(HadSLP2):1850-2004.J.Climate,19,5816–5842,https://doi.org/10.1175/JCLI3937.1.
An,S.I.,and B.Wang,2000:Interdecadal change of the structure of the ENSO mode and its impact on the ENSO frequency.J.Climate,13,2044–2055,https://doi.org/10.1175/1520-0442(2000)013<2044:ICOTSO>2.0.CO;2.
Barnett,T.P.,D.W.Pierce,M.Latif,D.Dommenget,and R.Saravanan,1999:Interdecadal interactions between the tropics and midlatitudes in the Pacific basin.Geophys.Res.Lett.,26,615–618,https://doi.org/doi:10.1029/1999GL900042.
Bjerknes,J.,1969:Atmospheric teleconnections from the equatorial Pacific.Mon.Wea.Rev.,97(3),163–172,https://doi.org/10.1175/1520-0493(1969)097<0163:ATFTEP>2.3.CO;2.
Chu,P.S.,and J.X.Wang,1997:Tropical cyclone occurrences in the vicinity of Hawaii:Are the differences between El Niño and non-El Niño years significant?J.Climate,10(10),2683–2689,https://doi.org/10.1175/1520-0442(1997)010<2683:TCOITV>2.0.CO;2.
Dong,X.,and F.Xue,2016:Phase transition of the Pacific decadal oscillation and decadal variation of the East Asian summer monsoon in the 20th century.Adv.Atmos.Sci.,33(3),330–338,https://doi.org/doi:10.1007/s00376-015-5130-7.
Dong,X.,R.P.Lin,J.Zhu,and Z.T.Lu,2016:Evaluation of ocean data assimilation in CAS-ESM-C:Constraining the SST field.Adv.Atmos.Sci.,33(7),795–807,https://doi.org/10.1007/s00376-016-5234-8.
Feng,J.,L.Wang,and W.Chen,2014:How does the East Asian summer monsoon behave in the decaying phase of El Niño during different PDO phases?J.Climate,27,2682–2698,https://doi.org/10.1175/JCLI-D-13-00015.1.
Jin,F.F.,1997: An equatorial ocean recharge paradigm for ENSO.Part I:Conceptual model.J.Atmos.Sci.,54(7),811–829,https://doi.org/10.1175/1520-0469(1997)054<0811:AEORPF>2.0.CO;2.
Kalnay,E.,and Coauthors,1996: The NCEP/NCAR 40-year reanalysis project.Bull.Amer.Meteor.Soc.,77(3),437–472,https://doi.org/10.1175/1520-0477(1996)077<0437:TNYRP>2.0.CO;2.
Kravtsov,S.,2011:An empirical model of decadal ENSO variability.Climate Dyn.,39(9–10),2377–2391,https://doi.org/10.1007/s00382-012-1424-y.
Lengaigne,M.,E.Guilyardi,J.P.Boulanger,C.Menkes,P.Delecluse,P.Inness,J.Cole,and J.Slingo,2004:Triggering of El Ni˜no by westerly wind events in a coupled general circulation model.Climate Dyn.,23(6),601–620,https://doi.org/10.1007/s00382-004-0457-2.
Lin,R.,J.Zhu,and F.Zheng,2016:Decadal shifts of East Asian summer monsoon in a climate model free of explicit GHGs and aerosols.Scientific Reports,6,38546,https://doi.org/10.1038/srep38546.
Mantua,N.J.,S.R.Hare,Y.Zhang,J.M.Wallace,and R.C.Francis,1997:A Pacific interdecadal climate oscillation with impacts on salmon production.Bull.Amer.Meteor.Soc.,78,1069–1079,https://doi.org/10.1175/1520-0477(1997)078<1069:APICOW>2.0.CO;2.
Newman,M.,and Coauthors,2016:The Pacific decadal oscillation,revisited.J.Climate,29(12),4399–4427,https://doi.org/10.1175/JCLI-D-15-0508.1.
Pierce,D.W.,T.P.Barnett,and M.Latif,2000:Connections between the Pacific Ocean tropics and midlatitudes on decadal time scales.J.Climate,13,1173–1194.
Shakun,J.D.,and J.Shaman,2009:Tropical origins of North and South Pacific decadal variability.Geophys.Res.Lett.,36,L19711,https://doi.org/10.doi:1029/2009GL040313.
Smith,T.M.,R.W.Reynolds,T.C.Peterson,and J.Lawrimore,2008:Improvements to NOAA’s historical merged land–ocean surface temperature analysis(1880-2006).J.Climate,21,2283–2296,https://doi.org/10.1175/2007JCLI2100.1.
Taylor,K.E.,R.J.Stouffer,and G.A.Meehl,2012:An overview of CMIP5 and the experiment design.Bull.Amer.Meteor.Soc.,93,485–498,https://doi.org/10.1175/BAMS-D-11-00094.1.
Timmermann,A.,2003:Decadal ENSO amplitude modulations:A nonlinear paradigm.Global and Planetary Change,37(1–2),135–156,https://doi.org/10.1016/S0921-8181(02)00194-7.
Trenberth,K.E.,J.M.Caron,D.P.Stepaniak,and S.Worley,2002:Evolution of El Niño–Southern Oscillation and global atmospheric surface temperatures.J.Geophys.Res.,107,4065,https://doi.org/doi:10.1029/2000JD000298.
Verdon,D.C.,and S.W.Franks,2006:Long-term behaviour of ENSO:interactions with the PDO over the past 400 years inferred from paleoclimate records.Geophys.Res.Lett.,33(6),L06712,https://doi.org/10.1029/2005GL025052.
Wang,B.,and S.I.An,2002:A mechanism for decadal changes of ENSO behavior:Roles of background wind changes.Climate Dyn.,18,475–486,https://doi.org/10.1007/s00382-001-0189-5.
Wang,C.Z.,and J.Picaut,2004:Understanding ENSO physics—a review.Earth’s Climate:The Ocean-Atmosphere Interaction,C.Wang et al.,Eds.,American Geophysical Union,21–48,https://doi.org/10.1029/147GM02.
Wang,H.,A.Kumar,W.Q.Wang,and Y.Xue,2012:Influence of ENSO on Pacific decadal variability:An analysis based on the NCEP climate forecast system.J.Climate,25,6136–6151,https://doi.org/10.1175/JCLI-D-11-00573.1.
Yeh,S.W.,and B.P.Kirtman,2005:Pacific decadal variability and decadal ENSO amplitude modulation.Geophys.Res.Lett.,32(5),L05703,https://doi.org/10.1029/2004GL021731.
Yeh,S.W.,J.G.Jhun,I.S.Kang,and B.P.Kirtman,2004:The decadal ENSO variability in a hybrid coupled model.J.Climate,17(6),1225–1238,https://doi.org/10.1175/1520-0442(2004)017<1225:TDEVIA>2.0.CO;2.
杂志排行
Advances in Atmospheric Sciences的其它文章
- Analysis of the Characteristics of Inertia-Gravity Waves during an Orographic Precipitation Event
- Interannual Variations in Synoptic-Scale Disturbances over the Western North Pacific
- A Prototype Regional GSI-based EnKF-Variational Hybrid Data Assimilation System for the Rapid Refresh Forecasting System:Dual-Resolution Implementation and Testing Results
- Vortex Rossby Waves in Asymmetric Basic Flow of Typhoons
- Organizational Modes of Severe Wind-producing Convective Systems over North China
- The 30–60-day Intraseasonal Variability of Sea Surface Temperature in the South China Sea during May–September