Variations in High-frequency Oscillations of Tropical Cyclones over the Western North Pacific
2018-03-06ShuminCHENWeibiaoLIZhipingWENMingsenZHOUYouyuLUYuKunQIANHaoyaLIUandRongFANGSchoolofAtmosphericSciencesCenterforMonsoonandEnvironmentResearchGuangdongProvinceKeyLaboratoryforClimateChangeandNaturalDisasterStudiesSunYa
Shumin CHEN,Weibiao LI∗,Zhiping WEN,Mingsen ZHOU,2,Youyu LU,Yu-Kun QIAN,Haoya LIU,and Rong FANGSchool of Atmospheric Sciences/Center for Monsoon and Environment Research/Guangdong Province Key Laboratory for Climate Change and Natural Disaster Studies,Sun Yat-Sen University,Guangzhou 50275,China
2Guangzhou Institute of Tropical and Marine Meteorology,China Meteorological Administration,Guangzhou 510062,China
3Bedford Institute of Oceanography,Fisheries and Oceans Canada,Dartmouth,Nova Scotia B2Y 4A2,Canada
4State Key Laboratory of Tropical Oceanography,South China Sea Institute of Oceanology,Chinese Academy of Sciences,Guangzhou 510301,China
1.Introduction
Tropical cyclones(TCs)are one of the most destructive natural disasters to affect coastal regions(Emanuel,2005;Peng et al.,2014)and pose great Scientific challenges to meteorologists.TCs are complex systems and their intensities are affected by a variety of physical processes.Many studies have focused on the TC updraft and updraft-produced eye wall;i.e.,conditional instability of the second kind(Charney and Eliassen,1964),vortical hot towers(Hendricks et al.,2004;Montgomery et al.,2006),and secondary rainbands(e.g.,Montgomery and Kallenbach,1997;Reasor et al.,2000).Because the eye wall is essential for TC evolution,studies have been conducted on small-scale processes within the eye wall,such as the eye wall replacement cycle(Shapiro and Willoughby,1982;Willoughby et al.,1982;Chen,1987)and wave activities.The latter aspect generally covers the stationary wavenumber-one convective pattern(Reasor et al.,2009),vortex Rossby waves(Zhong et al.,2009;Menelaou and Yau,2014),inertia gravity waves(Kurihara,1976;Willoughby,1976;Schecter,2008;Ki and Chun,2011), fine-scale spiral rain bands(Gall et al.,1998)associated with Kelvin–Helmholtz instability(Romine and Wilhelmson,2006),inertial-buoyancy waves(Li et al.,2010),and semi-diurnal convection(Kossin,2002).However,the cited studies were largely confined to the horizontal structures of waves.The short-term temporal evolution and vertical propagation of waves have not been fully investigated.
Chen et al.(2015)used both observational data and modeling results to identify high-frequency oscillations having a period of approximately 2 h in the vertical structure of secondary circulations within the eye wall of analyzed TCs in the South China Sea(SCS).These oscillations occur within the vertical motion,convergence and dry air density around the eye wall,and induce oscillation of the TC intensity through the oscillation of convection.The present study further investigates variations of the high-frequency oscillations of TCs over the western North Pacific(WNP)via numerical model simulations(owing to a lack of observations).Here,the difference in TCs in the SCS and WNP excluding the SCS (hereafter referred to as the open WNP) are analyzed because some physical characteristics differ between these two regions during TC intensification,owing to the distribution of land(as detailed by Chen et al.,2014).
The rest of the paper is organized as follows:Section 2 gives a general description of the model.Section 3 presents a power spectrum analysis of an ensemble of 15 simulated TCs,and determines the variation in the high-frequency oscillation between the open WNP and SCS.Section 4 presents the physical features that are further demonstrated in a case simulation of Typhoon Hagupit(2008).Section 5 draws conclusions from the results of the study and presents a discussion.
2.General description of the model settings
The simulations in this study are performed using the Weather Research and Forecasting(WRF)model(Skamarock et al.,2008).In our simulations,the model has 28 unevenly spaced vertical levels and greater resolution in the planetary boundary layer.The top level of the model is set to a pressure of 50 hPa.The model physics chosen are the Kain–Fritsch cumulus parameterization scheme(Kain and Fritsch,1990,1993;Kain,2004),WSM6 microphysics scheme(Hong et al.,2004),YSU PBL scheme(Hong and Lim,2006), five-layer thermal diffusion land surface model(Skamarock et al.,2008),long wave radiation scheme of the Rapid Radiative Transfer Model(Mlawer et al.,1997),and Dudhia shortwave radiation scheme(Dudhia,1989).
Dynamic downscaling is applied to simulate small-scale and mesoscale features of the TCs.First,one-way nesting is used for the coarser-resolution model covering an outer domain,taking initial and boundary conditions from the sixhourly NCEP Final Analysis(FNL)data.This involves horizontally and vertically interpolating the analysis fields on 1°×1°horizontal cells and having mandatory pressure levels of the WRF model cells.Next,two-way nesting is used to link the outer-domain model with an inner-domain model with finer horizontal resolution.For this application,the sea surface temperature, fixed in time but spatially varying during model integration,is also obtained from NCEP FNL data.According to the relationship between the period and discrete scale given by Torrence and Compo(1998),a period of two hours corresponds to a spatial scale of about 10 km.A resolution of 3–4 km is hence used in the simulation to study the high-frequency oscillations.
3.Analysis of an ensemble of simulated TCs
3.1. Description of the ensemble of simulations
Table 1 lists the 15 TCs simulated using the WRF model.These cyclones occurred during 2008–2014 in the WNP,and seven were active in the SCS.For these simulations,the twoway interactive WRF model includes two components covering two fixed domains with Lambert projections for the open WNP and SCS(Fig.1).Domain 1,the outer mesh,has a horizontal resolution of 12 km and is designed to simulate the synoptic-scale environment in which the TCs evolved.Domain 2 has a horizontal resolution of 4 km and is designed to simulate TC mesoscale structure.The simulations are initialized when each TC reaches tropical storm intensity.Each simulation spans 192 h.
The simulated TC tracks and intensities,defined by the minimum sea-level pressure(MSLP)and the maximum wind speed at 10 m(MWS10),are compared with observational data.The observed TC tracks are obtained from the best-track observation dataset compiled by the Shanghai TyphoonInstitute(STI)of the China Meteorological Administration(CMA)(Ying et al.,2014).Figure 2 shows good agreement between observed and simulated TC tracks in Domain 2 in terms of the discrepancy in the TC center locations being less than 150 km on average.

Table 1.List of TCs,start times of the experiments,and analysis durations for the ensemble of simulations.
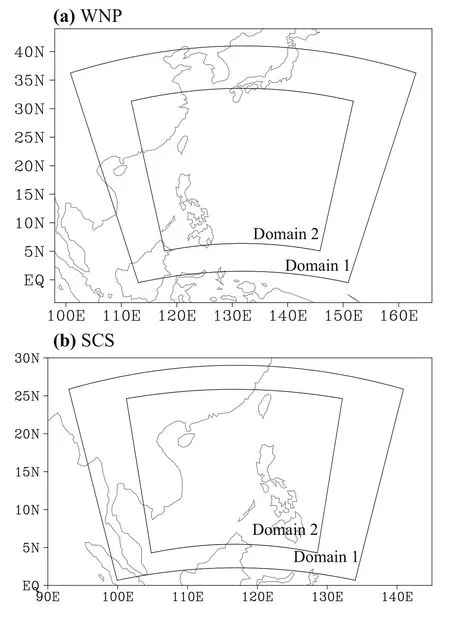
Fig.1.Domains of the WRF model for the ensemble of TC simulations of(a)the open WNP and(b)the SCS.
Table 2 lists the maximum MWS10of the observed and simulated TCs.The simulated intensities are comparable to the observed intensities;however,the simulated intensities of TCs in the open WNP and SCS are similar because the simulated intensities are a little weaker and stronger in the open WNP and SCS,respectively.Table 3 lists correlations between TC intensities obtained from simulations and the best-track data.The trends of the simulated TC intensities are similar to those of observations,because all correlations are significant at the 95%confidence level according to the t-test,except in the case of the MWS10of Typhoon Chan-Hom(2009).It is thus concluded that the simulated and observed TC intensities agree well because the magnitude and trends of TC intensities are comparable to observations.Because the high-frequency oscillations are more significant in TCs with higher intensity,the following analysis is applied to model outputs during the period(also listed in Table 1)when the simulated TC intensity is stronger than severe tropical storm intensity(i.e.,an MWS10exceeding 24.5 m s−1).

Fig.2.Tracks of TCs at 6-h intervals from the ensemble of simulations(dashed lines with open circles)and best-track data(solid lines with filled circles)for TCs in(a)the open WNP and(b)the SCS.The best-track data are from CMA-STI.Here,except in the cases of Man-yi(2007),Chanthu(2010),Hagupit(2008),and Chan-Hom(2009),which respectively started at 1800 UTC 9 July,1800 UTC 19 July,1800 UTC 19 September,and 0000 UTC 5 May,all tracks begin at the start times of the experiments listed in Table 1.
3.2. General features of the difference between the open WNP and SCS
According to our previous study(Chen et al.,2015),high frequency oscillations are significant in both variables(i.e.,density,horizontal velocities and vertical velocities)averaged over the eyewall region and the MWS10.Thus,considering that the MWS10is widely used to represent the intensity of a TC,the MWS10is used for the analysis in the present study.Following Gilman et al.(1963)and Stott et al.(2002),power spectrum analysis is performed for the simulated MWS10,with a temporal interval of 15 min.Prior to this analysis,each MWS10time series is high-pass filtered by subtracting its running average over a 6-h window.Figure 3 shows the resulting power spectrum density and the noise spectrum computed following Stott et al.(2002).Areas with spectrum density higher than the noise spectrum can be regarded as significant during the corresponding periods.Figure 4 shows the averaged significant periods and their variation ranges according to the results presented in Fig.3.Here,only the smallest significant period is considered because double periods are also significant for some TCs[i.e.,Neoguri(2008)and Hagupit(2008)shown in Fig.3].For all simulated TCs,significant high-frequency oscillations are identified,with averaged periods of 2.33–4.15 h in the open WNP and 1.12–3.20 h in the SCS.The means of the averaged periods of TCs in the open WNP and the SCS are 2.83 and 1.93 h,respectively.Additionally,the variation range of the oscillation periods of TCs in the open WNP is longer than that in the SCS,with the mean of variation ranges being 1.25 h in the open WNP and 0.66 ho in the SCS.

Table 2.Maximum MWS10from the ensemble of simulations of TCs in(a)the open WNP and(b)the SCS.

Table 3.Correlations of MSLP and MWS10between TCs from the ensemble of simulations and best-track data.The best-track data are from CMA-STI.Values with “*”indicate correlation at the>95%confidence level,based on the t-test.
The Butterworth bandpass filter method is applied to the MWS10of each simulated TC to analyze the magnitude of high-frequency oscillations.The time series of high-frequency oscillation is obtained by filtering the variation range of the significant periods in Fig.4.The deviation and maximum amplitude(listed in Table 4)of the filtered time seriesareusedtodescribethemagnitudesofhigh-frequencyoscillations.The deviations and maximum magnitude are similar in the open WNP and SCS,although the significant period in the open WNP is longer than that in the SCS.
3.3.Factors of variations of periods in the two oceans
It can be concluded from the work of Chen et al.(2015)that high-frequency oscillations are significant within TC secondary circulations that interact with the TC intensity.The variation in the significant oscillation periods in the openWNP and SCS is thus probably due to the disturbance of the TC intensity or secondary circulation that is enhanced by the TCs themselves or the environment.Factors for the disturbance of TC intensity are the strengthening of TCs themselves and environmental atmospheric dynamical features;meanwhile,the factor for the disturbance of TC secondary circulation is convergence within the boundary layer because all upward transport signals within the secondary circulation are generated by oscillations of the inward radial winds within the boundary layer.

Table 4.Standard deviation and maximum amplitude from the ensemble of simulations of TCs in(a)the open WNP and(b)the SCS.
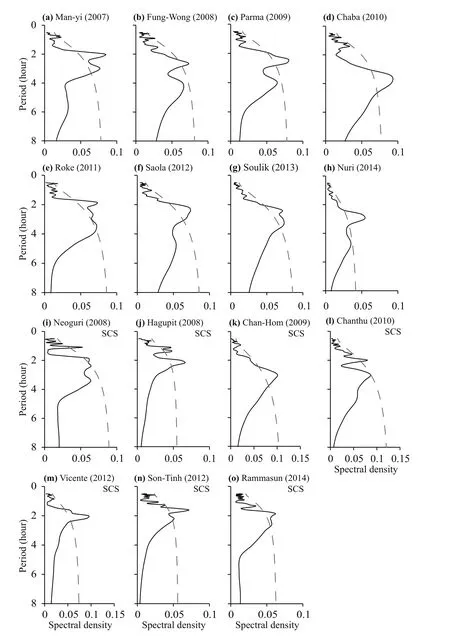
Fig.3.Power spectrum density of the MWS10of TCs from the ensemble of simulations.Black solid and gray dashed lines show the resulting power spectrum density and the noise spectrum,respectively.
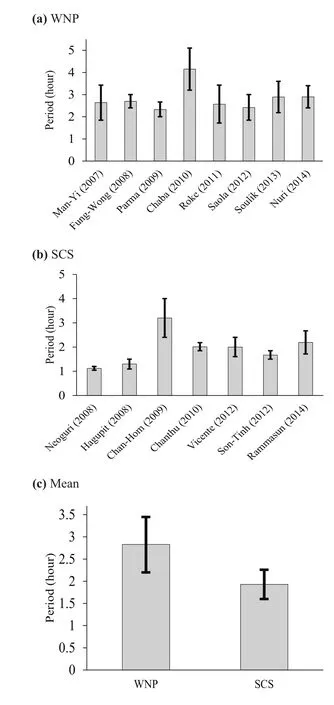
Fig.4.Averaged significant period(gray bars)and variation ranges(black lines)of TCs in(a)the open WNP and(b)the SCS,from the results of the power spectrum analysis shown in Fig.3.(c)Mean of the averaged significant periods and variation ranges of TCs in the open WNP and the SCS.
Strengthening of TCs themselves,however,is not the reason for the longer oscillation periods over the open WNP,because simulated intensities of TCs in the open WNP and SCS are similar.Meanwhile,environmental atmospheric dynamical features including the low-level vorticity,high-level divergence,and vertical wind shear,are analyzed.Table 5 lists the mean values of these variables averaged over an annular area with a radius of 300–600 km from the center,defined as the location of the MSLP,of the simulated TCs during the periods when the TC intensity is higher than severe tropical storm intensity.The design of this ring area is based on estimations of the steering fl ow of TCs made in previous studies(i.e.,Chan and Gray,1982;Peng et al.,2015),where an area with a range larger than 1000 km,within which the region affected by TC features is removed,was used to represent the large-scale features of TCs.The ring area used here covers a range of 1200 km and is thus able to describe the large-scale features around the TC.Furthermore,an area with radius of 300 km is suitable for describing a TC structure,asconcluded from previous studies(i.e.,Emanuel,1986;Wang et al.,2008).This ring area with radius of 300 km to the TC center is generally affected by TC features of the simulated TCs in this study( figures not shown).Although the mean values of all TCs in the open WNP and SCS are different,the differences in the low-level vorticity and high-level divergence are not significant in these two areas.Additionally,differences in vertical wind shears in the open WNP and SCS are not significant.Thus,environmental dynamical factors also do not explain the longer significant periods in the open WNP.

Table 5.Environmental low-level vorticity[unit:m s−1per longitude(latitude)],high-level divergence[unit:m s−1per longitude(latitude)],and vertical wind shear(unit:m s−1)from the ensemble of simulations of TCs in(a)the open WNP and(b)the SCS.
As detailed by Chen et al.(2015),all upward transport signals within the secondary circulation are generated by oscillations of the inward radial winds(convergence)within the boundary layer.Thus,another potential factor of the longer periods in the open WNP is the weaker terrain effects over the open water,because terrain friction intensifies convergence and thus enhances the disturbance when the convergence and rotation are imbalanced,compared with their relationships in mechanisms of TC development and maintenance[i.e.,the thermal wind balance in wind-induced surface heat exchange(Emanuel,1986)].Instead of using the mean divergence within the boundary layer,which is affected by the overall wind speeds,the ratio of radial winds(Rr)is applied to estimate the efficiency of convergence.Rrcan be calculated as


Fig.5.Sketch of the estimation of radial wind(with positive velocities being outward).Here, isthe overallwind speed from which the speed of TC motion has been removed,andis the tangential wind(with positive velocities being anticlockwise).
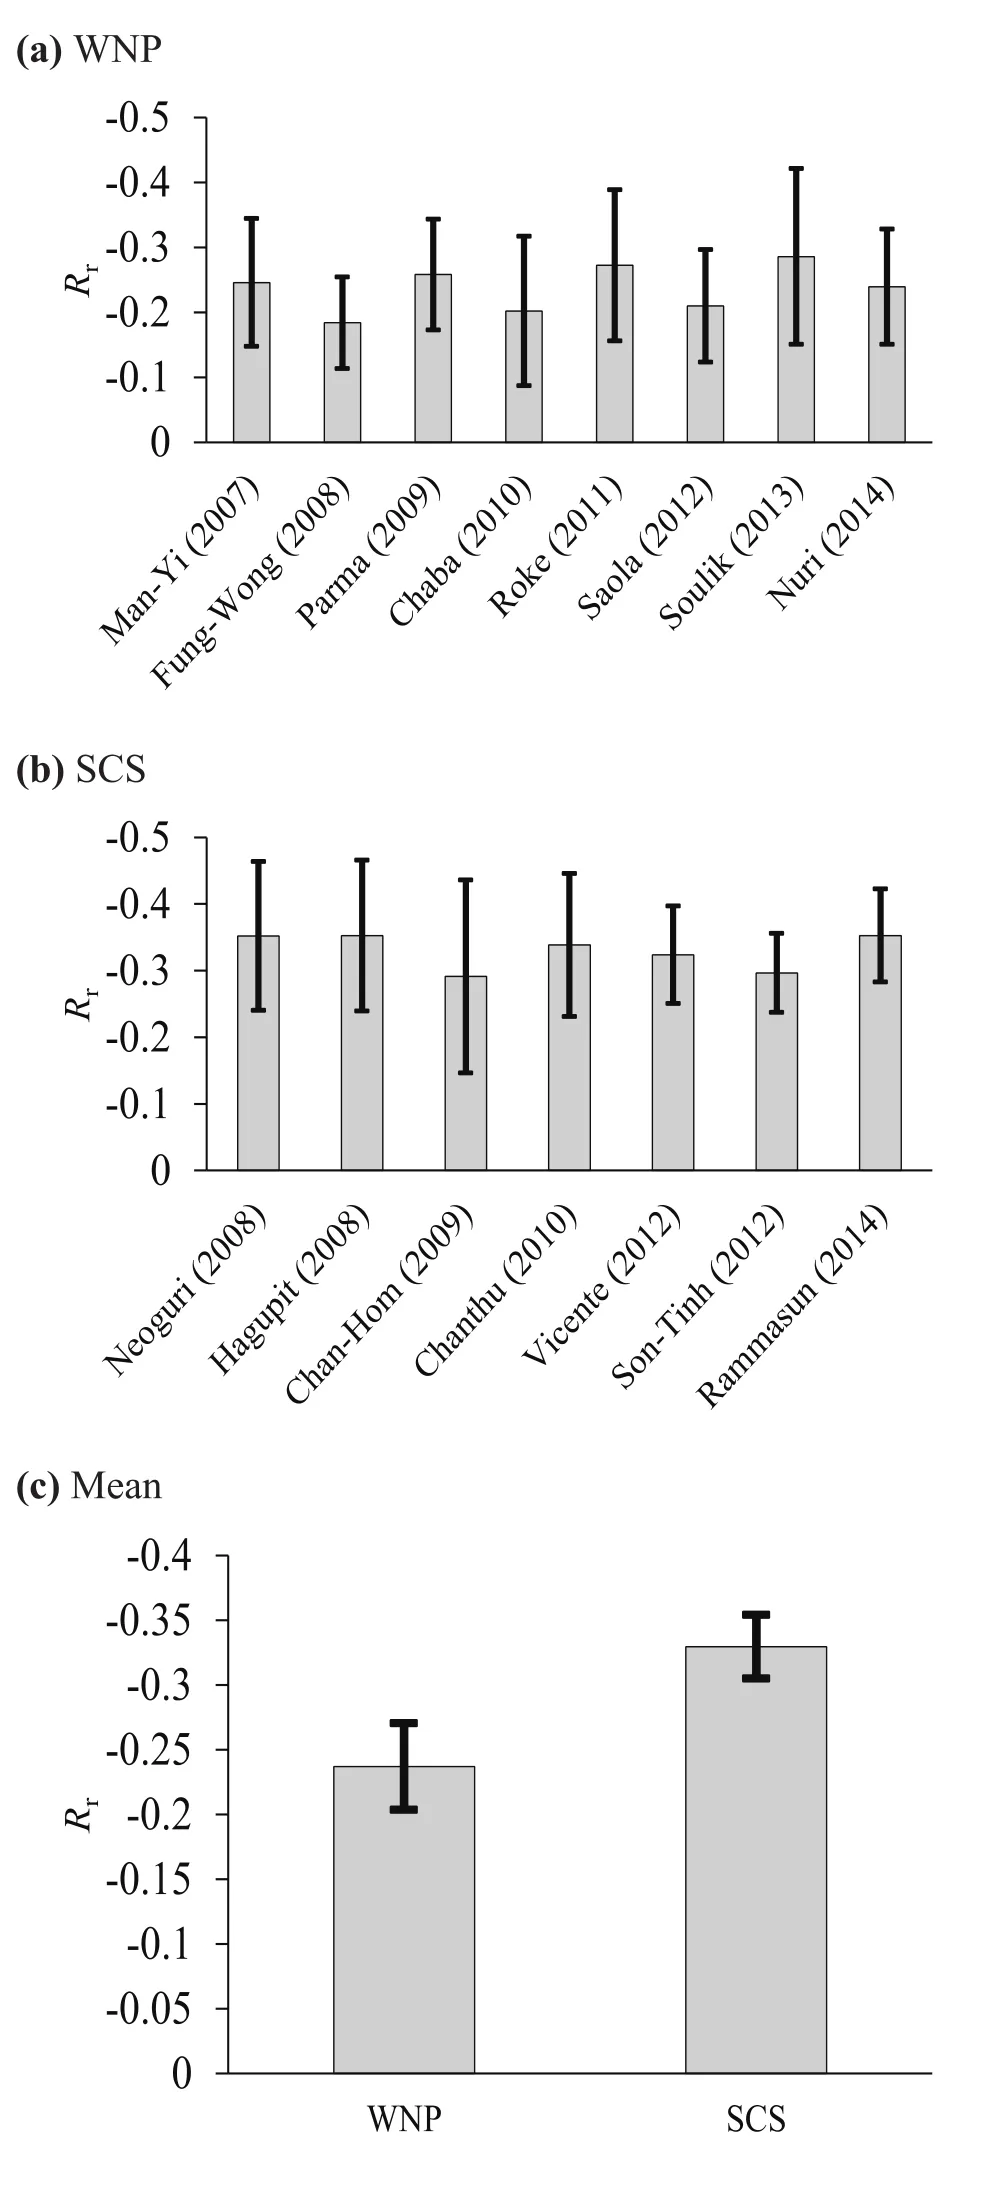
Fig.6.Asin Fig.4but for the ratio of radial winds(Rr)averaged within the PBL of TC eye wall region.
The physical mechanism of the longer variation range in the open WNP is worth discussing,because the longer variation range means the oscillations vary with different spatial scale structure,suggesting that the process may also be affected by a variety of physical factors,such as the air–sea interaction,TC size,and inner structure of the TC.There is thus a need for more detailed investigation.
4.Case study of Typhoon Hagupit(2008)
To verify the effect of terrain on the period of high frequency oscillations,we execute another sensitivity experiment called NoTer for simulation of Hagupit(2008)constructed in Chen et al.(2015)(hereafter referred to as the CTL simulation).The CTL simulation is an excellent example selected from multiple tests with different settings of the domain design,physical scheme,and initial vortex,through the validation with observations.For this application,the WRF model,physical schemes,and initial and boundary conditions are the same as those of the ensemble of simulation as previously described,although the settings of the model domains in CTL are different.The CTL simulation includes three fixed,two-way interactive domains with Mercator projections.The outer(Domain 1),intermediate(Domain 2),and inner(Domain 3)meshes have horizontal resolutions of 27,9 and 3 km,designed to simulate the synoptic-scale environment for the storm to evolve,the mesoscale structure,and the inner-core structure of Hagupit(2008),respectively.More detailed information about the CTL simulation can be found in Chen et al.(2015).In contrast to the CTL simulation,the continents in Domain 2 and 3 are replaced by ocean in NoTer(Fig.7).
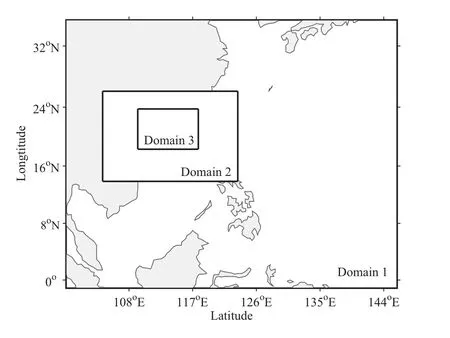
Fig.7.Domains of the WRF model for the high-quality simulation of Typhoon Hagupit(2008),and the area in which land is replaced by ocean(blank in Domains 2 and 3)in NoTer.
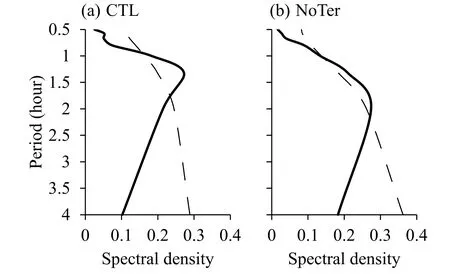
Fig.8.Power spectrum density of the MWS10of TCs in(a)CTL and(b)NoTer,from the high-quality simulation of Typhoon Hagupit(2008).Solid and dashed lines show the resulting power spectrum density and noise spectrum,respectively.
Power spectrum analysis is performed for the MWS10,with a temporal interval of 15 min,of the simulated Hagupit(2008).Figure 8 shows the results of the power spectrum analysis of the MWS10in Domain 3 for the CTL and NoTer simulations.Figure 9 shows the averaged periods and the variation ranges according to the results presented in Fig.8.The averaged significant periods of high-frequency oscillations vary:1.28 h for CTL and 1.60 h for NoTer.Additionally,the variation range of the period in NoTer is longer than that in CTL.This suggests that weaker terrain effects result in a longer oscillation period and variation range.The longer oscillation period is not due to the strengths of TCs themselves because the TC intensity in the NoTer simulation is a little weaker than that in the CTL simulation(Fig.10).
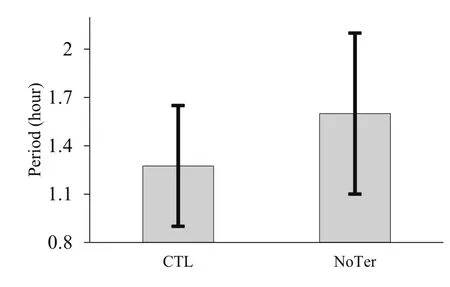
Fig.9.Averaged significant periods(gray bars)and variation ranges(black lines)of TCs in CTL and NoTer,from the results of the power spectrum analysis shown in Fig.8.
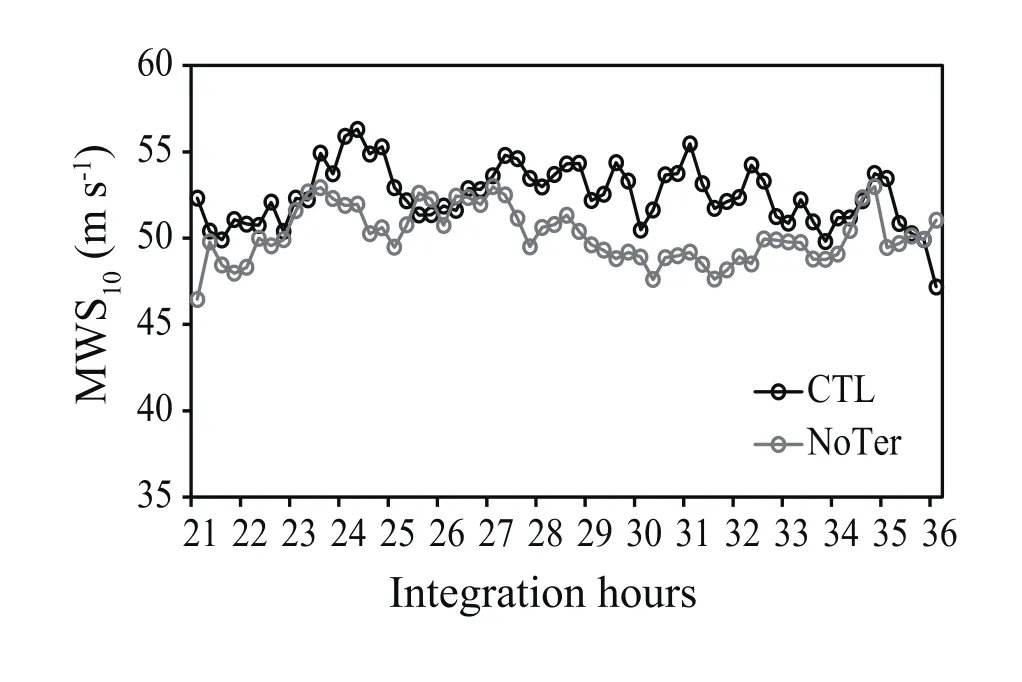
Fig.10.MWS10during 21–36 integration hours of CTL(black line)and NoTer(gray line).

Fig.11.Mean of secondary circulation during the whole simulation period for Domain 3 in(a)CTL and(b)NoTer,and(c)the difference between CTL and NoTer.(d)Mean of Rrin the two experiments averaged over the same period.For(a–c),shading shows the radial winds(positive for outwards;units:m s−1)and contours show the vertical velocity(positive for upwards;units:m s−1).
The secondary circulations of TCs in the two experiments are analyzed(Fig.11).It is found that secondary circulation at a low level in the TC in the NoTer simulation is weaker than that in the CTL simulation,with weaker radial winds in the boundary layer(abnormal outward winds with positive speeds in Fig.11c)and vertical velocities in the low layer.Additionally,Rrwithin the boundary layer of the eyewall region in the NoTer simulation is approximately 10%less than that in the CTL simulation(Fig.11d),while the gradient wind speed and thermal wind speed within the upper level of the boundary layer are only approximately 4%more and 3%less than those in the CTL(Fig.12).The eyewall region in this case study is defined as the ring area with radius of 120 km to the TC center,on the basis of the structure of the updraft shown in Fig.11.The eyewall region of this simulated TC is smaller than that of the ensemble simulations,because the TC is well-developed by initializing with the bogussing scheme.The results regarding the Rr,gradient wind,and thermal wind,show that the lesser terrain in NoTer weakens the convergence within the boundary layer,and then weakens the disturbance of the gradient and thermal wind balances,thus possibly generating a longer significant period of high-frequency oscillations.Note that the factor of the smaller-scale features of the eyewall evolution requires further detailed study because the features of secondary circulation,including the updraft,are similar but different in some details(i.e.,Fig.12)in the two experiments.
5.Conclusions
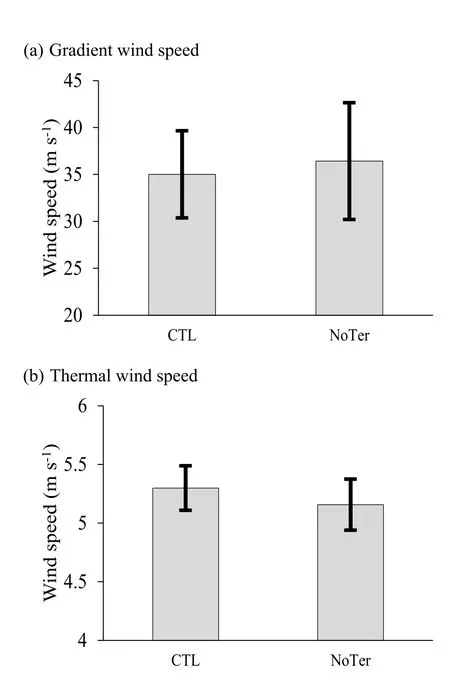
Fig.12.Mean of(a)the gradient wind speed and(b)the thermal wind speed averaged within the upper level of the boundary layer of the TC eyewall region in the two experiments averaged over the same period.
The present study analyzes the variations in high-frequency oscillations in the eyewalls of TCs using an ensemble of 15 simulated TCs over the WNP(including the SCS)and a simulation case study of Typhoon Hagupit (2008).Power spectrum analysis of the MWS10s of TCs shows that high-frequency oscillations are significant in all simulated TCs,with the oscillation periods and the variation range being shorter in the SCS than in the open WNP.The means of the average periods of TCs in the open WNP and SCS are 2.83 and 1.93 h,respectively,and the variation range of the oscillation periods of TCs in the open WNP is approximately twice that of TCs in the SCS.Additionally,the magnitudes of the oscillations are similar in the two areas.
Factors of the variation in the significant oscillation periods in the open WNP and SCS are analyzed.The factors include the strengths of TCs themselves,environmental atmospheric dynamical features,and convergence within the boundary layer.Results show that the longer oscillation periods in the open WNP are not generated by the strengths of TCs themselves.The environmental atmospheric dynamical features that affect the development of TCs are also not the cause of the disturbance of longer significant periods for TCs in the open WNP,because the differences in environmental low-level vorticity,high-level divergence,and vertical wind shear of TCs,are not significant between the open WNP and SCS.Meanwhile,analysis of the convergence efficiency within the boundary layer suggests that the shorter periods in the SCS are possibly due to the stronger terrain effect,which intensifies convergence through greater friction.This is further demonstrated by the case simulation of Typhoon Hagupit(2008)and a sensitivity experiment,in which the continent is replaced by ocean.Results show that the enhanced convergence possibly strengthens the disturbance of the gradient and thermal wind balances,which is favorable for the shorter oscillation periods.
Because the condition of the underlying surface is a factor of the period of the high-frequency oscillations,and all upward signals are generated by the oscillations of radial winds with the boundary layer(detailed by Chen et al.,2015),further study is required to determine the small-scale features within the boundary layer and their interactions with the underlying surface.
Acknowledgements.This work was supported by the National Natural Science Foundation of China(Grant Nos.41405048,41675043,41375050,41205032 and 41775094)and Independent Research Project Program of State Key Laboratory of Tropical Oceanography(Grant No.LTOZZ1603).We are grateful for the use of the Tianhe-2 supercomputer(National Supercomputer Center in Guangzhou,Sun Yat-Sen University)and the HPCC(South China Sea Institute of Oceanology,Chinese Academy of Sciences),which were used in all numerical simulations.The authors would like to thank the three anonymous reviewers for their comments to improve the paper.
Chan,J.C.L.,and W.M.Gray,1982:Tropical cyclone movement and surrounding flow relationships.Mon.Wea.Rev.,110,1354–1374,https://doi.org/10.1175/1520-0493(1982)110<1354:TCMASF>2.0.CO;2.
Charney,J.G.,and A.Eliassen,1964:On the growth of the hurricane depression.J.Atmos.Sci.,21,68–75,https://doi.org/10.1175/1520-0469(1964)021<0068:OTGOTH>2.0.CO;2.
Chen,S.M.,1987:Preliminary analysis on the structure and intensity of concentric double-eye typhoons.Adv.Atmos.Sci.,4,113–118,https://doi.org/10.1007/BF02656667.
Chen,S.M.,W.B.Li,Y.Y.Lu,and Z.P.Wen,2014:Variations of latent heat flux during tropical cyclones over the South China Sea.Meteorological Applications,21,717–723,https://doi.org/10.1002/met.1398.
Chen,S.M.,Y.Y.Lu,W.B.Li,and Z.P.Wen,2015:Identification and analysis of high-frequency oscillations in the eyewalls of tropical cyclones.Adv.Atmos.Sci.,32,624–634,https://doi.org/10.1007/s00376-014-4063-x.
Dudhia,J.,1989:Numerical study of convection observed during the winter monsoon experiment using a mesoscale two-dimensional model. J. Atmos.Sci.,46,3077–3107,https://doi.org/10.1175/1520-0469(1989)046<3077:NSOCOD>2.0.CO;2.
Emanuel,K.A.,1986:An air-sea interaction theory for tropical cyclones.Part I:Steady-state maintenance.J.Atmos.Sci.,43,585–604,https://doi.org/10.1175/1520-0469(1986)043<0585:AASITF>2.0.CO;2.
Emanuel,K.A.,2005:Increasing destructiveness of tropical cyclones over the past 30 years.Nature,436,686–688,https://doi.org/10.1038/nature03906.
Gall,R.,J.Tuttle,and P.Hildebrand,1998:Small-scale spiral bands observed in Hurricanes Andrew,Hugo,and Erin.Mon.Wea.Rev.,126,1749–1766,https://doi.org/10.1175/1520-0493(1998)126<1749:SSSBOI>2.0.CO;2.
Gilman,D.L.,F.J.Fuglister,and J.M.Mitchell Jr.,1963:On the power spectrum of “red noise”.J.Atmos.Sci.,20,182–184,https://doi.org/10.1175/1520-0469(1963)020<0182:OTPSON>2.0.CO;2.
Hendricks,E.A.,M.T.Montgomery,and C.A.Davis,2004:The role of “vortical”hot towers in the formation of tropical cyclone Diana(1984).J.Atmos.Sci.,61,1209–1232,https://doi.org/10.1175/1520-0469(2004)061<1209:TROVHT>2.0.CO;2.
Hong,S.Y.,and J.O.J.Lim,2006:The WRF single-moment 6-class microphysics scheme(WSM6).Journal of Korean Meteorological Society,42,129–151.
Hong,S.Y.,J.Dudhia,and S.H.Chen,2004:A revised approach to ice microphysical processes for the bulk parameterization of clouds and precipitation.Mon.Wea.Rev.,132,103–120,https://doi.org/10.1175/1520-0493(2004)132<0103:ARATIM>2.0.CO;2.
Kain,J.S.,2004:The Kain Fritsch convective parameterization:An update.J.Appl.Meteor.,43,170–181,https://doi.org/10.1175/1520-0450(2004)043<0170:TKCPAU>2.0.CO;2.
Kain,J.S.,and J.M.Fritsch,1990:A one-dimensional entraining/detraining plume model and its application in convective parameterization.J.Atmos.Sci.,47,2784–2802,https://doi.org/10.1175/1520-0469(1990)047<2784:AODEPM>2.0.CO;2.
Kain,J.S.,and J.M.Fritsch,1993:Convective parameterization for mesoscale models:The Kain-Fritsch scheme.The Representation of Cumulus Convection in Numerical Models,Emanuel,K.A.,and D.J.Raymond,Eds.American Meteorological Society,Boston,MA,24,165–170,https://doi.org/10.1007/978-1-935704-13-316.
Ki,M.O.,and H.Y.Chun,2011:Inertia gravity waves associated with deep convection observed during the summers of 2005 and 2007 in Korea.J.Geophys.Res.,116(D16),D16122,https://doi.org/doi:10.1029/2011JD015684.
Kossin,J.P.,2002:Daily hurricane variability inferred from GOES infrared imagery.Mon.Wea.Rev.,130,2260–2270, https://doi.org/10.1175/1520-0493(2002)130<2260:DHVIFG>2.0.CO;2.
Kurihara,Y.,1976:On the development of spiral bands in a tropical cyclone.J.Atmos.Sci.,33,940–958,https://doi.org/10.1175/1520-0469(1976)033<0940:OTDOSB>2.0.CO;2.
Li,Q.Q.,Y.H.Duan,H.Yu,and G.Fu,2010:Finescale spiral rainbands modeled in a high-resolution simulation of Typhoon Rananim(2004).Adv.Atmos.Sci.,27,685–704,https://doi.org/10.1007/s00376-009-9127-y.
Menelaou,K.,and M.K.Yau,2014:On the role of asymmetric convective bursts to the problem of hurricane intensification:Radiation of vortex Rossby waves and wave-mean fl ow interactions.J.Atmos.Sci.,71,2057–2077,https://doi.org/10.1175/JAS-D-13-0343.1.
Mlawer,E.J.,S.J.Taubman,P.D.Brown,M.J.Iacono,and S.A.Clough,1997:Radiative transfer for inhomogeneous atmospheres:RRTM,a validated correlated-k model for the longwave.J.Geophys.Res.,102,16 663–16 682,https://doi.org/10.1029/97JD00237.
Montgomery,M.T.,and R.J.Kallenbach,1997:A theory for vortex Rossby-waves and its application to spiral bands and intensity changes in hurricanes.Quart.J.Roy.Meteor.Soc.,123,435–465,https://doi.org/10.1002/qj.49712353810.
Montgomery,M.T.,M.E.Nicholls,T.A.Cram,A.B.Saunders,2006:A vortical hot tower route to tropical cyclogenesis.J.Atmos.Sci.,63,355–386,https://doi.org/10.1175/JAS3604.1.
Peng,S.Q.,andCoauthors,2014:On the mechanisms of the recur-vature of super typhoon megi.Sci.Rep.,4,4451,https://doi.org/10.1038/srep04451.
Peng,S.Q.,and Coauthors,2015:A real-time regional forecasting system established for the south china sea and its performance in the track forecasts of tropical cyclones during 2011-13.Wea.Forecasting,30,471–485,https://doi.org/10.1175/WAF-D-14-00070.1.
Reasor,P.D.,M.D.Eastin,and J.F.Gamache,2009:Rapidly intensifying Hurricane Guillermo(1997).Part I:Low-wavenumber structure and evolution.Mon.Wea.Rev.,137,603–631,https://doi.org/10.1175/2008MWR2487.1.
Reasor,P.D.,M.T.Montgomery,F.D.Marks Jr,and J.F.Gamache,2000:Low-wavenumber structure and evolution of the hurricane inner core observed by airborne dual-Doppler radar.Mon.Wea.Rev.,128,1653–1680,https://doi.org/10.1175/1520-0493(2000)128<1653:LWSAEO>2.0.CO;2.
Romine,G.S.,and R.B.Wilhelmson,2006:Finescale spiral band features within a numerical simulation of Hurricane Opal(1995).Mon.Wea.Rev.,134,1121–1139,https://doi.org/10.1175/MWR3108.1.
Schecter,D.A.,2008:The spontaneous imbalance of an atmospheric vortex at high Rossby number.J.Atmos.Sci.,65,2498–2521,https://doi.org/10.1175/2007JAS2490.1.
Shapiro,L.J.,and H.E.Willoughby,1982:The response of balanced hurricanes to local sources of heat and momentum.J.Atmos.Sci.,39,378–394,https://doi.org/10.1175/1520-0469(1982)039<0378:TROBHT>2.0.CO;2.
Skamarock,W.C.,and Coauthors,2008:A description of the Advanced Research WRF Version 3,1–113.[Available at http://www2.mmm.ucar.edu/wrf/users/docs/arwv3.pdf].
Stott,L.,C.Poulsen,S.Lund,and R.Thunell,2002:Super ENSO and global climate oscillations at millennial time scales.Science,297,222–226,https://doi.org/10.1126/science.1071627.
Torrence,C.,and G.T.Compo,1998:A practical guide to wavelet analysis.Bull.Amer.Meteor.Soc.,79,61–78,https://doi.org/10.1175/1520-0477(1998)079<0061:APGTWA>2.0.CO;2.
Wang,D.L.,X.D.Liang,Y.Zhao,and B.Wang,2008:A comparison of two tropical cyclone bogussing schemes.Wea.Forecasting,23,194–204,https://doi.org/10.1175/2007 WAF2006094.1.
Willoughby,H.E.,1976:Inertia-buoyancy waves in hurricanes.J.Atmos.Sci.,34,1028–1039,https://doi.org/10.1175/1520-0469(1977)034<1028:IBWIH>2.0.CO;2.
Willoughby,H.E.,J.A.Clos,and M.G.Shoreibah,1982:Concentric eye walls,secondary wind maxima,and the evolution of the hurricane vortex.J.Atmos.Sci.,39,395–411,https://doi.org/10.1175/1520-0469(1982)039<0395:CEWSWM>2.0.CO;2.
Ying,M.,W.Zhang,H.Yu,X.Q.Lu,J.X.Feng,Y.X.Fan,Y.T.Zhu,and D.Q.Chen,2014:An overview of the China Meteorological Administration tropical cyclone database.J.Atmos.Oceanic Technol.,31,287–301,https://doi.org/10.1175/JTECH-D-12-00119.1.
Zhong,W.,D.L.Zhang,and H.C.Lu,2009:A theory for mixed vortex Rossby-gravity waves in tropical cyclones.J.Atmos.Sci.,66,3366–3381,https://doi.org/10.1175/2009JAS3060.1.
杂志排行
Advances in Atmospheric Sciences的其它文章
- Validation and Spatiotemporal Distribution of GEOS-5–Based Planetary Boundary Layer Height and Relative Humidity in China
- Effects of Sea-Surface Waves and Ocean Spray on Air–Sea Momentum Fluxes
- Evaluation of TIGGE Ensemble Forecasts of Precipitation in Distinct Climate Regions in Iran
- Evaluating the Capabilities of Soil Enthalpy,Soil Moisture and Soil Temperature in Predicting Seasonal Precipitation
- Large-scale Circulation Control of the Occurrence of Low-level Turbulence at Hong Kong International Airport
- Idealized Experiments for Optimizing Model Parameters Using a 4D-Variational Method in an Intermediate Coupled Model of ENSO
