Wilms' tumor gene (WT1) is strongly expressed in high-risk subsets of pediatric acute lymphoblastic leukemia
2018-02-18FatihUckunSanjiveQazi
Fatih M. Uckun, Sanjive Qazi,3
1Biomarker Research Program, AresMIT Biomedical Computational Strategies (ABCS), Minneapolis, Minnesota 55110, USA.
2Biotherapy Program, Ares Pharmaceuticals, LLC, St. Paul, Minnesota 55110, USA.
3Bioinformatics Program, Gustavus Adolphus College, St. Peter, Minnesota 56082, USA.
Abstract Aim: The purpose of the present study was to perform a comprehensive analysis of WT1 gene expression in high-risk pediatric acute lymphoblastic leukemia (ALL).Methods: We performed a meta-analysis of WT1 gene expression for normal hematopoietic cells vs. primary leukemia cells from 801 pediatric ALL samples deposited in the Oncomine database combined with an in-depth gene expression analysis using our in-house database of gene expression profiles of primary leukemia cells from 1416 pediatric ALL cases.We also examined the expression of WT1 in primary leukemic cells from 299 T-lineage ALL patients in the Oncomine database and 189 T-lineage ALL patients in the archived datasets GSE13159, GSE13351, and GSE13159.Results: Our data provide unprecedented evidence that primary leukemia cells from patients with MLL gene rearrangements (MLL-R) express highest levels of WT1 expression within the high-risk subsets of pediatric B-lineage ALL. Notably, MLL-R+ patients exhibited > 6-fold higher expression levels of the WT1 gene compared to the other B-lineage ALL subtypes combined (P < 0.0001). Our findings in 97 MLL-R+ infant B-lineage ALL cases uniquely demonstrated that WT1 is expressed at 1.5-4.2-fold higher levels in MLL-R+ infant leukemia cells than in normal hematopoietic cells and revealed that WT1 expression level was substantially higher in steroid-resistant infant leukemia cells when compared to non-leukemic healthy bone marrow cells. Furthermore, our study demonstrates for the first time that the WT1-regulated EWSR1, TP53, U2AF2, and WTAP genes (i.e., WT1 interactome) were differentially upregulated in MLL-R+ leukemia cells illustrating that the MLL-regulatory pathway is aberrantly upregulated in MLL-R+ pediatric B-lineage ALL. These novel insights provide a compelling rationale for targeting WT1 in second line treatment of MLL-R+pediatric B-lineage ALL, including MLL-R+ infant ALL. Furthermore, our study is the first to demonstrate that leukemia cells from 370 Ph-like patients had significantly higher WT1 expression when compared to normal hematopoietic cells.Finally, our findings demonstrate for the first time that chemotherapy-resistant primarily leukemic cells from relapsed B-lineage ALL patients exhibit higher expression levels of WT1 than primary leukemia cells from newly diagnosed B-lineage ALL patients (P = 0.001).Conclusion: Our findings indicate that the WT1 gene product may serve as a target for immunotherapy in high risk/poor prognosis subsets of newly diagnosed as well as relapsed pediatric B-lineage ALL. Our findings also significantly expand the current knowledge of WT1 expression in T-lineage ALL and provide new evidence that WT1 gene and its interactome are expressed in T-lineage ALL cells at significantly higher levels than in normal hematopoietic cells. This previously unknown differential expression profile uniquely indicates that the protein product of WT1 would be an attractive molecular target for treatment of T-lineage ALL as well.
Keywords: Wilms' tumor gene, WT1 gene, leukemia, chemotherapy resistance, immunotherapy
INTRODUCTION
The Wilms' tumor gene (WT1) is a tumor-suppressor gene associated with Wilms' tumor, a pediatric kidney cancer[1-3]. The protein product of the WT1 gene is a zinc- finger transcription factor and a tumorassociated antigen. WT1 protein is abundantly expressed in numerous hematological malignancies, including acute myeloid leukemia (AML)[4-18]. While WT1 is an intracellular protein, WT1-derived peptides are expressed on the surface of cancer cells in the context of human leukocyte antigen (HLA) Class I antigens.As such they can be targeted by bispecific T-cell engagers, chimeric antigen receptor (CAR)-T cells and WT1-specific CTL that expand after WT1 peptide vaccine treatments[19-26]. Several WT1-specific targeted cancer immunotherapy modalities, including therapeutic vaccines, WT1-specific CTL or CAR-T cell platforms, are currently being evaluated in clinical trials for multiple therapeutic indications[19-26]. Recently, a T-cell receptor (TCR) that specifically reacts with the WT1 peptide in the context of HLA-A⋆24:02 has been identified[27]. This WT1-specific TCR-gene was transduced to autologous T-cells using a retroviral vector encoding small interfering RNAs for endogenous TCR genes to generate WT1-specific TCR-T cells capable of executing an immune reaction to WT1-expressing AML cells. The early results of the first-in-human Phase 1 clinical trial (www.umin.ac.jp as #UMIN000011519) of this WT1 TCR transduced T-cell therapy (also known as WT1 antigen-specific RetroNectin TCR gene therapy - Takara Bio) in therapy-refractory AML patients have been reported[24]. Shah et al.[19]reported the safety and feasibility of a WT1 peptide-loaded donor-derived dendritic cell (DC) vaccine given with donor lymphocyte infusions designed to enhance and direct the graft-versus-leukemia effect. Preliminary results indicate the DC-based vaccination is safe and feasible after allogeneic hematopoietic stem cell transplantation (HSCT), and suggest that this strategy could potentially be used to sensitize the repopulated allogeneic-donor immune system to WT1+ leukemia cells. Currently, there are several active clinical studies evaluating the safety and clinical potential of different WT1 targeting treatment platforms in pediatric (4 studies registered at clinicaltrials.gov: NCT0289541,NCT0277082, NCT0220390, NCT0316405) or adult (11 studies registered at clinicaltrial.gov: NCT02405338,NCT02550535, NCT02895412, NCT03083054, NCT01734304, NCT02770820, NCT02750995, NCT02203903,NCT03164057, NCT0313998, NCT02498665) AML patients.
In contrast to AML, there is a paucity of knowledge regarding the expression of WT1 antigen in acute lymphoblastic leukemia (ALL). Only a few studies with relatively small patient numbers have evaluated WT1 expression in ALL[8-10,12]and there is no active interventional clinical trial evaluating the clinical potential of a WT1-targeting therapeutic platform in ALL patients. The purpose of the present study was to perform a comprehensive analysis of WT1 gene expression in high-risk pediatric ALL. Our results provide new evidence that WT1 is expressed at very high levels in pediatric ALL subsets commonly associated with chemotherapy resistance, including B-lineage ALL with MLL gene rearrangements, Ph-like ALL, and T-lineage ALL.
METHODS
Gene expression analyses
We utilized an online data mining tool, OncomineTM research edition, harboring 715 datasets with 86,733 samples for cancer patients and cell lines to assess expression of WT1 across major cancer subtypes (https://www.oncomine.org/resource/main.html). We focused our analysis on mRNA expression comparing normal vs. ALL samples (log2median centered expression values for each data set) and filtered expression signals that were greater than 1.5-fold difference and P-value from two sample t-tests less than 0.001. In addition, we compiled 6 archived gene expression profiling datasets that measured expression from B-lineage ALL patients hybridized to Human Genome U133 Plus 2.0 Array, including GSE11877, n = 207; GSE13159,n = 823; GSE13351, n = 107; GSE18497, n = 82; GSE28460, n = 98; GSE7440, n = 99 (Total n = 1416), as described[28-31].
To enable comparison of samples across studies, a normalization procedure was performed that merged the raw data from the 6 datasets (CEL files). Perfect Match (PM) signal values for probesets were extracted utilizing raw CEL files matched with probe identifiers obtained from the Affymetrix provided CDF file(HG-U133_Plus _ 2.cdf) implemented by Aroma Affymetrix statistical packages[32]ran in R-studio environment (Version 0.97.551, R-studio Inc., running with R 3.01). The PM signals were quantified using Robust Multiarray Analysis in a 3-step process including robust multi-array analysis (RMA) background correction,quantile normalization, and summarization by Median Polish of probes in a probeset across 1,416 samples(RMA method adapted in Aroma Affymetrix). RMA background correction estimates the background by a mixture model whereby the background signals are assumed to be normally distributed and the true signals are exponentially distributed. Normalization across all 6 studies and 1,416 samples was achieved using a twopass procedure. First the empirical target distribution was estimated by averaging the (ordered) signals over all arrays, followed by normalization of each array toward this target distribution. Expression for specific probe sets was compared for a subset of newly diagnosed B-lineage ALL [GSE1187 (n = 207), GSE13159 (n = 575),GSE13351 (n = 92)], newly diagnosed T-cell ALL [GSE13159 (n = 174), GSE13351 (n = 15)] and normal control cells [GSE13159 (n = 74); 73 control samples contained normal nonleukemic bone marrow cells, and one sample was a non-leukemic peripheral blood sample].
A more targeted comparison was also performed comparing fusion-transcript positive high-risk ALL subsets {MLL-R+[GSE11877 (n = 21), GSE13159 (n = 70), GSE13351 (n = 4)], E2A-PBX1+[GSE11877 (n = 23),GSE13159 (n = 36), GSE13351 (n = 2)], BCR-ABL/Ph+[GSE13159 (n = 122), GSE13351 (n = 1)] and normal cells [GSE13159 (n = 74)]}. The in-house database was further updated utilizing the RMA normalization procedure that included the 6 datasets plus the addition of 2 datasets that examined infant ALL cases[GSE32962, n = 43; GSE68720, n = 97 (total in the updated database n = 1556 samples)] for comparison of infant ALL cases with other high-risk ALL subsets.
Ph-like B-lineage ALL cases were previously identified using a set of 110 gene probeset gene expression signature developed utilizing the Affymetrix U133 plus 2.0 microarray platform[33,34]. In our study, expression values for each of the 110 probesets were averaged across 123 BCR-ABL+cases from the normalized database of 1416 patients to provide an expression template for subsequent correlation analysis. Three studies (GSE11877,GSE13159, GSE13351) referenced normal samples (n = 74), T-lineage ALL (n = 189), BCR-ABL+ALL (n = 123),E2A-PBX1+ALL (n = 61), MLL-R+ALL (n = 95) and other (n = 595) subtypes of primary samples. Gene expression of each sample was correlated against the 110 probeset expression template resulting in a distribution of correlation coefficient values (r) for each subtype of primary samples. Ph-like ALL samples were defined from a cut off “r” value such that the sample from the “r” value was greater than the 99% per+centile of the “r” values in normal samples and greater than the minimum “r” value for the known BCR-ABL samples.The “Other” group was further partitioned into “Ph-like” and “Other” groups based on the “r” value cut off.This procedure identified 370 Ph-like samples used in subset comparisons.
We also examined the archived gene expression profiling data on primary leukemia cells from studies examining matched-pair B-lineage ALL samples taken at diagnosis and at relapse [GSE18497 (27 pairs) and GSE28460 (49 pairs)]. A mixed ANOVA model (probeset level and sample level) was utilized to determine significant differences in expression between the matched diagnostic and relapse samples. A two-way agglomerative hierarchical clustering technique was used to organize expression patterns using the average distance linkage method such that probesets having similar matched pair differences across patients and samples having similar matched pair differences levels were grouped together. Archived gene expression datasets from the Microarray Innovations in Leukemia (MILE) Study, that were generated utilizing the Affymetrix Human Genome U133 Plus 2.0 Array and deposited in GEO (GSEA13159), were also used. The samples consisted of 2,096 blood or bone marrow samples of acute and chronic leukemia patients. Preprocessed data reported as DQN3 values were directly downloaded for analysis. The expression measure included a summarization and quantile normalization step to generate probe set level signal intensities for each microarray experiment (DQN3 values calculated using a published algorithm[35]. One way ANOVA was performed for 18 subclasses of ALL and AML[36]and significant differences were assessed using Dunnett's post hoc tests of each class of leukemic vs. normal samples (R packages multcomp 1.4-6 and Stats 3.3.1).
Statistical comparisons
Statistical significance was assessed for pairwise comparisons of leukemic samples with non-leukemic control samples using analysis of variance methods. Expression profiles of WT1, STAT3, CD19, CD7 and the WT1 interactome from the HPRD interaction set were defined in the Oncomine database [EWSR1, PAWR,SRC, TP53, U2AF2, UBE21, WTAP (https://www.oncomine.org/resource/ui/component/conceptInformation.html?component=gs:130465)] were utilized to determine differences in expression and error distributions for calculation of P-values. STAT3, CD19 and CD7 were included as control genes. The inclusion of the WT1 interactome in the analysis results in a more robust determination of model errors for P-value calculations being members of the same pathway. We constructed a 3 factor Mixed Model Analysis of Variance analysis to compare the expression of the WT1 interactome and control genes in high-risk cancer patients extracted from the RMA normalized database. Two fixed factors were considered in this model: One factor was the expression of probesets (34 human Affymetrix and 17 Illumina probesets representing the 8 WT1 HPRD interaction set), the second factor was comparison of patient sub-groups (Cancer subgroup vs.Normal samples) and one interaction term for probeset x patient sub-group. We included a random factor for each sample to correct for multiple measurements taken from each patient and accounting for variation between patients partitioned as a separate variance component. Least squares method was used fit the parameters for these Mixed ANOVA models (R packages lme4 v1.1-12 and lmertest v2.1-32). The Root Mean Square Error term calculated from the deviation of data points from the model was utilized to determine significant changes in probeset expression in the planned linear contrasts. These contrasts compared the effect sizes (expressed as difference in log2transformed RMA normalized values converted to fold change relative to normal samples) such that the combination of linear parameters to be jointly tested sum to zero for each level of the contrast. Least square mean values were used to construct contrasts between patient sub-groups (set to -1) with the comparison group (set to 1) for the overall increase in the probesets representing the WT1 interactome by taking the effect sizes and standard error of mean calculated for the “patient-subgroup” factor, and for each individual probeset from the effect sizes and standard error of mean calculated using the interaction terms. Two-tailed tests for differences between the Least Square Means with P-values less than 0.05 were deemed statistically significant after controlling for False Discovery Rate.
RESULTS
Expression of WT1 in ALL
Oncomine database survey of WT1 mRNA expression in ALL vs. non-leukemic healthy bone marrow samples showed 1.5- to 9.0-fold higher expression in T-lineage ALL patients (n = 299) and 2.4-fold to 4.9-fold higher expression in B-lineage ALL patients (n = 502) with highly significant P-values for all studies deposited inthe Oncomine database [Table 1].

Table 1. Oncomine survey of WT1 mRNA expression in leukemic bone marrow samples vs. non-leukemic bone marrow specimens from healthy individuals
Amplified Expression of WT1 in T-lineage ALL
We used the archived datasets GSE 13351 and GSE13159 to examine the expression of WT1 in primary leukemic cells from 189 T-lineage ALL patients vs. normal hematopoietic cells in 74 control samples. In T-lineage ALL cells, the gene for the pan-T lineage marker antigen CD7 that served as a positive control exhibited significantly higher expression levels (Figure 1A and B; Expression > 4-fold change for both CD7 probesets, P < 1 × 10-16), whereas the negative control gene CD19, a pan-B lineage marker, was expressed at exhibited significantly lower expression levels than in normal hematopoietic cells (Figure 1; Fold change for CD19 expression relative to normal = 0.4, P < 1 × 10-16). Notably, one of the 2 WT1 probesets, 206067_s_at detected a 2.7-fold increased expression level in T-lineage ALL cells with a highly significant linear contrast P-value of < 1 × 10-16. A significantly increased > 1.2-fold higher expression level was also detected with the WT1 probeset WT1_216953_s_at [Figure 1B]. We next used a 3-factor mixed model analysis of variance(ANOVA) to compare the expression of the WT1-directed interactome from the Oncomine HPRD interaction set defined by 36 probesets using the RMA-normalized combined database. As shown in Figure 1, the WT1-regulated genes EWSR1 (4 of 4 probesets), TP53 (2 of 2 probesets), PAWR (3 of 6 probesets) showed upregulated expression in T-lineage ALL cells (Linear Contrast, P < 0.01 for all comparisons). Further, 1 of the 4 probesets for the WT1-regulated U2AF2 gene and 1 of the 6 probesets of the WT1-regulated WTAP gene also showed significantly amplified expression in T-lineage ALL cells. Taken together, these results provide new evidence that WT1 gene and its interactome are expressed in T-lineage ALL cells at higher levels than in normal hematopoietic cells.
Expression of WT1 in distinct molecular subsets of B-lineage ALL
We next interrogated the GSEA13159 database of gene expression data that were generated utilizing the Affymetrix Human Genome U133 Plus 2.0 Array from the MILE Study for WT1 mRNA expression in distinct molecular subsets of B-lineage ALL patients (i.e., t(9;22)/Ph+, Hyperdiploid, t(1;19)+, 11q23/MLLR+, t(8;14)+, t(12;21)+; n = 339). The MILE study compared gene expression profiles for subsets of leukemia defined by gold standard laboratory techniques, and controlled for statistical batch effects from hybridizations measured at different clinics utilizing pre-processing methods including DQN3 normalization of the detected signals. Leukemic cells from B-lineage ALL patients with MLL-R+, corresponding the most immature immunophenotype (Pro-B) frequently associated with chemotherapy resistance, exhibited the highest expression levels for WT1 (~8.8-fold higher levels than in normal hematopoietic cells, P < 0.00001) [Figure 2].By contrast, leukemia cells from Burkitt's/B-cell leukemia patients with t(8;14) corresponding to the most mature immunophenotype had the lowest WT1 expression levels that were not significantly different from the WT1 expression levels of normal hematopoietic cells. Leukemic cells from all other molecular subsets had WT1 expression levels that were higher than those of normal hematopoietic cells [Figure 2].
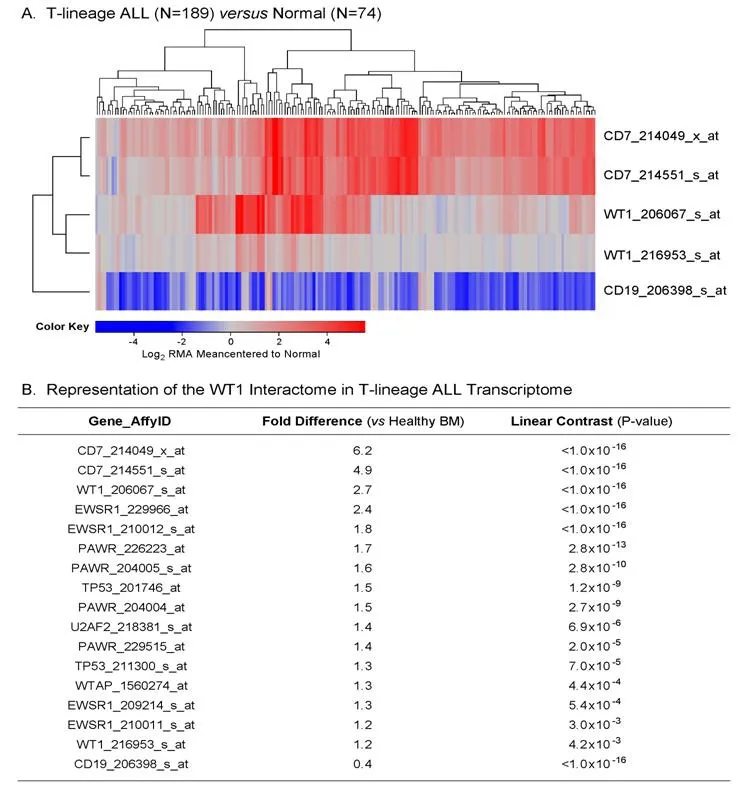
Figure 1. Augmented expression of WT1 in Pediatric T-lineage acute lymphoblastic leukemia (ALL). Expression of log2 transformed,robust multi-array analysis (RMA) normalized values for primary leukemia cells from 189 newly diagnosed pediatric T-lineage ALL patients were mean centered to the mean expression of 74 normal samples and clustered using a two-way algorithm (average distance metric) to determine co-regulation of WT1 and the control genes. A: The heat map ranging from blue to red represents expression lower than normal to greater than normal in T-lineage ALL samples respectively for the transformed expression values. CD7 and WT1 were upregulated and CD19 was downregulated in T cell ALL samples; B: expression levels were also examined for the WT1 interactome identified from the HPRD database. A 3 factor Mixed Model Analysis of Variance analysis was utilized to compare the expression of the WT1 interactome plus the control genes in T lineage ALL patients with normal samples extracted from the in-house RMA normalized database (36 probesets analyzed to determine least square error of the expression measurements used to calculate P-values) and the most significantly affected expression levels are shown. Fold change and linear contrast P-values are depicted for the WT1, WT1 interactome, CD19 and CD7 probesets
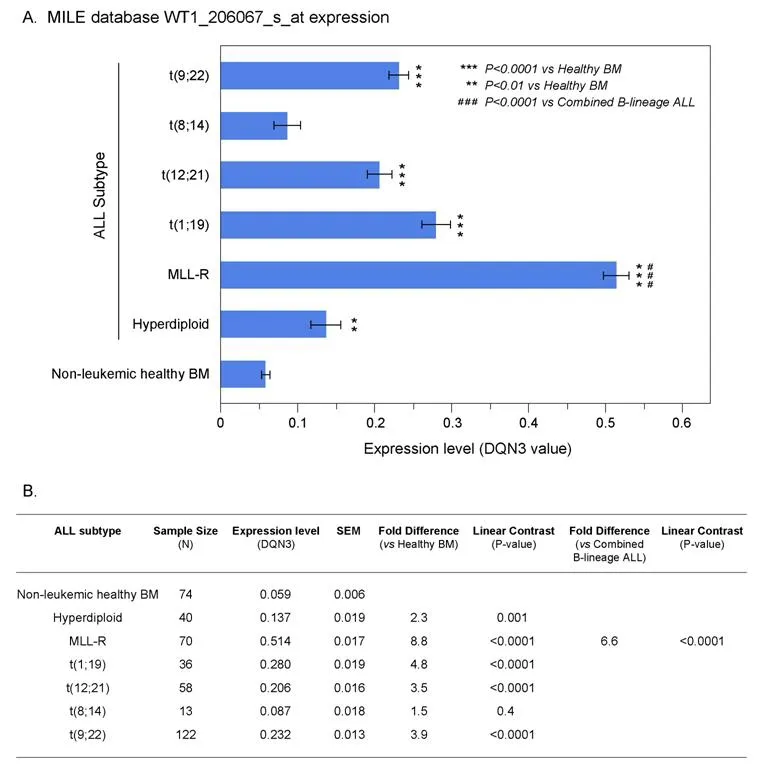
Figure 2. Augmented expression of WT1 in cytogenetically distinct B-lineage acute lymphoblastic leukemia (ALL) subsets. Increased levels of WT1 expression in ALL subsets compared to normal samples from the Microarray Innovations in Leukemia (MILE) Study.Gene expression profiling data from the MILE Study were interrogated for differences in WT1 expression levels. A: DQN3-normalized expression levels for the WT1 probeset, 206067_s_at in ALL subsets are depicted using mean and standard error values presented in the bar chart (± SEM). Primary leukemia cells from MLL-R+ B-lineage ALL patients exhibited the highest expression levels for WT1.Sample sizes for t(9;22), t(8;14), t(12;21), t(1;19), MLL-R, Hyperdiploid, Non-leukemic healthy BM were 122, 13, 58, 36, 70, 40 and 74 respectively; B: one way ANOVA was performed across 7 subgroups of B-lineage ALL cases in the MILE study and statistical significance was assessed utilizing linear contrasts of each subgroup vs. nonleukemic control samples, and for MLL-R subgroup vs. the other B-lineage ALL subgroups combined. Depicted are the mean values fold differences in expression and the corresponding P-values
We then used our in-house database containing the combined dataset compiled from the archived datasets GSE11877, GSE13159, GSE13351 to examine the expression of WT1 in primary leukemic cells from 95 newly diagnosed pediatric B-lineage ALL patients vs. normal hematopoietic cells in 74 control samples (73 nonleukemic bone marrow samples and one non-leukemic blood sample). In this compiled dataset, MLL-R+patients exhibited the highest level of expression of WT1, 206067_s_at probeset compared to the other B-lineage ALL subtypes (Figure 3; ~6.1-fold increase vs. combined B-lineage ALL, P < 0.0001).

Figure 4. Augmented expression of WT1 in MLL-R+ pediatric B-lineage acute lymphoblastic leukemia (ALL). Expression of log2-transformed, robust multi-array analysis (RMA) normalized values for leukemia samples from 95 MLL-R+ patients were mean centered to the mean expression of 74 normal control samples and clustered using a two-way algorithm (average distance metric) to determine co-regulation of WT1 and the control genes. A: The heat map ranging from blue to red represents expression lower than normal to greater than normal in ALL samples respectively for the transformed expression values. CD19 and WT1 were upregulated and CD7 was downregulated in these B-lineage ALL samples; B: expression levels were also examined for the members of the WT1 interactome identified from the HPRD database. A 3 factor Mixed Model Analysis of Variance analysis was utilized to compare the expression of the WT1 interactome plus the control genes in leukemia samples from ALL patients vs. normal samples extracted from the in-house RMA normalized database (36 probesets analyzed to determine least square error of the expression measurements used to calculate P-values).Fold change and linear contrast P-values are reported for the WT1, CD19 and CD7 probesets
In leukemic B-cell precursors from MLL-R+B-lineage ALL patients, the gene for the pan-B lineage marker antigen CD19 that served as a positive control was expressed at > 16-fold higher expression levels, whereas the negative control gene CD7, a pan-T lineage marker, was expressed at significantly lower levels than in normal hematopoietic cells [Figure 4]. Notably, both of the WT1 probesets exhibited increased expression in MLL-R+leukemic cells (8.7-fold for 20607_s_at (P < 1 × 10-16) and 1.7-fold for 216953_s_at (P = 5.3 × 10⁻¹⁵)with highly significant linear contrast P-values. We also used a 3-factor mixed model ANOVA to compare the expression of the WT1-directed interactome from the Oncomine HPRD interaction set in leukemic BCP vs. normal hematopoietic cells and found that the WT1-regulated EWSR1, TP53, U2AF2, and WTAP genes were also upregulated in MLL-R+leukemic cells [Figure 4B].

Figure 5. Augmented expression of WT1 in MLL-R+ infant B-lineage acute lymphoblastic leukemia (ALL). A: Expression of log2 transformed, robust multi-array analysis (RMA) normalized values for 97 MLL-R+ infants with B-lineage ALL (GSE68720) were mean centered to the mean expression of 74 normal control samples and clustered using a two-way algorithm (average distance metric)to determine co-regulation of WT1 and the control genes; B: a 3 factor Mixed Model Analysis of Variance analysis was utilized to compare the expression of the WT1 plus the control genes in infant ALL patients with normal samples extracted from the in-house RMA normalized database of 1,556 patients of which nonleukemic control samples and leukemic samples from MLL-R+ infant ALL cases were interrogated (5 probesets analyzed to determine least square error of the expression measurements used to calculate P-values). Fold change and linear contrast P-values are reported for the WT1, CD19 and CD7 probesets
We extended our analysis to 97 MLL-R+infant B-lineage ALL cases by using the dataset GSE68720. WT1 was expressed at 1.5-4.2-fold higher levels (Figure 5; P < 0.001) in MLL-R+infant leukemia cells than in normal hematopoietic cells and the WT1 expression level was independent of the steroid resistance of leukemia cells (Figure 6; Fold difference > 6 compared to non-leukemic healthy bone marrow cells).
Amplified expression of WT1 in pediatric Ph+ and Ph-like B-lineage ALL
Examination of WT1 expression in patients diagnosed with Philadelphia translocation in chromosome 22 of BPL leukemia cancer cells (Ph+) revealed increased expression of CD19 (Table 2; Fold difference vs.control samples = 20.1, P < 1 × 10-16) and WT1 206067_s_at probeset (Fold difference = 1.8, P < 1 × 10-16;WT1_216953_s_at displayed borderline significance with 1.1 fold increase, P = 0.08). WT1-directed interactome from the Oncomine HPRD interaction set also exhibited increased expression of EWSR1 (2 probesets),PAWR (4 probesets), WTAP and TP53 (2 probesets).

Figure 6. Increased levels of WT1_206067_s_at probeset expression in MLL-R+ infant B-lineage acute lymphoblastic leukemia (ALL) vs.normal samples for both steroid sensitive and resistant subsets of Infant B-linage ALL patients. A: Expression of WT1 probeset, 206067_s_at that were log2 transformed and RMA-normalized were compared for 24 MLL-R+ infants with B-lineage ALL that were steroidresistant, 19, 24 MLL-R+ infants with B-lineage ALL that were steroid- sensitive (GSE32962) vs. 74 normal control samples (mean and standard errors depicted in the bar chart); B: a 3 factor Mixed Model Analysis of Variance analysis was utilized to compare the expression of the WT1_206067_s_at
In addition to identifying and increase in WT1 expression in BCR-ABL/Ph+patients, we also evaluated WT1 expression in Ph+-like cases that were previously identified using a 110 probeset expression signature developed with the Affymetrix U133 plus 2.0 microarray platform. In our study, expression values for each of the 110 probesets were averaged across 123 BCR-ABL+cases from the normalized database of 1,416 patientsto provide an expression template for subsequent correlation analysis to identify Ph+-like patients (n = 370).This patient subset also exhibited increased expression of CD19 (Fold difference = 15.6, P < 1 × 10-16) and WT1 (206067_s_at probeset, Fold difference = 2.2, P < 1 × 10-16(WT1_216953_s_at probeset showed a 1.2 fold increase, P = 0.011) as well as the WT1-directed interactome [Table 3; WTAP (2 probesets), EWSR1 (2 probesets), TP53 (2 probesets) and U2AF2].
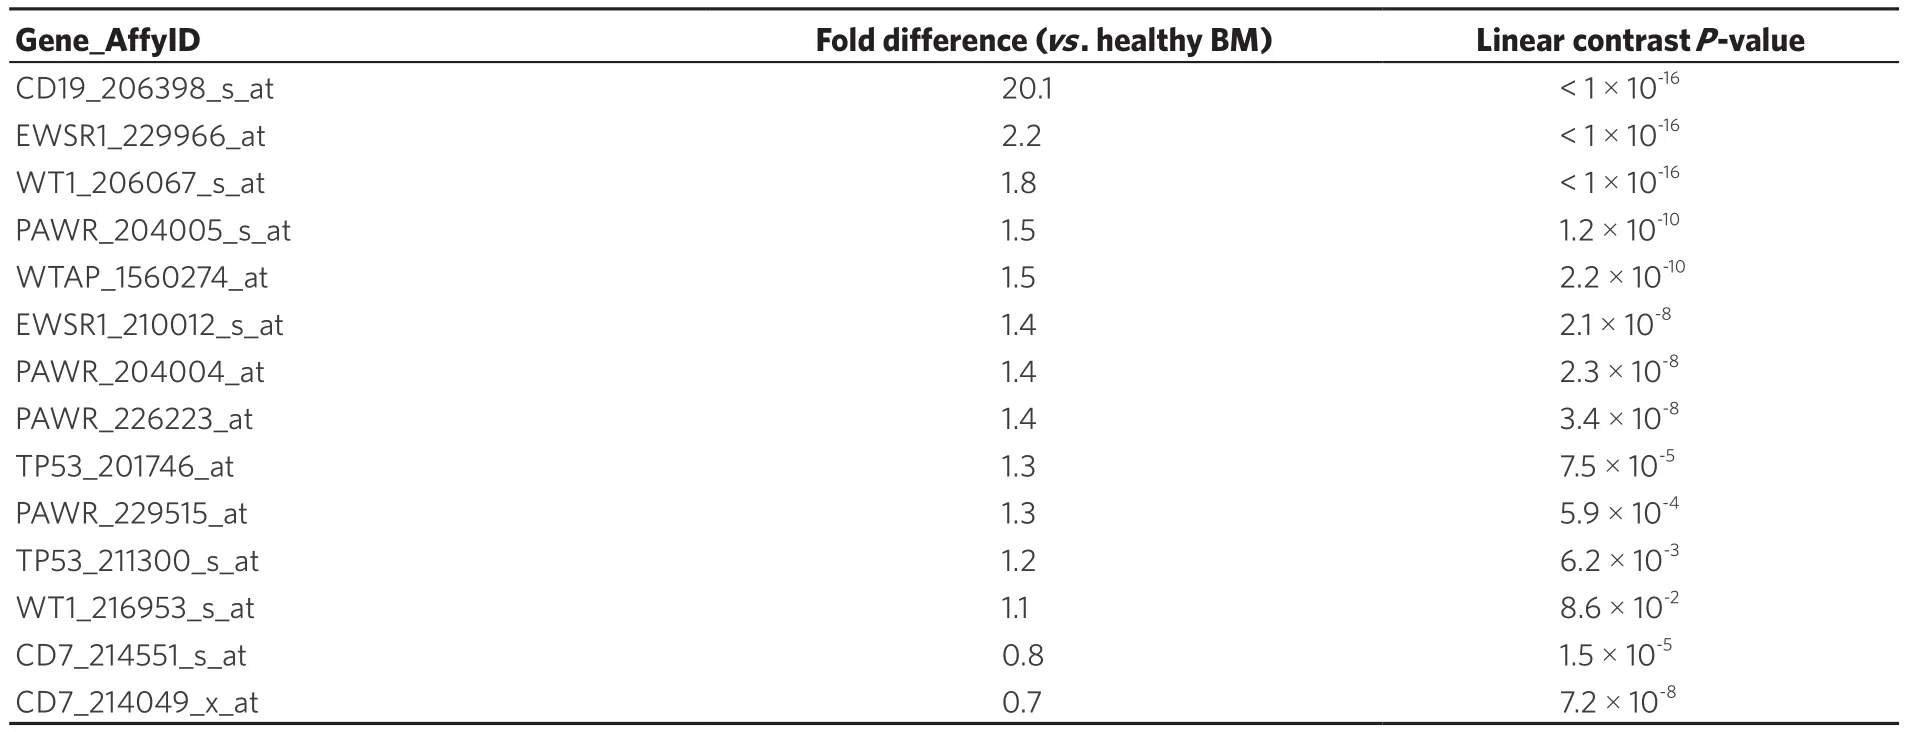
Table 2. Representation of the WT1 interactome in Ph+ B-lineage acute lymphoblastic leukemia transcriptome
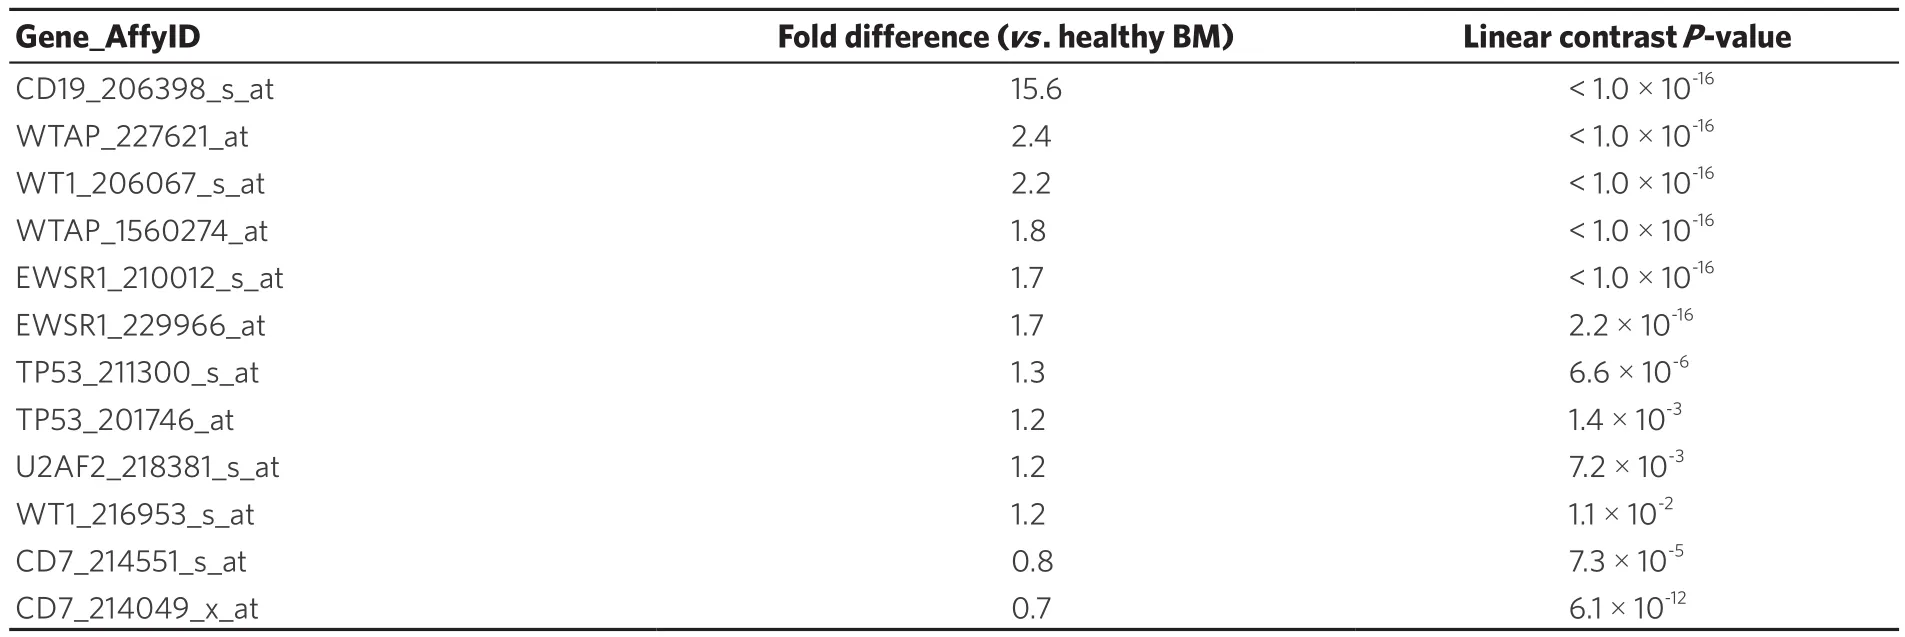
Table 3. Representation of the WT1 interactome in Ph+-like B-lineage acute lymphoblastic leukemia transcriptome
Amplified expression of WT1 in pediatric B-lineage ALL in relapse
Chemotherapy-resistant primarily leukemic cells from relapsed B-lineage ALL patients (n = 76) exhibited >1.25-fold higher expression levels of WT1 (detected by probe 206067_s_at) than primarily leukemia cells from newly diagnosed B-lineage ALL patients (n = 474) (P = 0.001) [Figure 7].
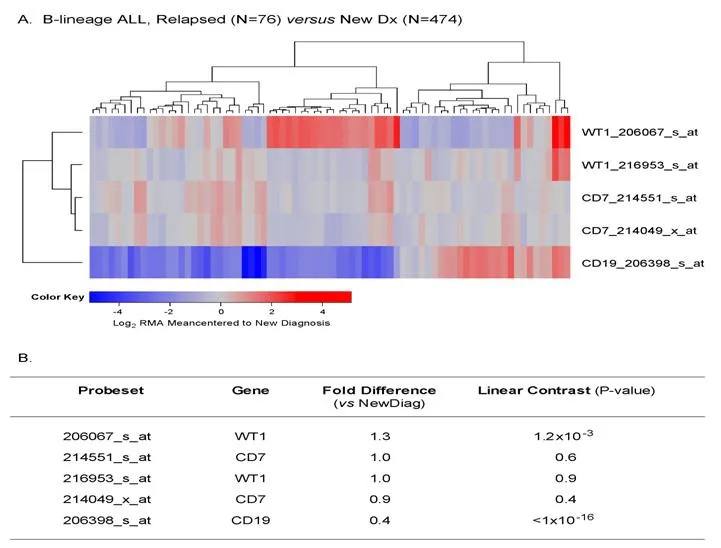
Figure 7. Augmented expression of WT1 in relapsed pediatric B-lineage acute lymphoblastic leukemia (ALL). Gene expression profiling data on primary leukemia cells from relapsed (n = 76; combined datasets from GSE18497 and GSE28460) vs. newly diagnosed (n = 474)B-lineage ALL patients were compared. Mixed ANOVA model was utilized to determine significant differences in expression between new diagnosis and relapse cases. A: A two-way agglomerative hierarchical clustering technique was used to organize expression patterns using the average distance linkage method such that probesets having similar matched pair differences across patients and samples having similar matched pair differences levels were grouped together. A heat map was constructed to depict change in expression level for each patient ranging from blue to red representing expression lower than at new diagnosis to greater than at new diagnosis for relapsed samples respectively for Log2 transformed robust multi-array analysis (RMA) values; B: probeset level and sample level Mixed Model Analysis of Variance analysis was utilized to compare the expression of the WT1 interactome plus the control genes in B-lineage ALL patients extracted from the in-house RMA normalized database. Fold change and linear contrast P-values are reported for the WT1,CD19 and CD7 probesets
DISCUSSION
Our meta-analysis of normal vs. 801 pediatric ALL samples deposited in the Oncomine database combined with an in-depth gene expression analysis using our in-house database of 1,416 pediatric ALL cases as presented herein have provided unprecedented evidence that primary leukemia cells from MLL-R+patients express highest levels of WT1 within the high-risk subsets of pediatric B-lineage ALL. The in-house database was constructed by combining raw Affymetrix gene chip files harboring expression profiling data from 6 datasets. We utilized robust and reproducible normalization of expression values across 6 independent datasets permitting direct comparison of WT1 expression in primary leukemia cells of high-risk subsets of ALL patients vs. normal hematopoietic cells. This procedure ensured that the median and interquartile range of expression values, and the median and interquartile standard error range of expression values,were consistent for each of the genes across all gene chips and datasets such that significance of expression changes were not due to batch artifacts arising from the processing of the raw data from different studies.Notably, MLL-R+patients exhibited > 6-fold higher expression of WT1, 206067_s_at probeset compared to the other B-lineage ALL subtypes combined (P < 0.0001). Our findings in 97 MLL-R+infant B-lineage ALL cases uniquely demonstrated that WT1 is expressed at 1.5-4.2-fold higher levels in MLL-R+infant leukemia cells than in normal hematopoietic cells and revealed that WT1 expression level was > 6-fold higher in steroid-resistant infant leukemia cells when compared to non-leukemic healthy bone marrow cells.Furthermore, our study demonstrates for the first time that the WT1-regulated EWSR1, TP53, U2AF2, and WTAP genes (i.e., WT1 interactome) were differentially upregulated in MLL-R+leukemic cells illustrating that the MLL-regulatory pathway is aberrantly upregulated in MLL-R pediatric B-lineage ALL. These novel insights provide compelling rationale for targeting WT1 in second line treatment of MLL-R+pediatric B-lineage ALL, including MLL-R+infant ALL. To our knowledge, this is the largest study of WT1 expression in pediatric cancer patients that also characterized the expression of the WT1 interactome in cancer cells from meta-analysis of independent gene expression studies. Furthermore, the normalization procedure at the gene chip level across independent datasets enabled comparisons of expression of WT1 that could not be performed between high-risk cancer subtypes and normal cells in the original independent datasets.Our study significantly extends the observations of Boublikova et al.[13]who evaluated WT1 expression in 125 patients with pediatric ALL.
Within the B-lineage ALL subset, we found that leukemia cells from 370 Ph-like patients had enhanced WT1 expression when compared to normal hematopoietic cells. To our knowledge, this is the first such report for the Ph-like ALL subset. Likewise, we found amplified WT1 expression in primary leukemia cells from 123 pediatric BCR-ABL/Ph+patients thereby confirming and extending an earlier report of high WT1 expression in adult BCR-ABL/Ph+ALL[12]. Finally, our findings demonstrate for the first time that chemotherapy-resistant primarily leukemic cells from relapsed B-lineage ALL patients exhibit higher expression levels of WT1 than primarily leukemia cells from newly diagnosed B-lineage ALL patients (P = 0.001). Thus, WT1 gene product may serve as a target for immunotherapy in these high risk/poor prognosis subsets of newly diagnosed as well as relapsed pediatric B-lineage ALL.
WT1 has been implicated in DNA damage response of T-lineage leukemia cells[37]. Neumann et al.[38]reported high level WT1 expression in patients with early T-cell precursor ALL (ETP-ALL), a high-risk subgroup of acute T-lineage ALL with a high rate of FLT3-mutations and low GATA3 expression and a low rate of TCR gene rearrangements consistent with a pluripotent prothymocyte stage in T-cell ontogeny. In our study, we examined the expression of WT1 in primary leukemic cells from 299 T-lineage ALL patients in the Oncomine database and 189 T-lineage ALL patients in the archived datasets GSE13159, GSE13351, and GSE13159. Our results presented herein significantly expanded the current knowledge of WT1 expression in T-lineage ALL and provided new evidence that WT1 gene and its interactome are expressed in T-lineage ALL cells at significantly higher levels than in normal hematopoietic cells. This previously unknown differential expression profile uniquely indicates that the WT1 gene product would be an attractive molecular target for treatment of T-lineage ALL.
WT1 antigen may contribute to a graft-versus-leukemia (GVL) effect after allogeneic HSCT. The immunogenicity of WT1 after HSCT for ALL highlights the potential for WT1 vaccines to boost GVL after SCT for ALL[39]. Both central memory (CD27+CD57-) and effector memory (CD27-CD57+) CD8+T-cell responses against WT1 have been reported for patients with ALL after allogeneic HSCT. WT1-specific CD8+T cells were only found in patients who had WT1 gene expression in their peripheral blood before transplantation[39]. The emergence of WT1-specific CD8+T cells was associated with a reduction in leukemia load as assessed by WT1 expression, supporting the immunogenicity of WT1 as a potential target for immunotherapeutic approaches in ALL. The prompt CD8+T-cell response to WT1 antigen suggests that the WT1 gene product could be a useful target for post-HSCT immunotherapy of ALL. Furthermore, the vigorous homeostatic proliferation of donor T cells after allogeneic HSCT, especially in a T-depleted setting, may represent a hitherto unconsidered window of opportunity for post-HSCT vaccination.
DECLARATIONS
Authors' contributions
Participated in the review of relevant literature, drafting of the manuscript, review and revisions of the final draft: Uckun FM, Qazi S
Performed the statistical and bioinformatics analyses: Qazi S
Availability of data and materials
The archived gene expression datasets GSE11877, GSE13159, GSE13351, GSE18497, GSE28460, GSE7440,GSE32962 and GSE68720 used in this meta-analysis are publicly available (Gene Expression Omnibus;https://www.ncbi.nlm.nih.gov/geo/) as is the online data mining tool, OncomineTMresearch edition(https://www.oncomine.org/resource/main.html).
Financial support and sponsorship
This work was supported by departmental funds of the Ares Pharmaceuticals Biotherapy Program. No external funding sources or sponsored research grants were used.
Conflicts of interest
Both authors declared that there are no conflicts of interest.
Ethical approval and consent to participate
Not applicable.
Consent for publication
Not applicable.
Copyright
© The Author(s) 2018.
杂志排行
Cancer Drug Resistance的其它文章
- Meeting Abstracts of the BACR conference:response and resistance in cancer therapy
- What really matters - response and resistance in cancer therapy
- Resistance to epidermal growth factor receptor inhibition in non-small cell lung cancer
- Epigenetics, a key player of immunotherapy resistance
- Antibody drug conjugate development in gastrointestinal cancers: hopes and hurdles from clinical trials
- Acknowledgement to reviewers of Cancer Drug Resistance in 2018
