The validity analysis of ground simulation test for non-ablative thermal protection materials
2018-02-13WangGuolinMengSongheJinHua
Wang Guolin, Meng Songhe, Jin Hua,*
(1. National Key Laboratory of Science and Technology on Advanced Composites in Special Environments, Harbin Institute of Technology, Harbin 150080, China; 2. Hypervelocity Aerodynamics Institute of China Aerodynamics Research and Development Center, Mianyang Sichuan 621000, China)
Abstract:The aerodynamic heat load on the surface of the non-ablative thermal protection materials which served in the chemical non-equilibrium flow field, is controlled by the coupling of chemical non-equilibrium degree of flow field and the surface catalytic reaction of the materials. If the coupled effect is neglected in the performance simulation, the effective service performance cannot be obtained through the ground simulation test. Therefore, according to the stagnation-point heat flux relationship within the boundary layer of the blunt body supersonic vehicle, the present paper analyzes the principal flow field parameters, the characteristics of high-enthalpy supersonic field provided by ground simulation equipment, and the differences between ground and flight environments. The validity of the Three-Parameter-Simulation method is analyzed by the CFD simulation. A Four-Parameter-Simulation method is presented for analyzing the heat transfer of the chemical non-equilibrium stagnation-point boundary layer. Besides, the properties of the thermal protection materials is analyzed and a preliminary solution is proposed when the dissociation enthalpy in the Four-Parameter-Simulation is unable to be simulated.
Keywords:non-ablative thermal protection materials;ground simulation test;chemical non-equilibrium flow;surface catalytic characteristics;numerical simulation
0 Introduction
The reentry vehicle with a large angle of attack and hypersonic speed flies in the chemical non-equilibrium thermal environment for a long time. The thermal environment has four distinctive characteristics, including high enthalpy, low pressure, low heat flux and chemical non-equilibrium flow, which provide favorable conditions for transiting the vehicle’s thermal protection system from ablative to non-ablative type. The surface catalytic and anti-oxidation characteristics of non-ablative thermal protection materials reduce the surface aerodynamic heat load and control the appearance of the vehicle[1-3]. Therefore, the objective and effective evaluations of catalytic and anti-oxidation properties are of utmost important in the selection of thermal protection materials. Moreover, the optimization design of thermal protection systems are based on these criterions.
At present, the rule of Three-Parameter-Simulation and the method of Stagnation-point-Simulation are generally adopted to investigate the performance of thermal protection materials. The Three-Parameter-Simulation, consisting of total enthalpy at the outer edge of boundary layer,wall pressure and heat flux of stagnation-point, suits with the heat transfer in the chemical equilibrium boundary layer[4-13]. In order to apply Three-Parameter-Simulation to simulate the heat transfer in the chemical frozen or non-equilibrium boundary layer (the flow has reached the chemical equilibrium state at the outer edge of boundary layer), the conception of “local heat transfer simulation” (LHTS[14]) is presented. The new three-parameters are corrected as total enthalpy, velocity gradient at the outer edge of boundary layer, and wall pressure on the stagnation-point.
However, if the chemical state is non-equilibrium at the outer edge of boundary layer, the Three-Parameter-Simulation is impossible to obtain the material’s effective service performance from the ground simulation test. Hence, in order to improve the service performance of non-ablative thermal protection materials, the fourth parameter simulation on the chemical non-equilibrium degree of the outer edge of boundary layer should be introduced into the aforementioned Three-Parameter-Simulation.
The current study analyzes the main flow field parameters and the effect of the stagnation-point heat flux of hypersonic blunt body on the basis of Fay-Riddell formula[15]and Goulard formula[16]. Subsequently, the paper introduces the simulated environmental characteristics provided by ground high-enthalpy simulation facility and highlights main differences from real flight environment. By combining the differences between simulation and flight tests, the validity of Three- and Four-Parameter-Simulations are theoretically analyzed. Moreover, the validity of simulation parameters selection has been demonstrated by a numerical simulation method. If the ratio of dissociation and total enthalpy at the outer edge of boundary layer cannot be simulated in the high enthalpy simulation facility, the stagnation-point heat flux of spacecraft cannot be simulated by the simulation test.
1 Analysis of the influence parameters of the stagnation-point heat flux for hypersonic vehicle
1.1 Influence parameters of the stagnation-point heat flux
For an axisymmetric blunt body, its stagnation-point heat flux can be determined by using different formulae, according to the different chemical states, within the boundary layer of the flow around the body. The stagnation-point heat flux within an equilibrium boundary layer can be determined by using Fay-Riddell formula (Tw≤2000K and the wall dissociation enthalpyhDw=0):

The stagnation-point heat flux of the frozen boundary layer is related to the rate constant of vehicle’s surface catalytic reaction,kw, which can be determined by using Goulard formula:
φ=[1+CHs/(ρwkw)]-1
(1b)
TheCHsis,
(2)
where the frozen Prandtl number,Prf, is the velocity gradient at the stagnation point, (due/dx)sis the velocity gradient at the outer edge of boundary layer,ρeandμeare the mix gas density and the viscosity coefficient at the outer edge of boundary layer, respectively.
According to the Fay-Riddell formula, theKvalue equals to 0.763, whereas the Goulard formula results in aKvalue of 0.664. The Damköhler number (Damw) of the surface catalysis reaction can be defined as:
Damw=ρwkw/CHs
(3)
For the approximation ofLef=Prf=1 andhte≫hfw, the formulae for stagnation-point heat flux within equilibrium and frozen boundary layers can be approximated as:
whereαis the ratio of dissociation to total enthalpy at the outer edge of boundary layer.
Equation (2) indicates thatCHsis controlled by (due/dx)s,ρeandμe. Because both of the mix gas density and viscosity coefficient are functions of enthalpy, pressure and species concentration (ρ=fρ(p,h,Ci) andμ=fμ(p,h,Ci)). At the chemical equilibrium outer edge of boundary layer,ρeandμeare the function ofpe,hte. For the chemical non-equilibrium at the outer edge of boundary layer, the functions areρe=fρ(pe,hte,Cie) andμe=fμ(pe,hte,Cie), wherepeis pressure at the outer edge of boundary layer, which equals to the stagnation pressure,ps.
Hence, if the outer edge of the chemidcal frozen boundary layer is chemical equilibrium, the stagnation-point heat flux is influenced by three field parameters,hte,psand (due/dx)s. If the outer edge of boundary layer is chemical non-equilibrium, the stagnation-point heat flux is also influenced by a fourth field parameter,α.
1.2 Coupling effect between dissociation enthalpy and catalytic reaction rate on the stagnation-point heat flux
Within the stagnation-point domain, the dissociation enthalpy is controlled by the vehicle’s head radius and flight orbit. In addition, the flow characteristic time (τf) around the body is proportional to the vehicle’s nosetip radius (Rn) , given by the following expression:
τf∝Rn/U∞
(5)
As a result,under the specific flight height and velocity,τfdecrease withRn. However,τfof the ionization and dissociation reactions remain constant after normal shock. Therefore, thehDeexhibits a direct relationship withRn. For convenience, the stagnation-point heat transfer theory for frozen boundary layer is used to analyze the coupling effect of dissociation enthalpy and the rate constant of surface catalytic reaction on the stagnation-point heat flux.

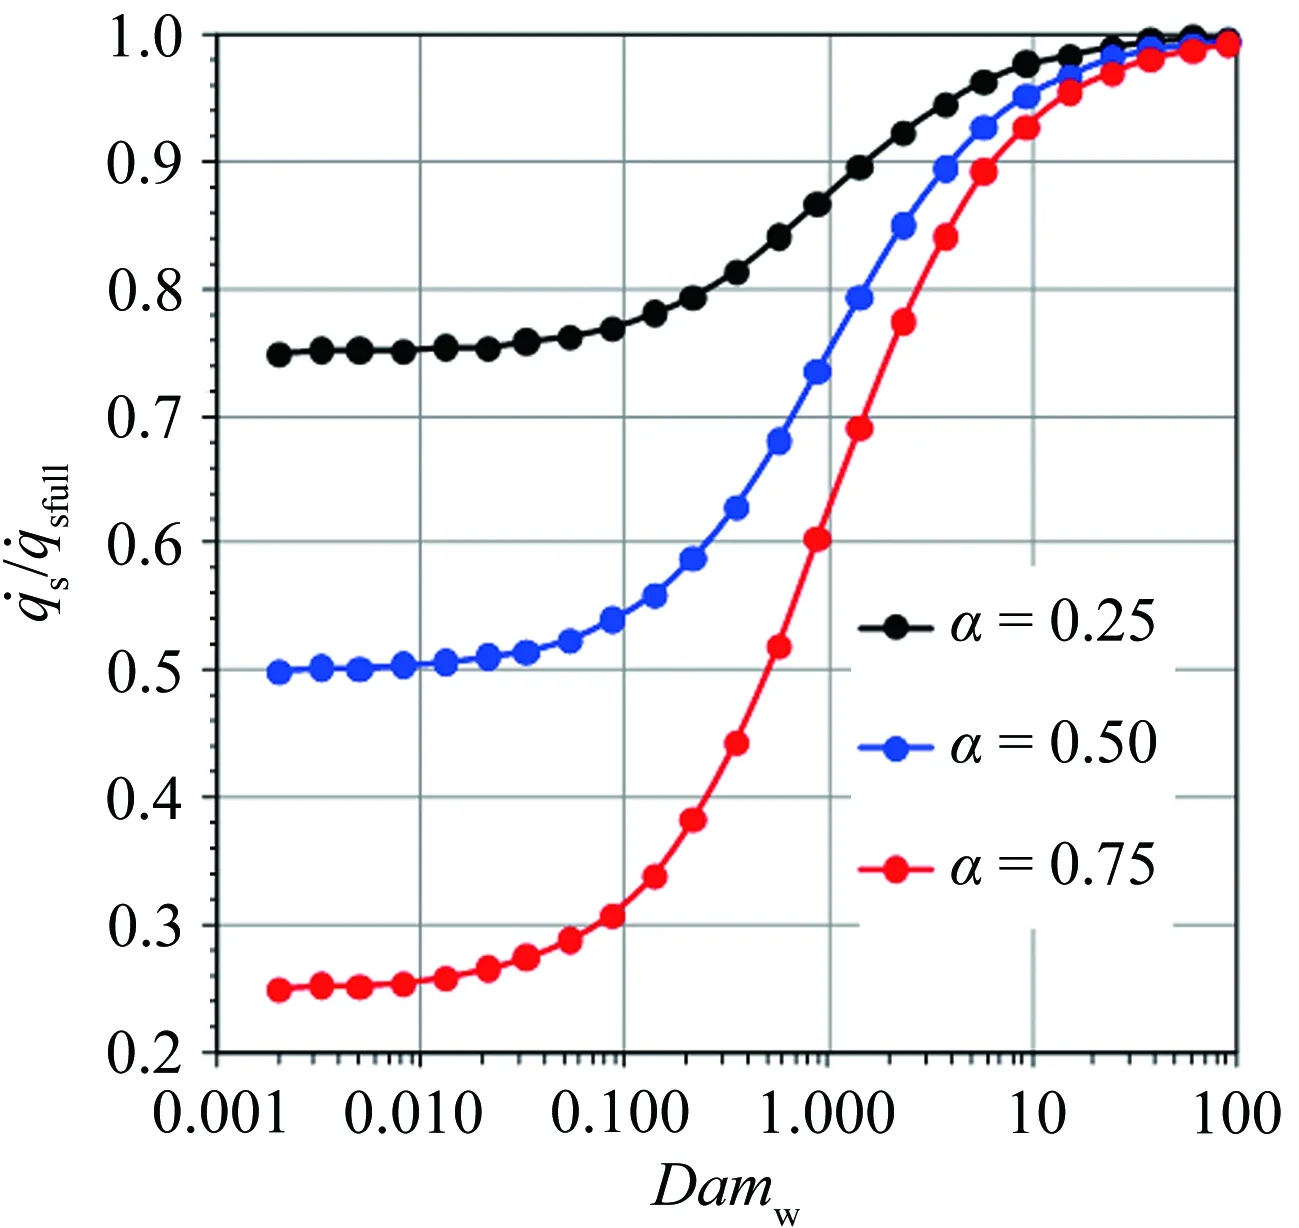
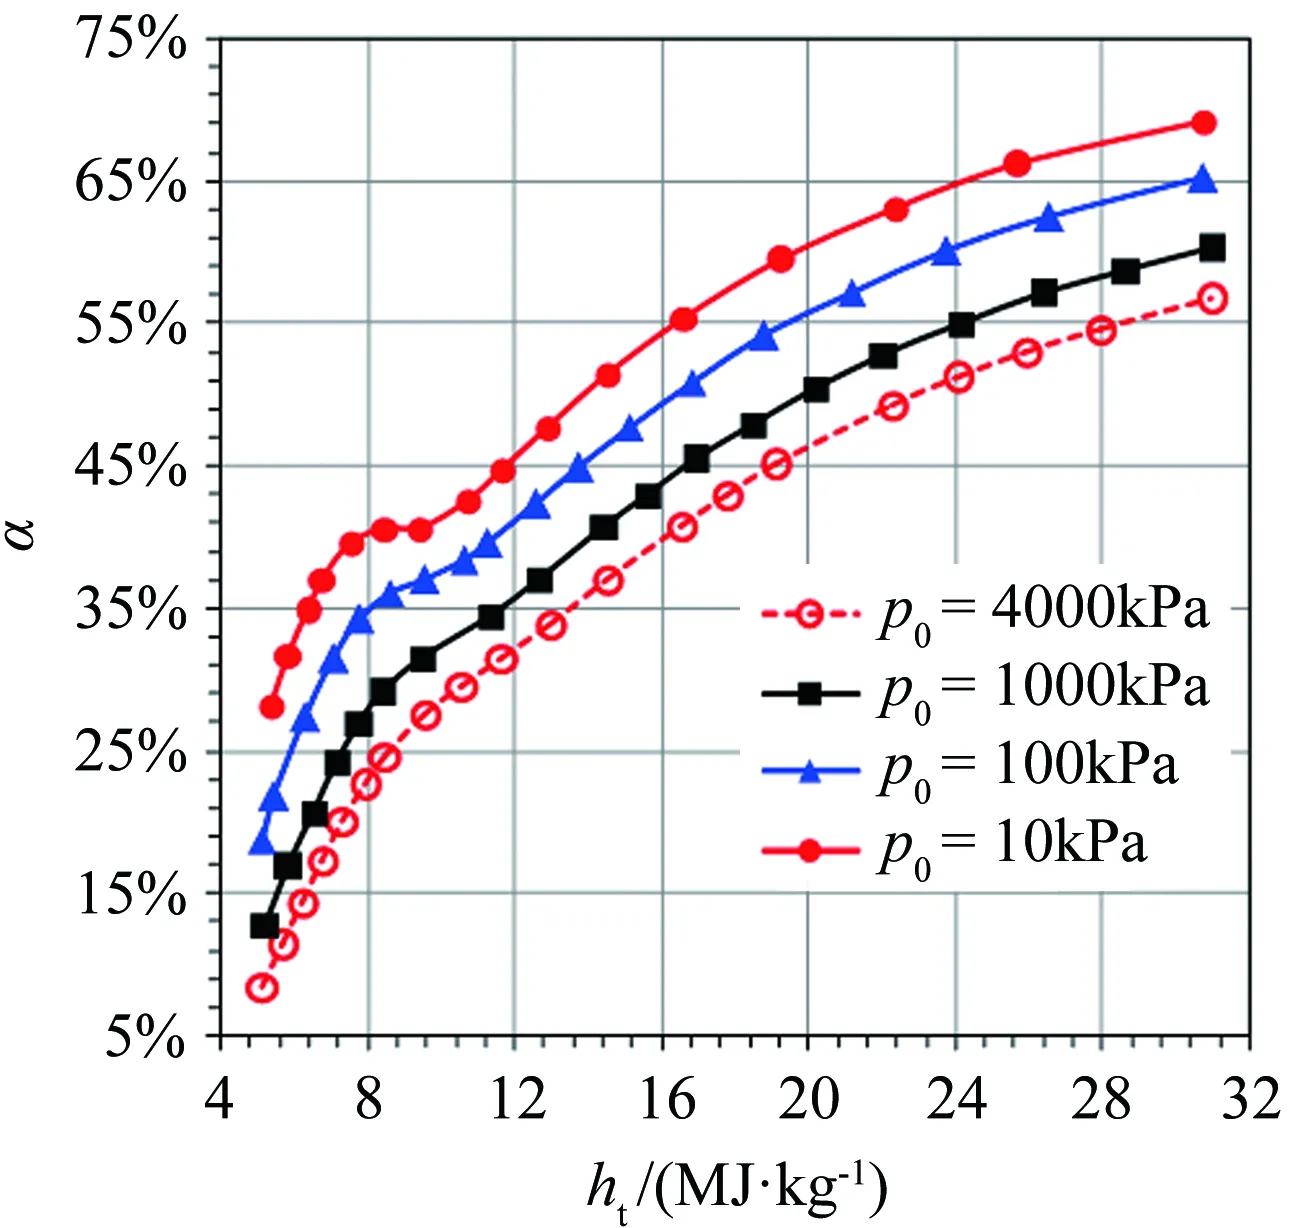
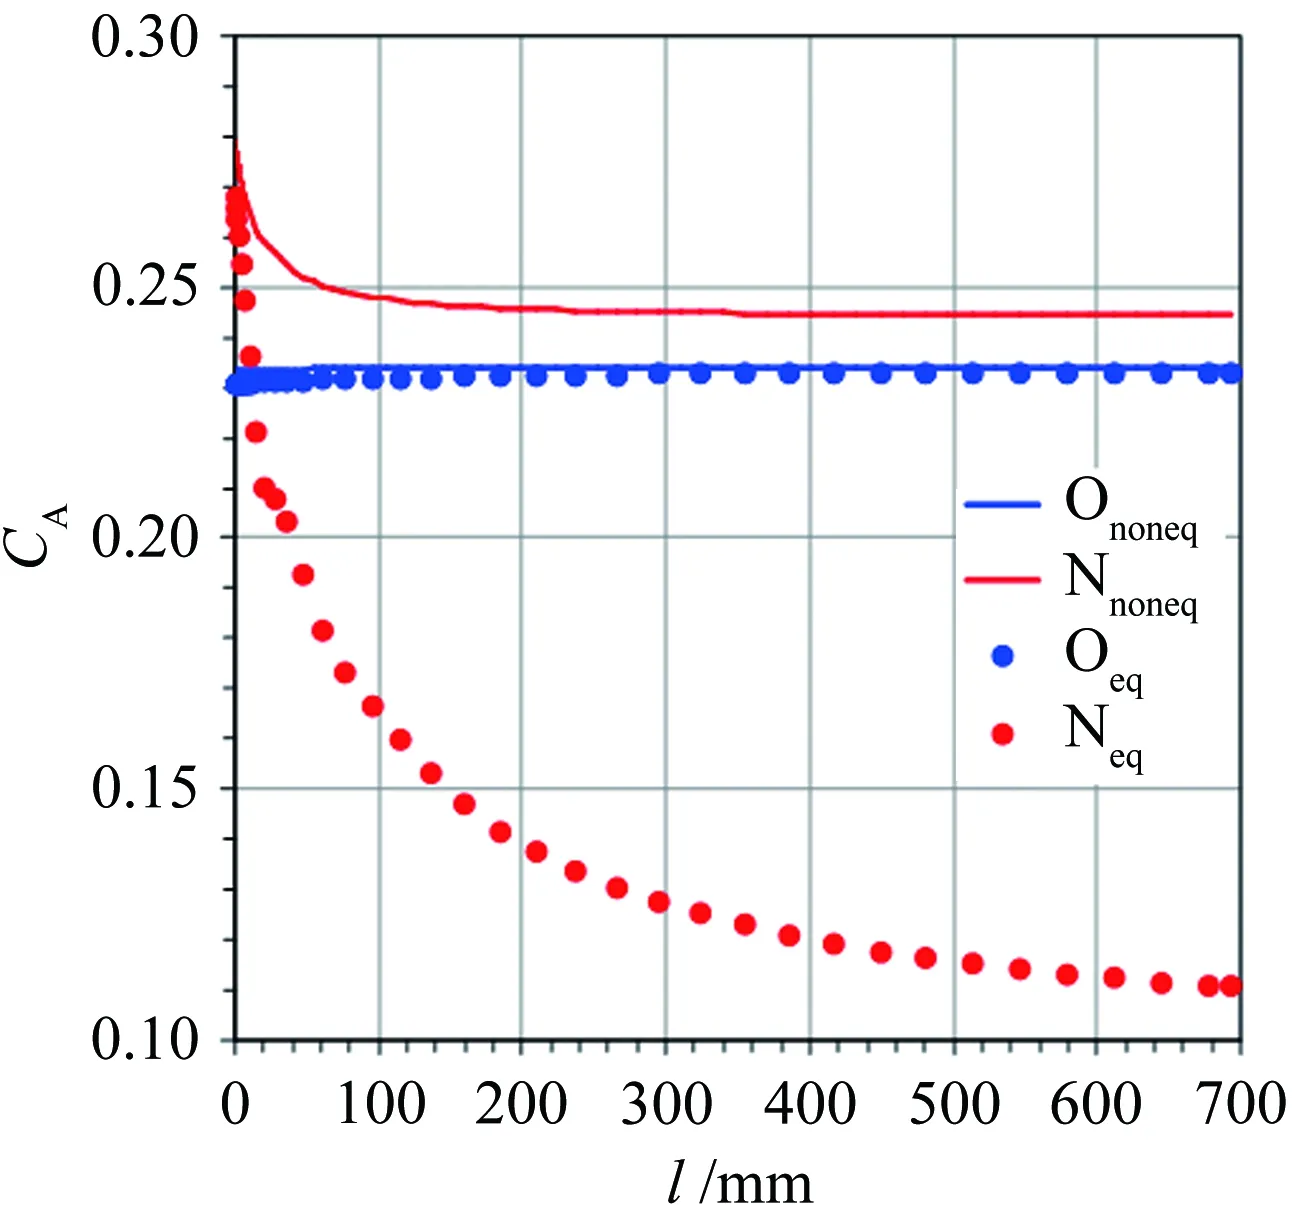
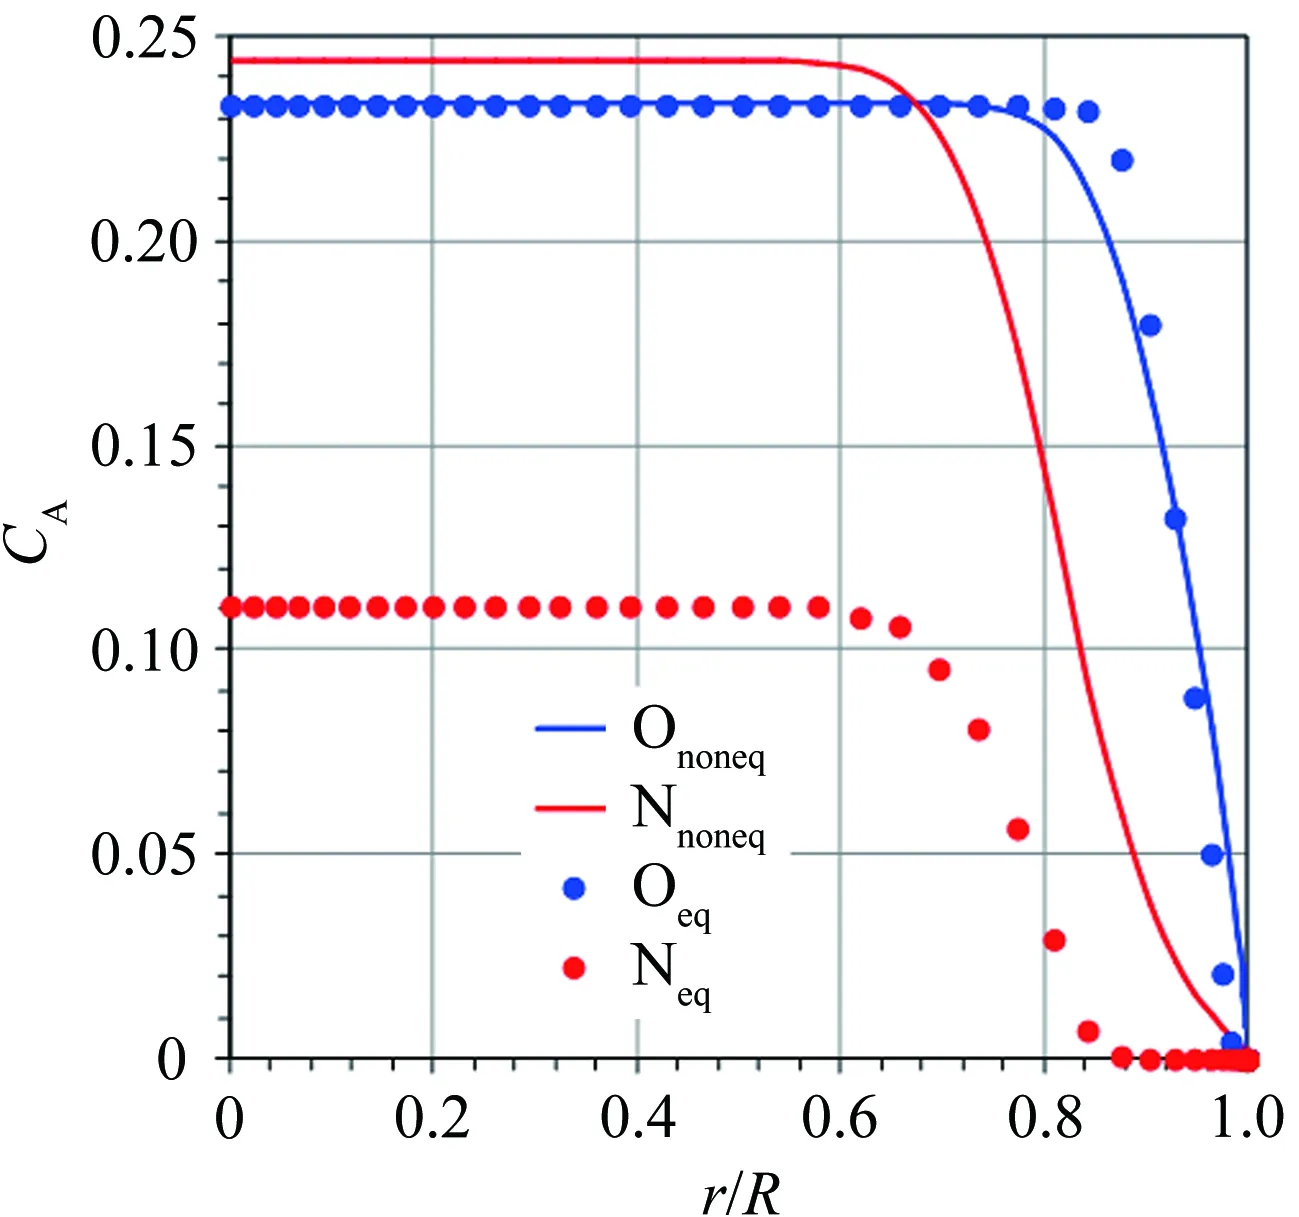
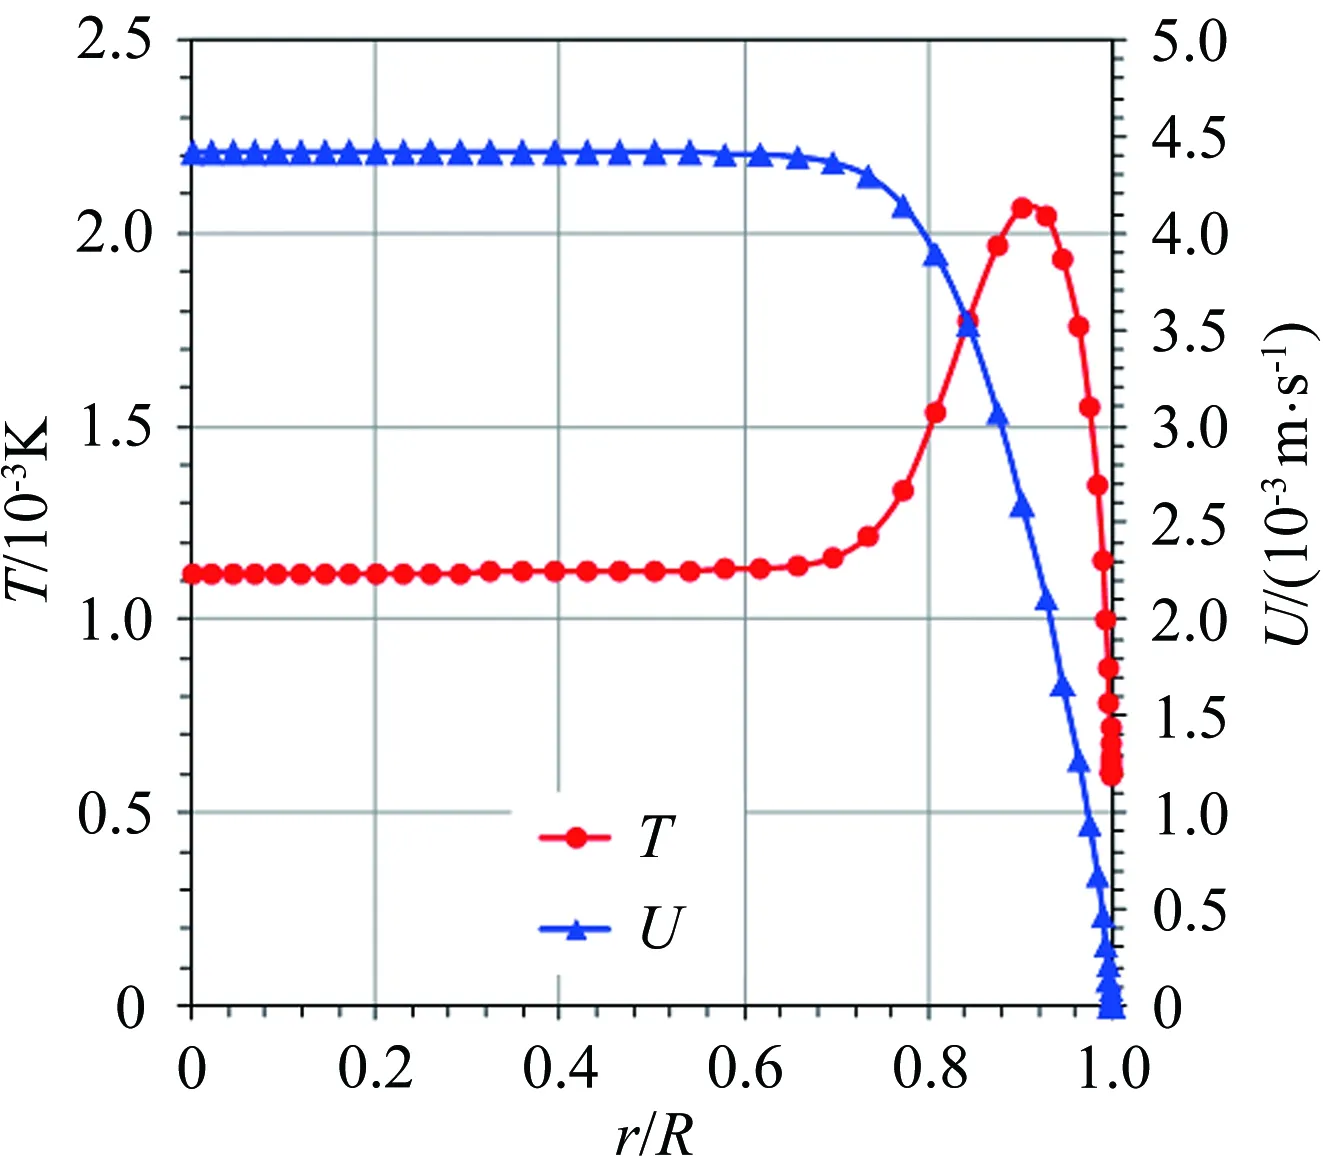
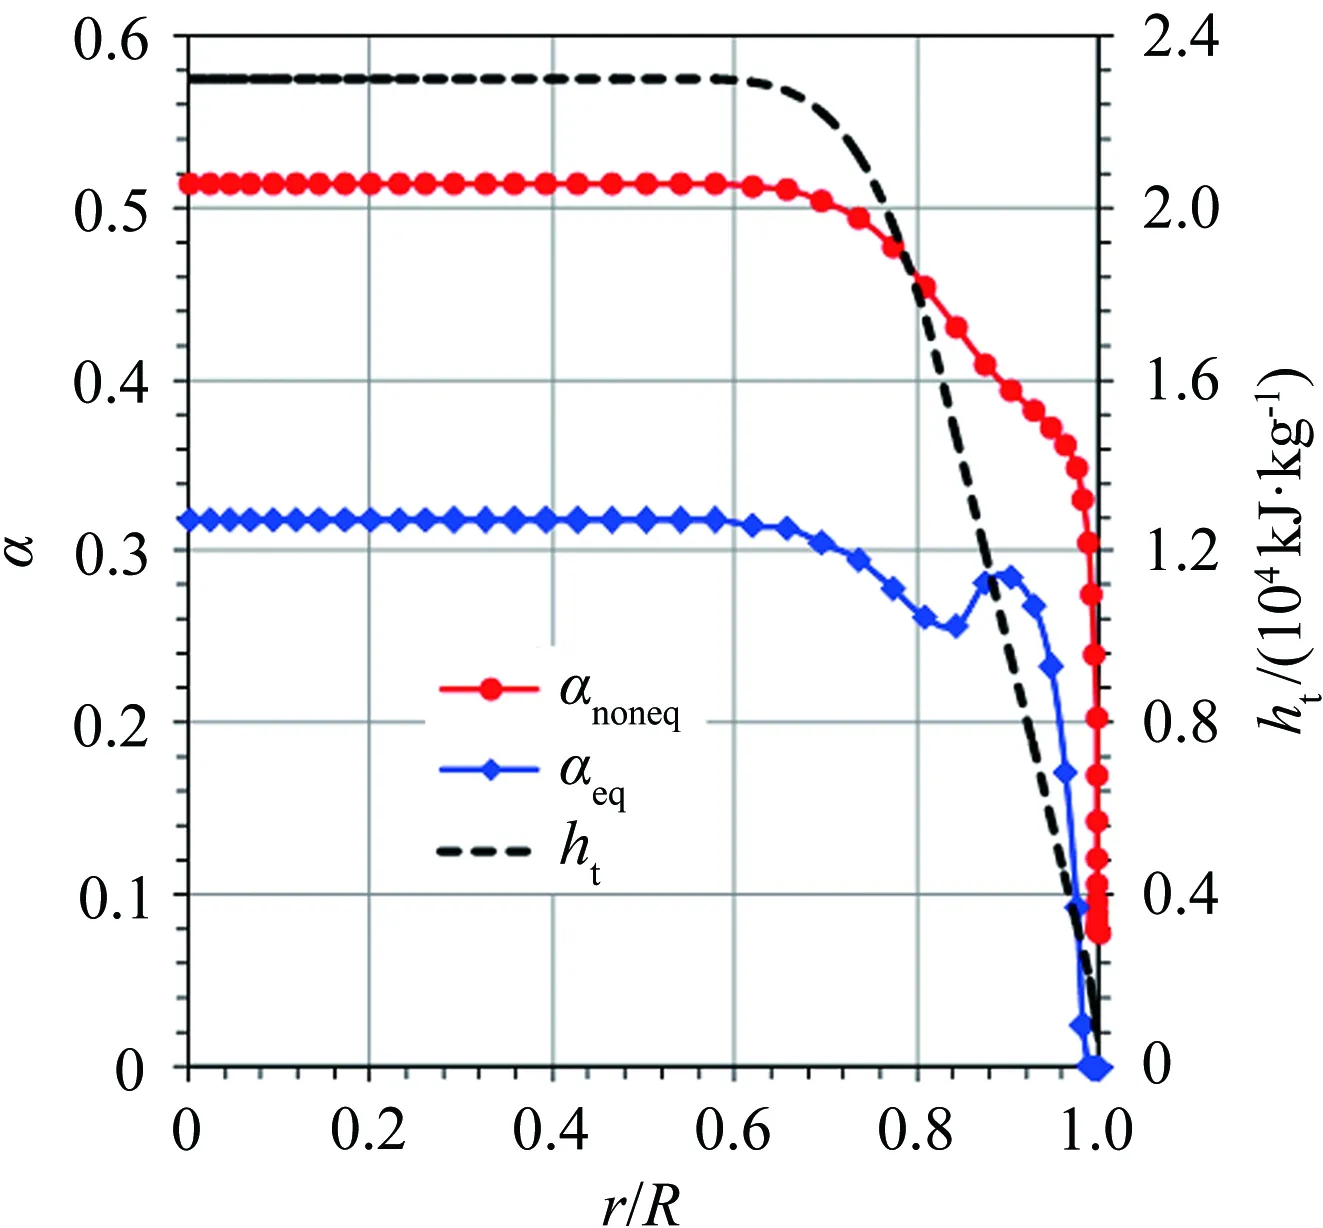
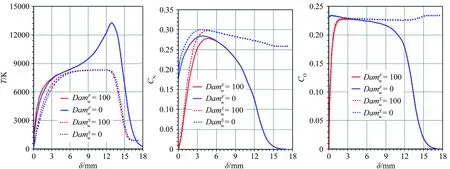
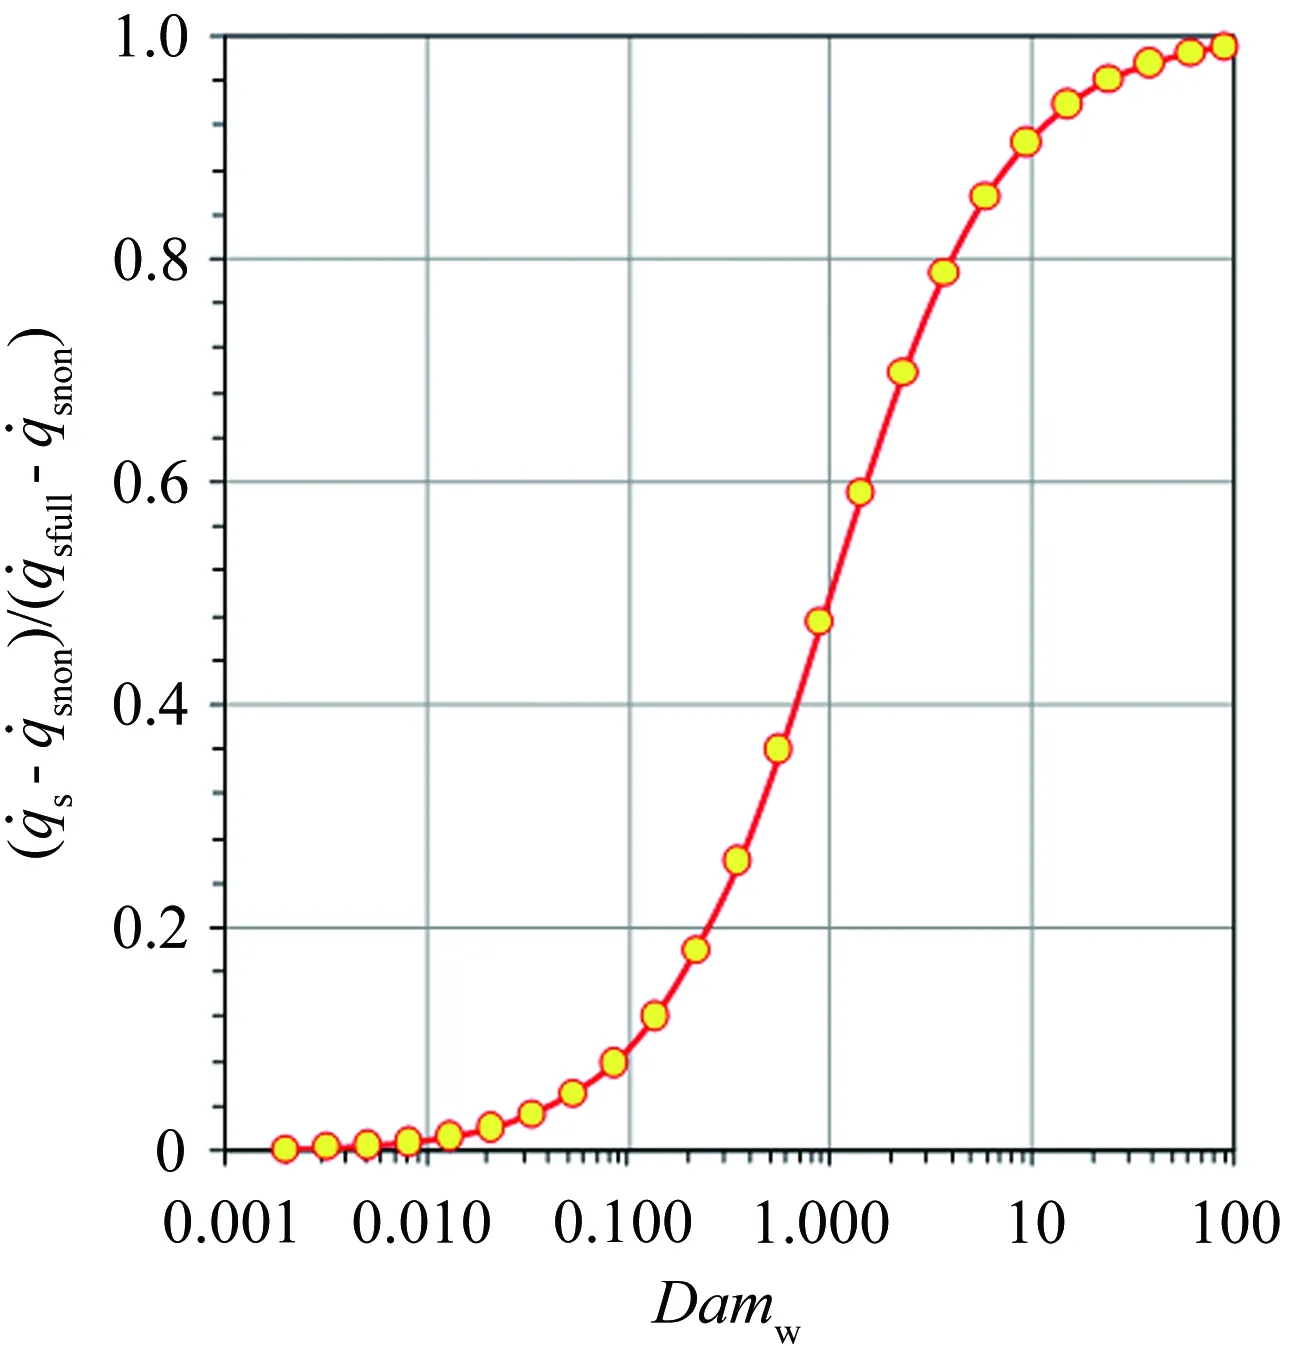
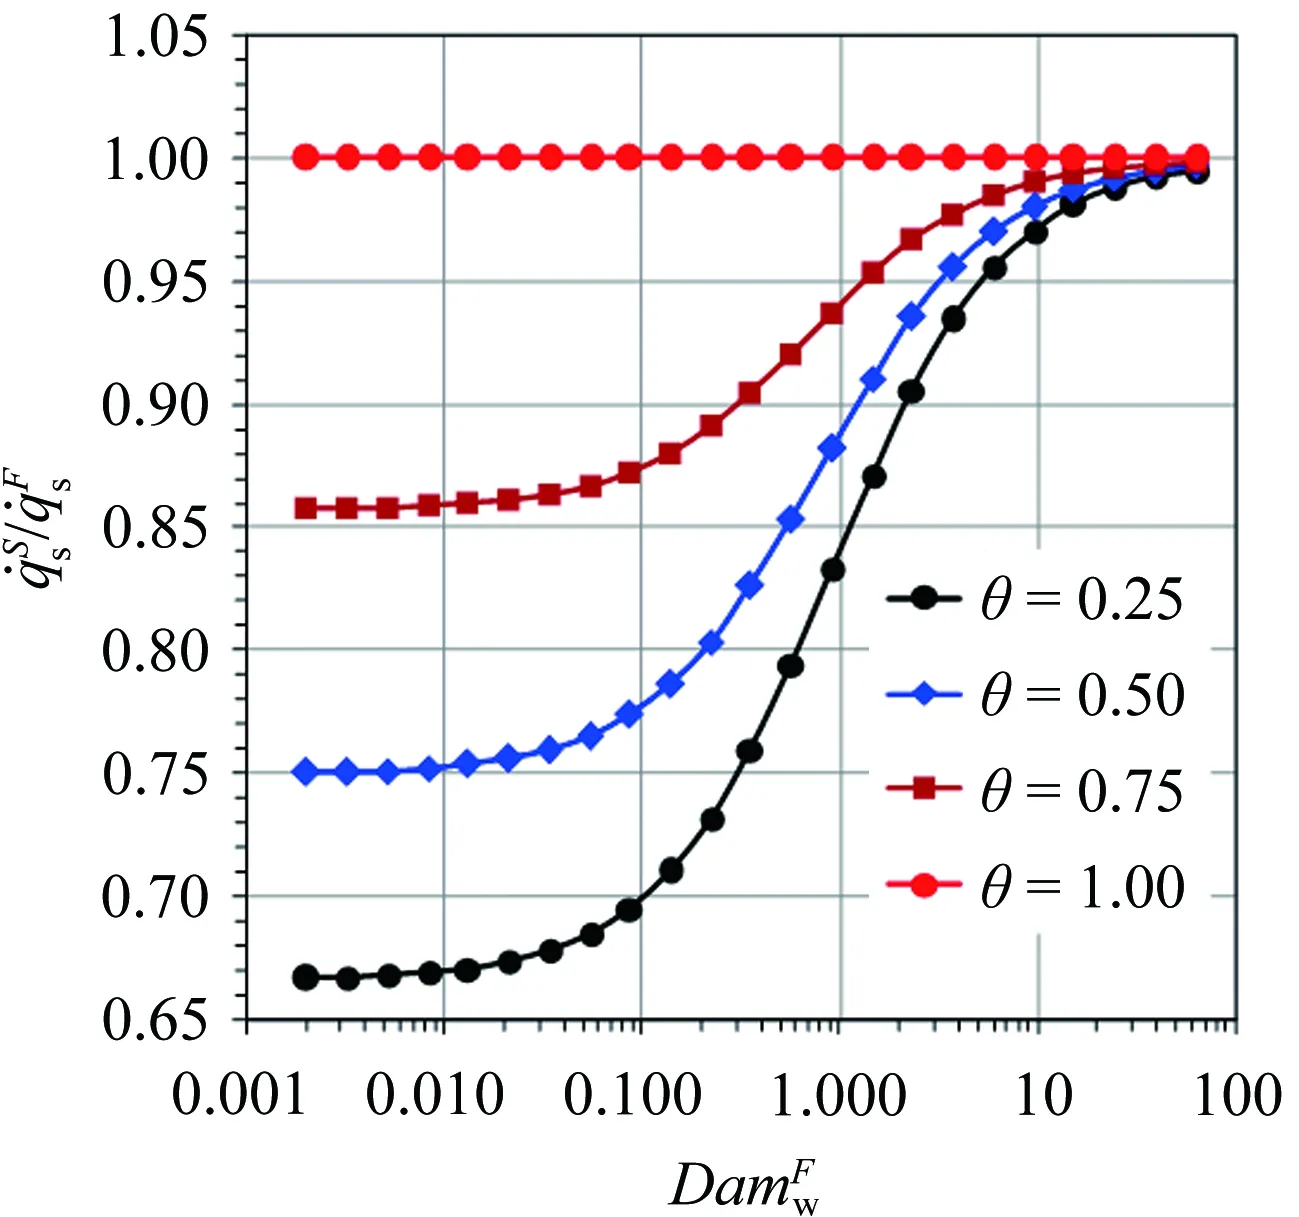
For a partially-catalytic surface, 0 (7) Fig.1 The variation of along with α and Damw For the fully-catalytic surface,the stagnation-point heat flux is not influenced by dissociation enthalpy. However, for the partially-catalytic surface, the stagnation-point heat flux shows linear relationship with dissociation enthalpy. In conclusion, the stagnation-point heat flux decreases with the increasing of dissociation enthalpy, which implies that the surface catalytic characteristics of non-ablative material have a significant impact on the stagnation-point heat flux. Therefore, it is indispensable to consider the dissociation enthalpy in the ground simulation test study for the service performance evaluation of these materials. In summary, the stagnation-point heat flux affected by the principal flow field factors includehte,ps, (due/dx)sandα. The first three parameters affect the stagnation-point heat flux within the chemical frozen and non-equilibrium boundary layer whose outer edge is chemical equilibrium. If the outer edge of boundary layer is chemical non-equilibrium, the stagnation-point heat flux is directly influenced byα. The arc-heated wind tunnel (AHWT) and induction-heated wind tunnel (IHWT) are main facilities to perform ground simulation research to evaluate the performance of thermal protection materials. Such kind of facility utilizes arc or induction heating to heat the in-chamber gas to the pre-set enthalpy value. Then, the in-chamber high-temperature gas gets dissociated and ionized and air dissociation enthalpy accounts for 10%~70% of the total enthalpy (see Fig.2), with the enthalpy range of 4~32 MJ/kg. Fig.2 The equilibrium air α changed with pressure and enthalpy When the in-chamber high-enthalpy air passes through the supersonic nozzle, a complex three-body collision reaction between the dissociated atoms occurs in the nozzle contraction section, which gradually reduces the dissociation enthalpy in the fluid. With the increase of flow rate , the frozen point of chemical flow state occurs at some positions in the nozzle’s expansion section (nozzle with a higher Mach number), resulting in the dissociation enthalpy of nozzle jet is higher than the equilibrium state. In order to quantitatively analyze the flow characteristics in the supersonic nozzles, the flow characteristics of the supersonic nozzles in the arc-heated and induction-heated wind tunnels are calculated, respectively. Table 1 presents the parameters of the in-chamber gas and the geometric parameters of the nozzle. Along the axis of the supersonic nozzle, the distribution ofCOandCNin the chemical equilibrium and the non-equilibrium are shown in Fig.3(a). Besides, the distribution ofCOandCNin the chemical equilibrium and the non-equilibrium states, the distribution of temperature (T)and velocity (U) of jet flow, and the distribution ofαandhtalong the cross-section of the nozzle are shown in Fig.3(b), (c) and (d), respectively. The numerical simulation results exhibit that under the supersonic conditions, the jet provided by the ground simulation equipment exhibits a severe chemical non-equilibrium state. Table 1 The states of supersonic flow fields in arc-heated wind tunnels for calculation表1 电弧加热风洞超声速流场计算状态参数 (a) Distribution ofCO(blue ) andCN(red) along the nozzle axis under the chemical equilibrium (dot) and non-equilibrium (line) states (b) Distribution ofCO(blue) andCN(red) along the cross-section of nozzle exit under the chemical equilibrium (dot) and the non-equilibrium (line) states (c) Distribution of T and U along the cross-section of the nozzle exit (d) Distribution of α and ht along the cross-section of nozzle exit Fig.3DistributionofparametersalongtheaxisandexitoftheAHWTnozzle 图3 各参数沿着电弧风洞喷管轴线和出口的分布 Therefore, the ground simulation environment is able to provide the same total enthalpy, stagnation-point pressure and velocity gradation as those in the actual flight environment. The main difference between simulated flow field and flight environment is the dissociation enthalpy (because the dissociation enthalpy is zero before the shock wave in the real flight environment). To study the service performance of non-ablative thermal protection materials in a chemical non-equilibrium environment, the FPS should be applied in the ground test simulation. The Four-Parameter-Simulation includes stagnation pressure, stagnation-point velocity gradient, total enthalpy and dissociation enthalpy, and the ground test results can reproduce the aerodynamic heat load at the stagnation-point region under the flight conditions. Total enthalpy: (8) Stagnation-point pressure: (9) Stagnation-point velocity gradient: (10) whereεrefers to the density ratio of gas “before” and “after” the shock wave,ε=ρ∞/ρe. The value has the following relationship with the Mach numberMa∞, and the ratio of specific heat capacities of the incoming flowγ∞. (11) In a ground simulation environment, the jet energy is consisting of gas kinetic energy, internal energy and dissociation energy. The total enthalpy of gas flow can be determined by the following equation: (12) The jet stagnation-point pressure can be determined from the given expression: (13) The velocity gradient, within a stagnation-point domain, can be determined according to the following relationship: (14) (15) To simulate the performance of material with a fully-catalytic surface, the Three-Parameter-Simulation (consisting of stagnation-point pressure, stagnation-point velocity gradient and total enthalpy) can provide the required data. However, for the material with partially-catalytic surface, dissociation enthalpy should be also considered. In order to verify the validity of parameter selection, the stagnation-point heat flux of vehicle under specific flight condition is compared with the stagnation-point heat flux of test piece under the corresponding ground simulation conditions. With the help of CFD, the selected flight conditions are shown in Table 2. Table 2 The flight conditions表2 飞行状态参数 Table 3 The AHWT simulation conditions表3 电弧加热风洞模拟状态参数 Table 4 The stagnation-point heat flux & pressure for flight environment表4 飞行环境下的驻点热流与压力 Table 5 The stagnation-point heat flux & pressure for simulated environment表5 模拟环境下的驻点热流与压力 (a) Temperature distribution (b) CN distribution (c)CO distribution (a) Temperature distribution (b) CN distribution (c) CO distribution Fig.6 The variation of with Damw According to equation 6(a) and (b), theαcan be determined by the non-catalytic and fully-catalytic stagnation-point heat flux: (16) According to equation (7) and (16): (17) (18) According to equation (18), in the chemical frozen boundary layer, only under the condition ofαS=αF, the simulation performed by Three-Parameter-Simulation method is valid. Therefore, for the stagnation-point heat transfer in the chemical frozen boundary layer, a reasonable simulation method should consist of total enthalpy, pressure, velocity gradient and the ratio of dissociation enthalpy to total enthalpy at the outer edge of boundary layer, that is the Four-Parameter-Simulation. In general,αF<αSresults in that the value of stagnation-point heat flux produced by ground simulation is smaller than that in the real flight environment. (1) When the outer edge of boundary layer is in the chemical equilibrium state, the Three-Parameter-Simulation is valid in both the ground simulation and real flight environment. (2) When the outer edge of boundary layer is in the non-equilibrium state, the Three-Parameter-Simulation will result in heat flux reduction in both the ground simulation and real flight environment, but the Four-Parameter-Simulation adopted in the test can compensate this problem. (3) While the dissociation enthalpy cannot be simulated, the only effective way to solve the problem of not being able to simulate the dissociation enthalpy is to determine the difference between the simulated stagnation point heat flux of partially-catalytic surface and the stagnation point heat flux in flight. The simulation results are then extrapolated to the flight environment via mutual verification between the ground simulation and the flight test.
2 Difference between ground simulation and flight environment

3 Selection of ground simulation parameters


3.1 Validity of simulation parameters



3.2 Selection of simulation parameters and validity analysis for partially-catalytic surface




4 Conclusions
