Shake-and-Read Test Strips for Discriminating Synthetic Food Colorants from Natural Colorants in Soft Drinks
2018-02-09WUHongjingWANGWeiyaYEWeijiaYANGPuningHUANGZhibingTUZhui
WU Hongjing, WANG Weiya, YE Weijia, YANG Puning, HUANG Zhibing, TU Zhui,*
(1. State Key Laboratory of Food Science and Technology, Nanchang University, Nanchang 330047, China;2. College of Science and Technology, Nanchang University, Nanchang 330029, China;3. Nanchang Institute for Food and Drug Control, Nanchang 330038, China)
Synthetic food colorants (SFCs) are widely used in food products to improve temptation of foods and to restore original appearance when natural colorants are lost during processing and storage. Nevertheless, synthetic colorants confer potential health risks to humans, especially children[1-5].In this regard, laws and regulations have been developed based on the experimental and post-risk assessment data to regulate the use and establish the maximum allowed levels of SFCs in food products[6]. Monitoring the implementation of SFC regulations is a challenging task because these colorants are more stable and cheaper than natural food colorants[7-8].Many surveillance studies have reported the illegal, deceitful, or improper use of SFCs in drinks and various foods, especially in the developing countries[9-11].
Several detection methods have been reported for simultaneous determination of various SFC types[12-14]; such techniques include thin-layer chromatography (TLC)[15],spectrophotometric analysis[16-18], differential pulse polarography[19], fluorescence-quenching[20], votammetry[21-22],ion mobility spectrometry[23], capillary electrophoresis[24-25],and high performance liquid chromatography (HPLC)[26-27].However, most of these methods require expensive equipment and involve time-consuming sample preparation, such as heating, ultrasonication, or use of toxic chemical reagents.
Polyamide powder has been widely used as a SFC adsorbent in sample preparation since 1972[28]. As SFCs commonly possess more than one anionic and hydrogenforming groups (CO, OH, and NH etc.), polyamide and SFCs exhibit strong interactions, including electrostatic,van der Waals, and hydrogen bonding[29]. Therefore, a rapid detection approach for SFCs with the naked eye could be developed, considering the binding activity of polyamide and the color of SFCs.
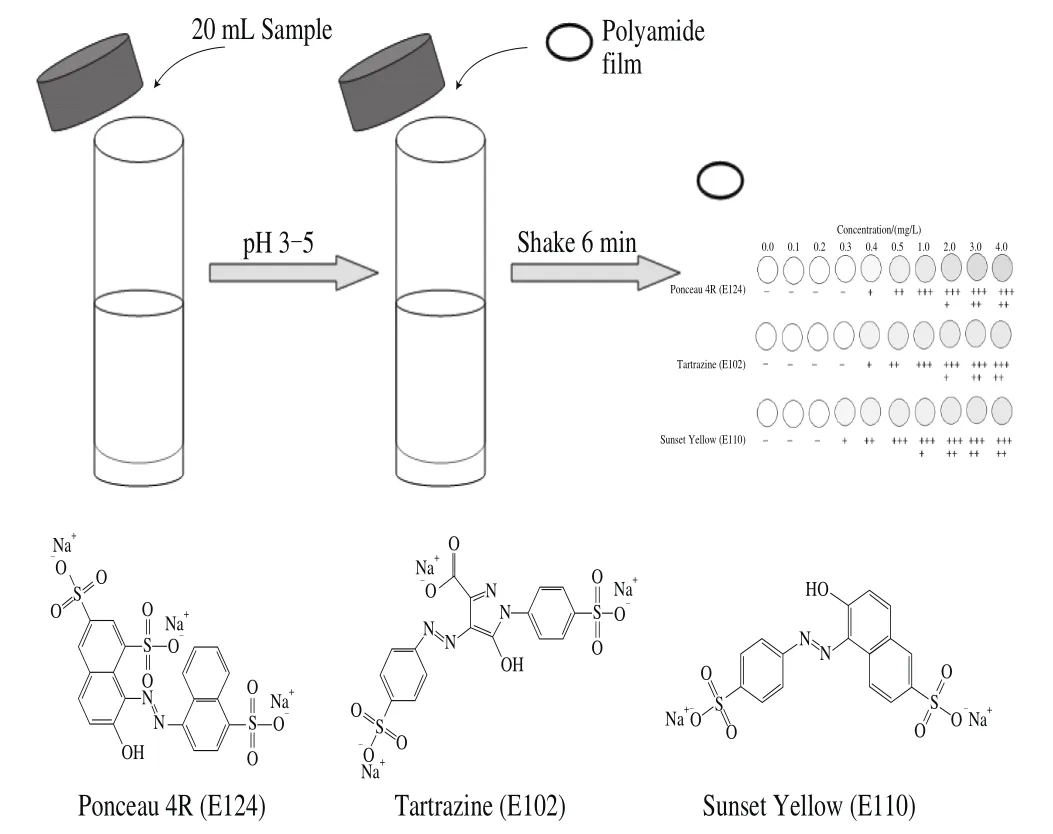
Fig. 1 Schematic illustration of the tests trip based on polyamide thin film
In this work, we proposed to use polyamide thin film as a tool for on-site identification of SFCs. A simple, rapid and instrumental-free method was developed and validated for the detection of three SFCs in commercial soft drinks (Fig. 1). The effects of various parameters, including strip diameter, assay duration, and adsorption conditions, were investigated and optimized. Fourteen soft drinks from local supermarkets were tested by the newly developed method, as well as TLC and HPLC methods.
1 Materials and Methods
1.1 Materials and reagents
The reference standards of synthetic colorants including Ponceau 4R (E124), Tartrazine (E102), and Sunset Yellow(E110) were obtained from Aladdin (Shanghai, China). Natural colorants including betalain, beta-carotene, maize yellow pigment, and monascus red were obtained from J&K Scientific Ltd. (Beijing, China) and used for cross-reactivity test. HPLC-grade methanol and acetonitrile were purchased from Sigma-Aldrich (Shanghai, China). Milli-Q water (Millipore, Bedford,MA, USA) was used throughout the study. All the other reagents were of analytical grade and obtained from Sinopharm Chemical Reagent Co. Ltd. (Shanghai, China). Solutions prepared for HPLC were filtered through 0.45 μm filters before use. Soft drinks used for assay validation were purchased from local supermarkets. Fourteen samples from different manufacturers were analyzed.
1.2 Instrument and equipment
An LC3000 HPLC system (Chuangxintongheng Science &Technology Co. Ltd., Beijing, China) equipped with a P3000 10 mL pump head and a UV3000 UV-VIS Detector(200‒800 nm) was used for SFC determination. A C18column (YWG-C184.6 mm (i.d.) × 250 mm, 10 μm) was used for chromatographic separation. Ultrasonic treatment was performed in a KQ-100B ultrasonic bath (Kun Shan Ultrasonic Instruments Co. Ltd., Kunshan, Jiangsu, China).Polyamide film (thickness, 0.1 mm) was purchased from Yaxing (Shanghai, China). Polyamide powder (diameter,0.2 mm) was obtained from Aladdin (Shanghai, China).
1.3 Methods
1.3.1 Preparation of standard solution and samples
Accurately weighed quantities of reference standards were dissolved individually with Milli-Q water to produce stock solutions (1.0 mg/mL). A mixed standard solution was prepared by adding each stock solution to a 100 mL-volumetric flask.Soft drink samples (20 mL of each) were used for the polyamine strip tests.
1.3.2 Polyamine strip test
A 20 mL-aliquot of the soft drink sample or standard solution was placed in a 50 mL screw-cap conical-bottom centrifugal tube. The pH was adjusted to 3‒5 by adding citrate acid (1 mol/L). A polyamide film were cut into a circle and placed in the centrifuge tube. After manually shaking the tube for several minutes, the polyamide film circle was washed with distilled water and dried in air.
1.3.3 TLC and HPLC analyses
TLC and HPLC analyses were performed according to the China National Standard GB/T 5009.35-2003. Briefly,20 mL of the samples were placed in a 50 mL screw-cap conical-bottom centrifugal tube. After adjusting the pH to 6, the samples were incubated in a water bath at 60 ℃for 5 min. Polyamide powder (1 g) was mixed with the sample, stirred for 5 min, and then filtered. The remaining polyamide powder was washed five times with 5 mL of water(60 ℃) and five times with 5 mL of methanol-formic acid (6:4,V/V). The adsorbed colorants were isolated using ethanolammonium hydroxide-water (7:2:1, V/V), concentrated to a volume of approximately 0.6 mL, and further diluted to 5 mL in water.
Briefly, 6 μL of the extract was spotted onto the silica gel chromatography plates. Each spot had a diameter of 3 mm. The plate was eluted in a glass chamber with butanol-ethanolammonium hydroxide (6:2:3, V/V) as the mobile phase. SFC was identified by comparing the colors and the ratio of fronts (Rf) values of the extract samples with those of the standards.
The extracted sample was filtrated before HPLC detection.The SFC was separated on a C18column in gradient elution mode with methanol and ammonium acetate (pH 4, 0.02 mol/L) as the mobile phase. The flow rate of the mobile phase was 1 mL/min, and the separated compounds were detected using a UV-VIS detector at 254 nm. Colorants were identified by comparing retention times. The quantity of colorants was determined based on the chromatographic peak area. The standard curve of each colorant was plotted with serial-diluted reference stock solutions.
2 Results and Analysis
2.1 Optimization of the strip test
Factors that may affect the sensitivity of the strip test were optimized using the three standard colorant solutions. First, polyamide films of various diameters(12, 10, 8, and 6 mm) were tested using 2.0 mg/L standard colorant solutions. The color of the polyamide film with a diameter of 12 mm was as uniform as other samples (Fig. 2). As shown in Fig. 3, the polyamide film circle was saturated with the colorant after shaking for 6 min. Incubation of polyamide film circles was also compared with and without shaking. Data showed that vigorous shaking was a critical procedure in the test(Fig. 4), which was consistent with the results of the study of Wu et al. on the use of ionic liquids for sample preparation[30]. The optimized strip test was conducted using 10 mm polyamide film circles with shaking for 6 min and used in the subsequent experiments.

Fig. 2 Polyamide films with various diameters
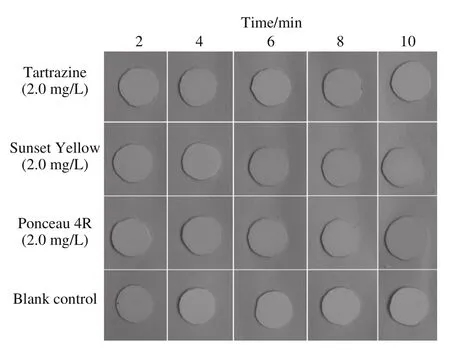
Fig. 3 Optimization of incubation time
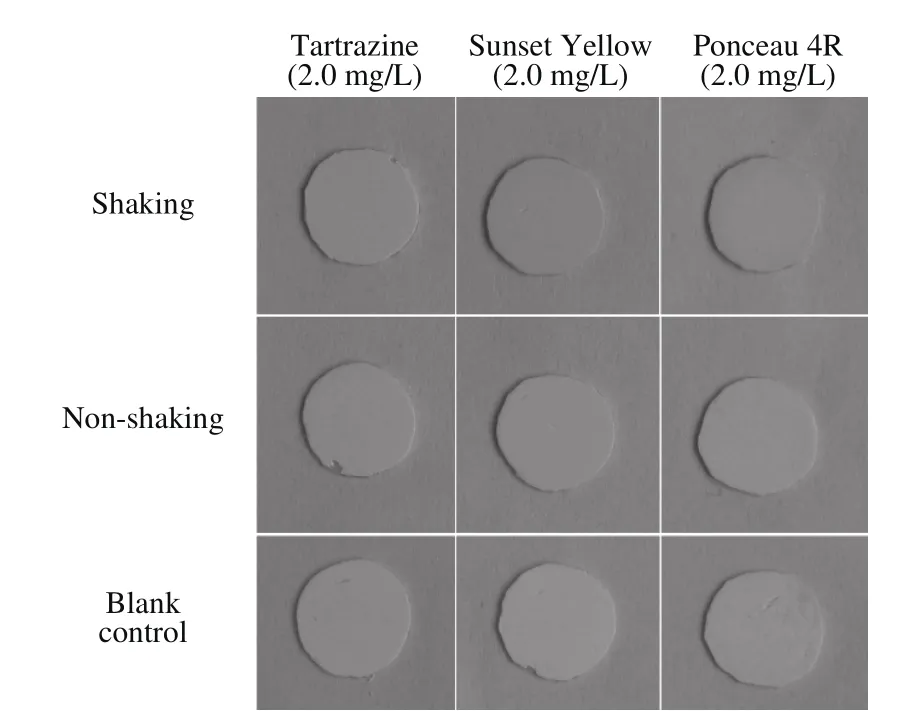
Fig. 4 Effect of shaking on the sensitivity of test strips
2.2 Determination of limits of detection (LOD)
Standard colorants were serially diluted at the concentrations of 0.1, 0.2, 0.3, 0.4, 0.5, 1.0, and 2.0 mg/L with citrate buffer (pH 4.0, 0.01 mol/L) to determine LOD of the strip test. The lowest concentration of the three SFCs that could be discriminated by the naked eye were 0.4, 0.3, and 0.4 mg/L for Ponceau 4R (E124), Tartrazine (E102), and Sunset Yellow(E110), respectively (Fig. 5). Furthermore, the interference effects of many ingredients commonly present in soft drinks were tested. The results showed that sensitivity was not affected by the presence of other ingredients, except starch (Table 1).
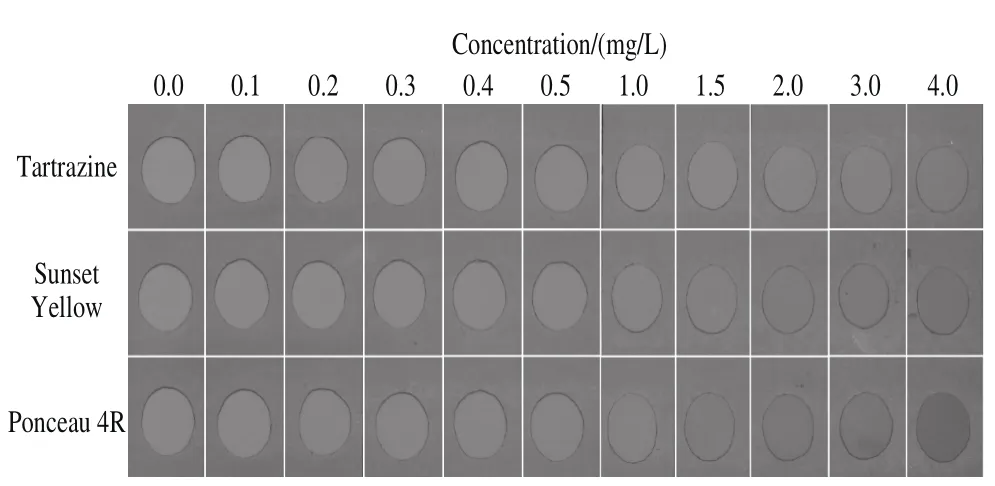
Fig. 5 Determination of the LODs of the strip test for the three colorants
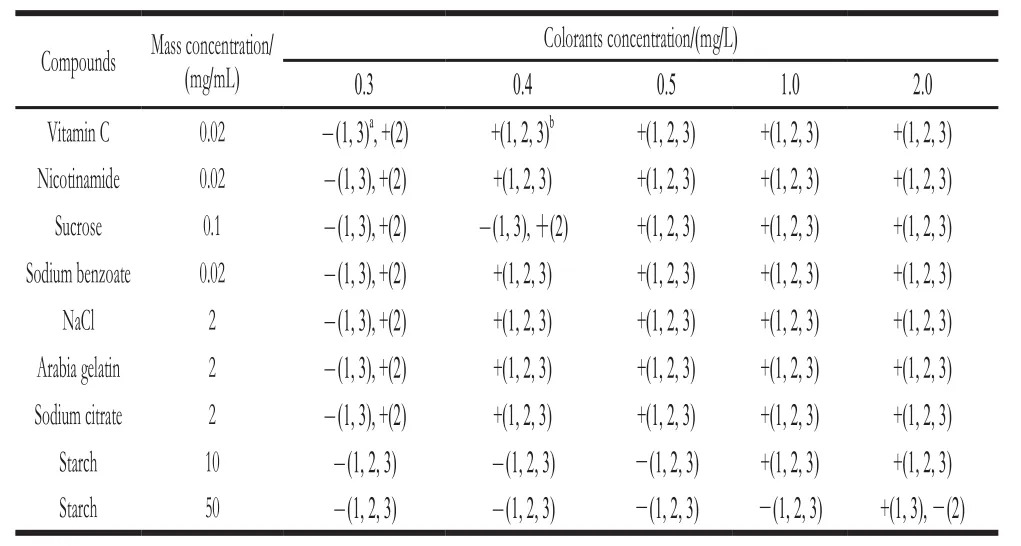
Table1 Interference effects of ingredients commonly present in soft drinks
2.3 Cross-reaction test
The specificity of the strip test was measured using four natural colorants, namely, betalain, beta-carotene, maize yellow pigment, and monascus red. The natural colorants were dissolved in citrate buffer (pH 4.0, 0.01 mol/L) at the concentrations of 1, 2, 5, 10, 50, and 100 mg/L. No color was observed on the polyamide film for all the tested natural colorants at each concentration (Table 2). The natural colorants could not be adsorbed onto the polyamide film, or could be easily washed off by citrate buffer.
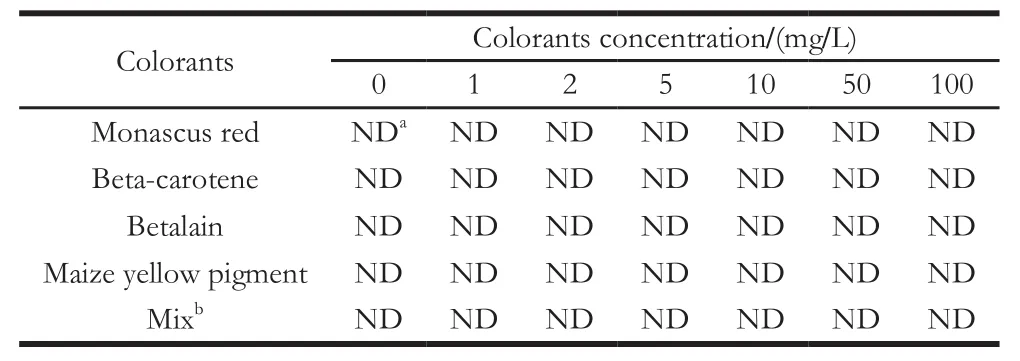
Table2 Cross-reactivities of four natural colorants
2.4 Assay validation
A spike-and-recovery analysis was performed to validate the accuracy of the strip test. Mango juice, orange juice, and peach juice were respectively spiked with known concentrations of the three SFCs and then tested under the optimal conditions of the strip test. All the spiked samples containing SFCs were recovered (Table 3), indicating that the matrix of juice does not effects the binding of SFCs to the strips.
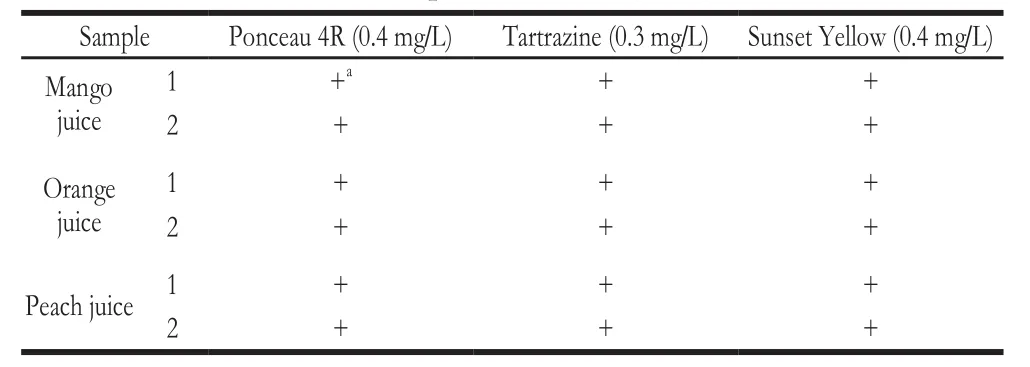
Table3 Spike-and-recovery analysis
Fourteen commercial soft drinks were analyzed using TLC, HPLC, and strip test (Table 4). The retention times of Ponceau 4R (E124), Tartrazine (E102), and Sunset Yellow(E110) in HPLC were 8.5, 4.4, and 10.1 min, respectively (Fig.6). The amount of each colorant was calculated based on the standard curves (Table 5).
Among the 14 samples, S1 was found to be SFC positive through detection using TLC and strip test but SFC-negative based on HPLC. This false positive result was probably due to the containing of other SFCs. A high peak at retention time 14.6 min was found in the HPLC of S1, which was not exist or much lower in other samples. These results indicate that sample S1 contains other SFCs adsorbed by the strip.
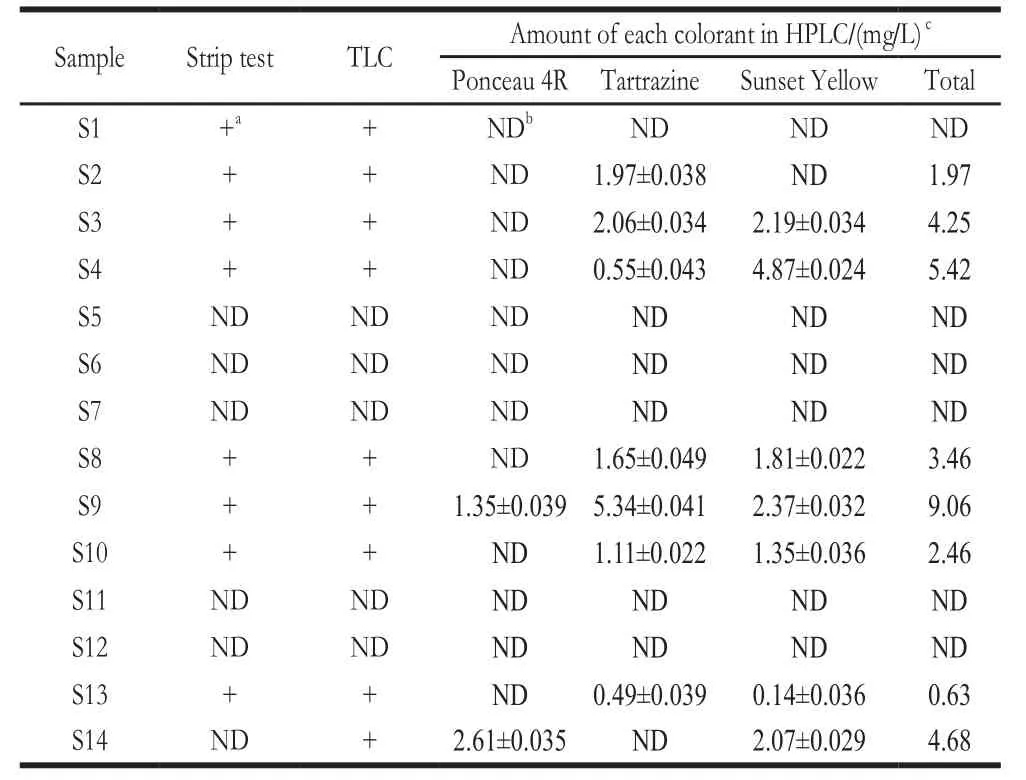
Table4 Validation of the test strip with 14 commercial soft drinks
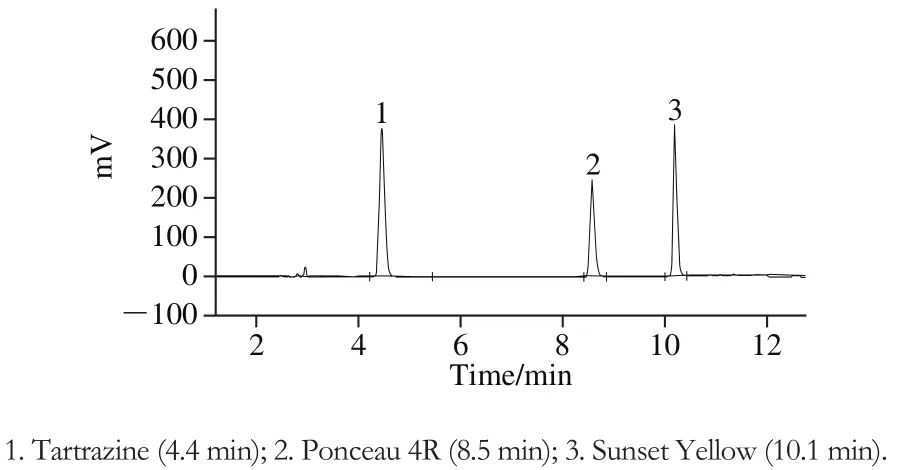
Fig. 6 HPLC chromatogram of mixed colorant standard solution(90 mg/L)

Table5 Standard curves of colorants by HPLC
Sample S14 was SFC-negative based on the strip test but SFC-positive as detected through TLC and HPLC. As the strip test cannot separate adsorbed synthetic colorants, a combination of yellow and red color, which generates orange,cannot be easily differentiated using the naked eye. Therefore,when yellow and red colorants simultaneously exist, detection sensitivity was decreased. However, according to the national food safety standards GB 2760-2014, the maximal levels of Ponceau 4R (E124), Tartrazine (E102), and Sunset Yellow(E110) in fruit and vegetable juice were 0.05, 0.1, and 0.1 g/kg, respectively[31]. The sensibility of the strip test was still much lower than the maximal levels of the three SFCs, and was suitable for qualitative detection. In general, the results based on the proposed strip test were consistent with those of the sophisticated methods assessed and were considered satisfactory for on-site rapid screening of SFC.
3 Conclusion
In this study, we established and optimized a shake-andread strip test based on polyamide film for SFC detection in soft drinks. Under the optimal conditions, the LODs of the three SFCs, namely, Ponceau 4R (E124), Tartrazine (E102), and Sunset Yellow (E110), were 0.4, 0.3, and 0.4 mg/L, respectively.The LODs of three SFCs were far below the maximal level according to the national regulation GB 2760-2014. Results could be obtained within 10 min by using the naked eye. The strip tests showed no cross reactions with other tested natural colorants. Validation results of the strip tests were in good agreement with the results of TLC and HPLC. The newly developed shake-and-read strip test is an easy, rapid, and lowcost procedure and is, therefore, suitable for high-throughput screening and on-site qualitative detection of SFCs. This study further indicates that the polyamide film-based strip test exhibits the potential for detection of other SFCs as well.
[1] COMBES R D, HAVELANDSMITH R B. A review of the genotoxicity of food, drug and cosmetic colors and other azo, triphenylmethane and xanthene dyes[J]. Mutation Research, 1982, 98(2): 101-243.DOI:10.1016/0165-1110(82)90015-X.
[2] MASONE D, CHANFORAN C. Study on the interaction of artificial and natural food colorants with human serum albumin: a computational point of view[J]. Computational Biology and Chemistry, 2015, 56: 152-158. DOI:10.1016/j.compbiolchem.2015.04.006.
[3] NIGG J T, LEWIS K, EDINGER T, et al. Meta-analysis of attentiondeficit/hyperactivity disorder or attention-deficit/hyperactivity disorder symptoms, restriction diet, and synthetic food color additives[J]. Journal of the American Academy of Child and Adolescent Psychiatry, 2012,51(1): 86-97. DOI:10.1016/j.jaac.2011.10.015.
[4] STEVENS L J, KUCZEK T, BURGESS J R, et al. Dietary sensitivities and ADHD symptoms: thirty-five years of research[J]. Clinical Pediatrics,2011, 50(4): 279-293. DOI:10.1177/0009922810384728.
[5] FEKETEA G, TSABOURI S. Common food colorants and allergic reactions in children: myth or reality?[J]. Food Chemistry, 2017, 230(1):578-588. DOI:10.1016/j.foodchem.2017.03.043.
[6] HARP B P, MIRANDA-BERMUDEZ E, BARROWS J N.Determination of seven certified color additives in food products using liquid chromatography[J]. Journal of Agricultural and Food Chemistry,2013, 61(15): 3726-3736. DOI:10.1021/jf400029y.
[7] OPLATOWSKA-STACHOWIAK M, ELLIOTT C T. Food colors:existing and emerging food safety concerns[J]. Critical Reviews in Food Science and Nutrition, 2016, 57(3): 524-548. DOI:10.1080/10408398.201 4.889652.
[8] MARTINS N, RORIZ C L, MORALES P, et al. Food colorants:challenges, opportunities and current desires of agro-industries to ensure consumer expectations and regulatory practices[J]. Trends in Food Science & Technology, 2016, 52: 1-15. DOI:10.1016/j.tifs.2016.03.009.
[9] DIXIT S, KHANNA S K, DAS M. Simultaneous determination of eight synthetic permitted and five commonly encountered nonpermitted food colors in various food matrixes by high-performance liquid chromatography[J]. Journal of AOAC International, 2010, 93(5): 1503-1514.
[10] DIXIT S, PURSHOTTAM S K, KHANNA S K, et al. Usage pattern of synthetic food colours in different states of india and exposure assessment through commodities preferentially consumed by children[J].Food Additives & Contaminants: Part A, Chemistry, Analysis, Control,Exposure & Risk Assessment, 2011, 28(8): 996-1005. DOI:10.1080/1944 0049.2011.580011.
[11] MORADI-KHATOONABADI Z, AMIRPOUR M, AKBARIAZAM M.Synthetic food colours in saffron solutions, saffron rice and saffron chicken from restaurants in Tehran, Iran[J]. Food Additives &Contaminants Part B, 2015, 8(1): 12-17. DOI:10.1080/19393210.2014.94 5195.
[12] YAMJALA K, NAINAR M S, RAMISETTI N R. Methods for the analysis of azo dyes employed in food industry: a review[J]. Food Chemistry, 2016, 192(1): 813-824. DOI:10.1016/j.foodchem.2015.07.085.[13] KUCHARSKA M, GRABKA J. A review of chromatographic methods for determination of synthetic food dyes[J]. Talanta, 2010, 80(3): 1045-1051. DOI:10.1016/j.talanta.2009.09.032.
[14] YAMJALA K, NAINAR M S, RAMISETTI N R. Methods for the analysis of azo dyes employed in food industry: a review[J]. Food Chemistry, 2016, 192: 813-824. DOI:10.1016/j.foodchem.2015.07.085.
[15] COBZAC S C, CASONI D, FAZAKAS A L, et al. Determination of food synthetic dyes in powders for jelly desserts using slit-scanning densitometry and image analysis methods[J]. Journal of Liquid Chromatography & Related Technologies, 2012, 35(10): 1429-1443. DOI:10.1080/10826076.2012.676875.
[16] NI Y, WANG Y, KOKOT S. Simultaneous kinetic spectrophotometric analysis of five synthetic food colorants with the aid of chemometrics[J].Talanta, 2009, 78(2): 432-441. DOI:10.1016/j.talanta.2008.11.035.
[17] BENVIDI A, ABBASI S, GHARAGHANI S, et al. Spectrophotometric determination of synthetic colorants using PSO-GA-ANN[J]. Food Chemistry, 2017, 220: 377-384. DOI:10.1016/j.foodchem.2016.10.010.
[18] 陈国庆, 吴亚敏, 刘慧娟, 等. 基于荧光光谱和径向基函数神经网络的合成食品色素测定和鉴别[J]. 光谱学与光谱分析, 2010, 30(3): 706-709. DOI:10.3964/j.issn.1000-0593(2010)03-0706-04.
[19] CHANLON S, JOLY-POTTUZ L, CHATELUT M, et al. Determination of carmoisine, allura red and Ponceau 4R in sweets and soft drinks by differential pulse polarography[J]. Journal of Food Composition and Analysis, 2005, 18(6): 503-515. DOI:10.1016/j.jfca.2004.05.005.
[20] ZHANG J P, NA L H, JIANG Y X, et al. A fluorescence-quenching method for quantitative analysis of Ponceau 4R in beverage[J]. Food Chemistry, 2017, 221: 803-808. DOI:10.1016/j.foodchem.2016.11.100.
[21] KROLICKA A, BOBROWSKI A, ZAREBSKI J, et al. Bismuth film electrodes for adsorptive stripping voltammetric determination of Sunset Yellow FCF in soft drinks[J]. Electroanalysis, 2014, 26(4): 756-765.DOI:10.1002/elan.201300497.
[22] NI Y N, BAI J L, JIN L. Multicomponent chemometric determination of colorant mixtures by voltammetry[J]. Analytical Letters, 1997, 30(9):1761-1777. DOI:10.1080/00032719708001692.
[23] JIAO J, WANG J, LI M, et al. Simultaneous determination of three azo dyes in food product by ion mobility spectrometry[J]. Journal of Chromatography B: Analytical Technologies in the Biomedical and Life Sciences, 2016, 1025: 105-109. DOI:10.1016/j.jchromb.2016.05.002.
[24] HUANG H Y, SHIH Y C, CHEN Y C. Determining eight colorants in milk beverages by capillary electrophoresis[J]. Journal of Chromatography A, 2002, 959(1/2): 317-325. DOI:10.1016/S0021-9673(02)00441-7.
[25] 郭芳芳, 冯锋, 白云峰, 等. 高效毛细管电泳-紫外检测法同时检测雪糕中多种添加剂[J]. 食品科学, 2015, 36(8): 206-210. DOI:10.7506/spkx1002-6630-201508038.
[26] KONG C, FODJO E K, LI D, et al. Chitosan-based adsorption and freeze deproteinization: improved extraction and purification of synthetic colorants from protein-rich food samples[J]. Food Chemistry, 2015, 188:240-247. DOI:10.1016/j.foodchem.2015.04.115.
[27] 刘慧慧, 宫向红, 徐英江, 等. 固相萃取-高效液相色谱法同时测定海米中10 种合成色素[J]. 食品科学, 2014, 35(4): 170-173. DOI:10.7506/spkx1002-6630-201404035.
[28] GILHOOLEY R A, HOODLESS R A, PITMAN K G, et al. Separation and identification of food colours. IV. extraction of synthetic watersoluble food colours[J]. Journal of Chromatography A, 1972, 72(2): 325-331. DOI:10.1016/S0021-9673(00)89517-5.
[29] KHALFAOUI M, BAOUAB M H V, GAUTHIER R, et al. Acid dye adsorption onto cationized polyamide fibres. Modeling and consequent interpretations of model parameter behaviours[J]. Journal of Colloid and Interface Science, 2006, 296(2): 419-427. DOI:10.1016/j.jcis.2005.09.030.
[30] WU H, GUO J B, DU L M, et al. A rapid shaking-based ionic liquid dispersive liquid phase microextraction for the simultaneous determination of six synthetic food colourants in soft drinks,sugar- and gelatin-based confectionery by high-performance liquid chromatography[J]. Food Chemistry, 2013, 141(1): 182-186.DOI:10.1016/j.foodchem.2013.03.015.
[31] 国家卫生和计划生育委员会. 食品添加剂使用标准: GB 2760—2014[S]. 北京: 中国标准出版社, 2014.
