大兴安岭林区南、北部天然樟子松生长对气候变化的响应差异
2017-11-23李俊霞白学平张先亮常永兴赵学鹏陈振举
李俊霞,白学平,张先亮,常永兴,陆 旭,赵学鹏,陈振举,2,*
1 沈阳农业大学,沈阳 110866 2 中国森林生态系统监测网络辽宁辽河平原森林生态系统定位研究站,昌图 112500
大兴安岭林区南、北部天然樟子松生长对气候变化的响应差异
李俊霞1,白学平1,张先亮1,常永兴1,陆 旭1,赵学鹏1,陈振举1,2,*
1 沈阳农业大学,沈阳 110866 2 中国森林生态系统监测网络辽宁辽河平原森林生态系统定位研究站,昌图 112500
利用树木年代学方法,建立大兴安岭林区南、北部樟子松(Pinussylvestrisvar.mongolica)年轮宽度年表,探讨樟子松径向生长对气候变化的响应差异。结果表明,南部(阿尔山、海拉尔)树轮宽度主要与当年4—9月的平均标准化降水蒸散指数SPEI(Standardized Precipitation Evapotranspiration Index)极显著正相关(r=0.639,P<0.01),而北部(漠河、塔河)树轮宽度主要与同时期的平均最低温极显著正相关(r=0.488,P<0.01)。说明南部樟子松径向生长主要受当年4—9月的水分限制,北部主要受同期平均最低温调控。两个地区树木生长对降水的响应一致,对当年4—9月(6月除外)的温度响应相反。近几十年来随着温度显著升高(P<0.01),南部树木生长对4—9月平均最高温的负响应不断增强,而北部树木对同时段平均最低温的正响应更加明显。同时,南部樟子松生长量快速下降(r=0.612,P<0.001),而北部生长量显著增加(r=0.474,P<0.001)。研究发现,高温加剧干旱胁迫是南部樟子松生长量下降的主要原因,而北部樟子松生长量增加是受到4—9月平均最低温和降水量的相互作用。如果持续变暖,未来樟子松分布区可能北移。
大兴安岭;气候变化;樟子松;径向生长;响应差异
近年来气候变暖对树木生长产生了不同的影响。欧洲赤松(Pinussylvestris)、欧洲黑松(Pinusnigra)、红松(Pinuskoraiensis)、青海云杉(Piceacrassfolia)及白杄(Piceameyeri)等树种在海拔或纬度梯度上出现生长分异,在纬度南界或海拔下限树木生长量明显下降,而在纬度北界或海拔上限树木生长量增加[1- 5]。温度上升引起欧亚大陆植被总初级生产力增加[6],使森林“绿化”[7],但在气候敏感地区,升温引起的水分胁迫导致树木生长衰退以及死亡率上升[8- 9],出现森林“棕化”现象[10]。同一地区的树木对气候变化的响应也不稳定,既存在正响应又存在负响应[11-12]。因此,揭示树木生长对气候变化的响应差异对准确预测未来森林生态系统的变化具有重要意义。
樟子松(Pinussylvestrisvar.mongolica)是欧洲赤松的地理变种,在我国集中分布在大兴安岭北部山地和南部的呼伦贝尔沙地[13]。该地区开展了许多樟子松生长—气候关系研究,如红花尔基、海拉尔等地樟子松生长主要受降水影响[14-15],漠河、永安山等地的树木生长主要受温度驱动[16- 17]。在气候变暖背景下,樟子松人工林出现衰退趋势[13,18],满归地区天然樟子松林的径向生长也受到抑制[19]。大兴安岭不同地区樟子松生长的主要气候限制因子不同,气候变暖对其生长的影响可能存在差异,但是该地区樟子松径向生长对气候变化的响应差异研究仍然缺乏。
本研究在大兴安岭天然樟子松林分布区的南、北端附近采样,利用树木年代学方法,研究了各地区樟子松年轮气候响应的一致性与差异性,明确了近几十年各地区樟子松生长量变化,探讨气候变化对不同地区树木生长的影响,以期丰富大兴安岭地区树木生长—气候关系的多样性研究,为气候变化背景下天然樟子松林的分类经营管理提供理论依据,并预测未来樟子松林的分布变化。
1 材料和方法
1.1 研究区概况
研究区(47°25′—53°11′N,119°30′—124°06′E)包括大兴安岭南部的海拉尔、阿尔山地区和北部的漠河、塔河地区(图1),属中温—寒温带大陆性季风气候,冬季漫长寒冷,夏季短暂湿热,7、8月份降水量占年降水量的46%—49%,1月气温最低,7月气温最高(图2)。大兴安岭南、北部气候条件及地形、土壤等环境状况均存在一定差别。南部属中温带半干旱气候,多年(1960—2013年)平均降水量为397mm,平均气温为-1.86℃,一年中平均温度在0℃以下的月份有5个。风沙区土壤质地以沙土为主。北部属寒温带半湿润地区,多年平均降水量为444mm,平均气温-3.6℃,平均温度在0℃以下的月份达7个。地形多低山丘陵,土壤以棕色针叶林土为主。

图1 研究区采样点和气象站Fig.1 Sample sites and meteorological stations in the study area
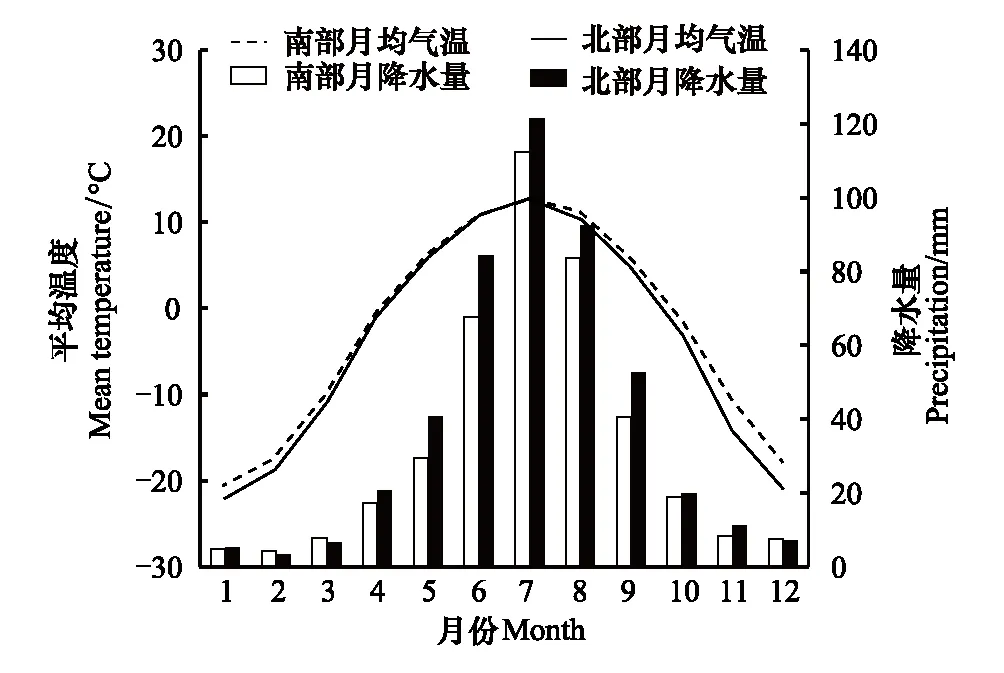
图2 研究区月平均温度和月降水量Fig.2 Monthly mean temperature and monthly precipitation in the study area
樟子松性喜光、耐寒、耐旱、耐贫瘠,多组成纯林。林内其他混生树种主要有兴安落叶松(Larixgmelinii)、白桦(Betulaplatyphylla)、山杨(Populusdavidiana)、榆树(Ulmuspumila)等。
1.2 样本采集和年表建立
采样点包括海拉尔(Hailar,HLZ)、阿尔山(Arxan,AEZ)、漠河(Mohe,MBZ)、塔河(Tahe,THZ)(图1)4个靠近天然樟子松林分布边缘的地区,在各点选择生长良好、年龄较大的樟子松,用生长锥在胸径处钻取树芯,每棵树取1—2个样芯。所得样芯经处理,打磨至可看到清晰年轮。先在显微镜下交叉定年,再用精度为0.001mm的Velmex年轮测量系统测出每轮的宽度,最后用COFECHA软件[20]对测量结果进行交叉定年检验,确保定年和测量准确。
利用ARSTAN程序[21]对所测轮宽序列进行去趋势[22]和标准化,去趋势方法采用线性函数或负指数,建立各点樟子松年轮宽度差值年表(Residual chronology,RES)。统计分析显示,MBZ与THZ(r=0.655)、HLZ与AEZ(r=0.434)差值年表之间都为极显著相关(P<0.01),但MBZ、THZ年表与HLZ、AEZ年表之间相关值较低,表明大兴安岭南、北部地区内樟子松生长都具有较强的一致性,但南、北部之间树木生长存在一定的差异性。基于单点之间强烈的共同信号以及南、北部环境条件的差异,我们将两个单点的年轮数据合并,建立南、北部两个区域年表。
从统计特征来看(表1),南、北部樟子松的平均树龄差别不大,但南部年表的平均敏感度大于北部。2个区域年表的平均敏感度、标准差、样本总体代表性都较好,适于进行年轮气候学分析。
1.3 气象资料
气象站资料来源于中国气象数据网(http://data.cma.cn/)。选用距离采样点较近的海拉尔、阿尔山、漠河、塔河气象站(图1)的月总降水量、月平均温度、月平均最低温、月平均最高温。海拉尔和阿尔山、漠河和塔河的气候因子在公共时段极显著相关(P<0.01),说明区域内气候变化较一致。将海拉尔与阿尔山、漠河与塔河气象站公共时段的气象数据分别进行算术平均以防止单个气象站造成随机误差。为便于南、北部的对比分析,选择1960—2013年的气象数据进行年轮—气候研究。
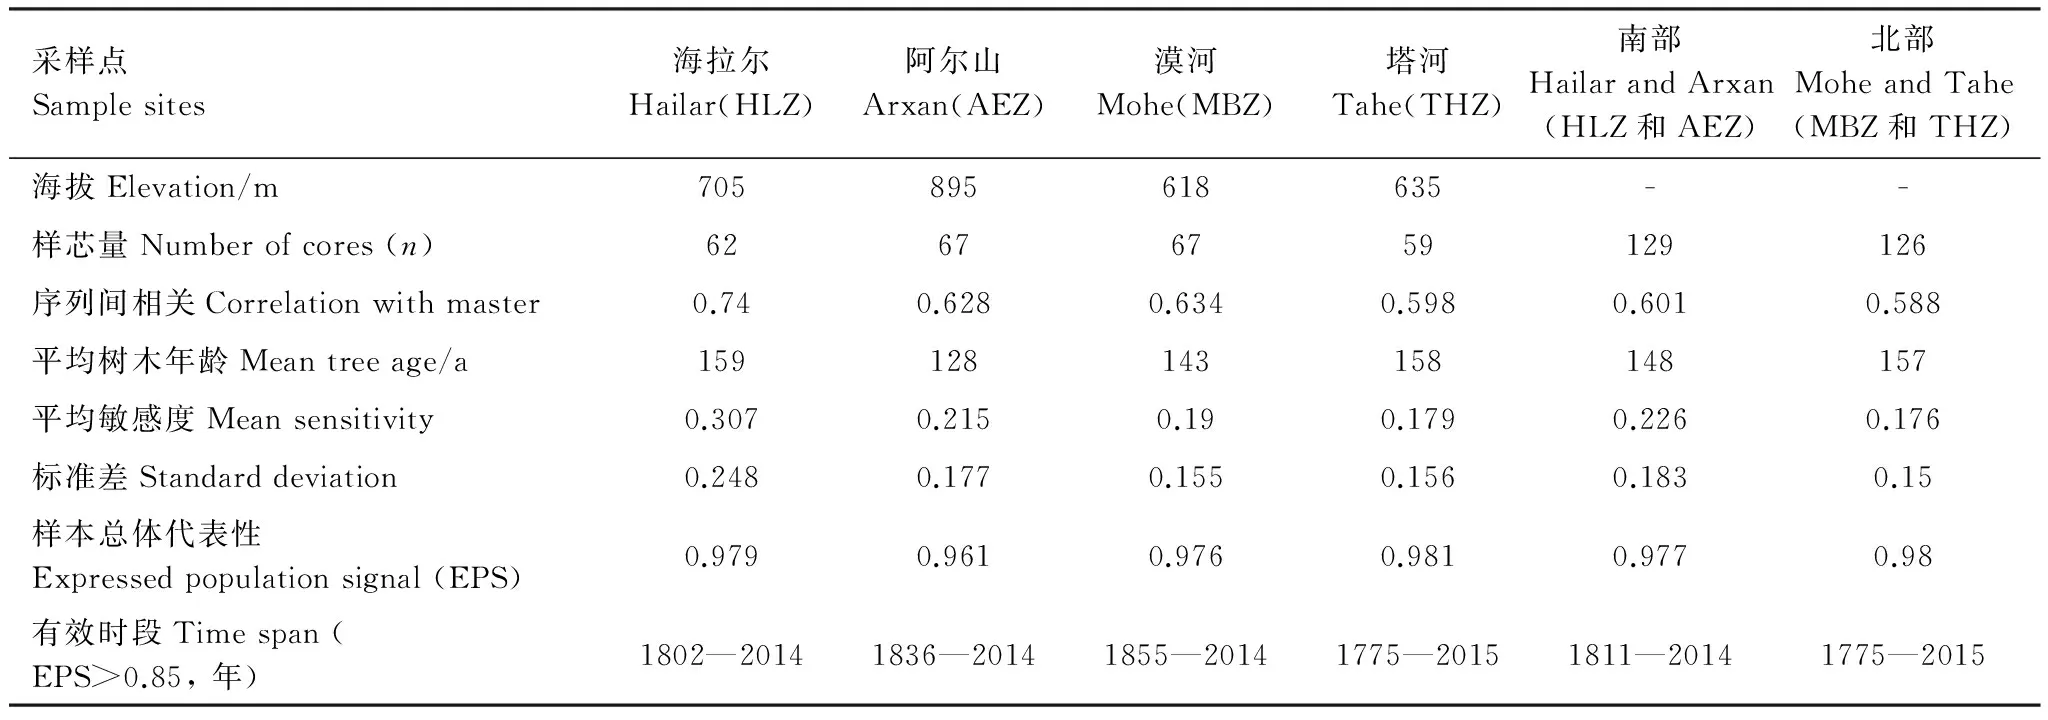
表1 采样点及其差值年表的统计量
格点数据下载于荷兰皇家气象研究所数据共享网(http://climexp.knmi.nl/)。南部(47°—50°N,119°—120°E)和北部(52°—54°N,122°—125°E)选择月最高温、月最低温及标准化降水蒸散指数SPEI(Standardized Precipitation Evapotranspiration Index)。SPEI指数是综合考虑了降水和温度等因素影响的干旱指标,是研究变暖背景下干旱化过程的重要工具[23]。
1.4 统计分析
用相关分析分析年表与气候因子之间的关系。利用原始测量序列估测樟子松胸高断面积增量(Basal area increment,BAI),并通过t检验方法检验南、北部BAI序列的差异性。为了直观比较BAI和气候因子的年际变化,使用均值为0,方差为1的Z标准化方法将数据标准化。
2 结果与分析
2.1 研究区气候变化
在1960—2013年,研究区明显变暖,年平均温度、平均最高温、平均最低温均呈极显著上升趋势(P<0.01),其中南部地区3项温度因子的气候倾向率分别为0.34、0.24、0.52℃/10a,北部分别为0.44、0.52、0.36℃/10a。南部年降水量在1960—2012年缓慢减少,倾向率为-1.07mm/10a,在2013年出现异常最大值634.5mm,远超其平均水平。北部年降水量显著上升(14.63mm/10a,P<0.05)。
2.2 年表与气候因子的相关关系及动态变化
南部年轮宽度变化与当年5、6、7月的降水量显著正相关(P<0.05),与当年6月的平均气温和最高温极显著负相关(P<0.01),与当年7月的平均最高温显著负相关(P<0.05),与当年5月的SPEI显著正相关(P<0.05),与当年6、7月的SPEI极显著正相关(P<0.01)(图3)。气候因素对樟子松生长的影响主要集中在当年4—9月(图3)。由于多个月份组合对树木生长的影响比单个月份更有气候代表性[19],本研究将当年4—9月的总降水量、平均温度、平均最高温、平均最低温及平均SPEI与年轮宽度作相关分析。结果显示,年轮宽度与当年4—9月的平均SPEI(r=0.639)、降水量(r=0.566)及平均最高温(r= -0.411)极显著相关(P<0.01),说明当年4—9月的水分状况制约了该地区樟子松径向生长。
北部年轮宽度与当年5、6月的降水量显著正相关(P<0.05),与当年8月的平均温度极显著正相关(P<0.01),与当年6月的平均最高温显著负相关(P<0.05),与当年4、8月的平均最低温显著正相关(P<0.05),与当年5月的SPEI显著正相关(P<0.05)(图3)。与组合月份的相关分析表明,年轮宽度与当年4—9月的平均最低温(r=0.488)、平均SPEI (r=0.421)及降水量(r=0.376)极显著相关(P<0.01),该地区树木生长受当年4—9月平均最低温影响最大。
南、北部樟子松对降水、SPEI的响应基本一致,均与当年4—9月的总降水量、平均SPEI显著正相关,但南部对降水和SPEI的响应强于北部(图3)。两个区域樟子松对气候的响应不同主要体现在当年4—9月各月温度上,除6月平均气温及最高温较一致外,其他月份对温度的响应存在较大差异(图3)。在温度因子中,南部主要与当年4—9月的平均最高温极显著负相关,而北部主要与同时段的平均最低温极显著正相关(P<0.01)。
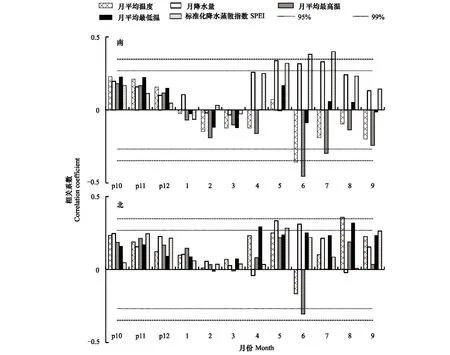
图3 大兴安岭南、北部差值年表与气候因子的Pearson相关Fig.3 Pearson correlation of RES chronology with climate factors in southern and northern Great Xing′an Mountainsp表示“前一年”
为了研究樟子松对主要温度因子的响应随时间的变化,用格点数据作步长31年的滑动相关。结果表明,南部年轮宽度与当年4—9月平均最高温的相关系数随时间呈“中间高两头低”的变化趋势,与平均最高温变化趋势相反。1954年之后,随着平均最高温的升高,负相关性明显增强(图4),大部分年份都达到显著水平(P<0.05)。北部年轮宽度与当年4—9月平均最低温主要为正相关,相关系数与最低温的变化趋势一致。在1957年后,随着平均最低温的升高,相关性基本都达到显著水平(P<0.05,图4)。
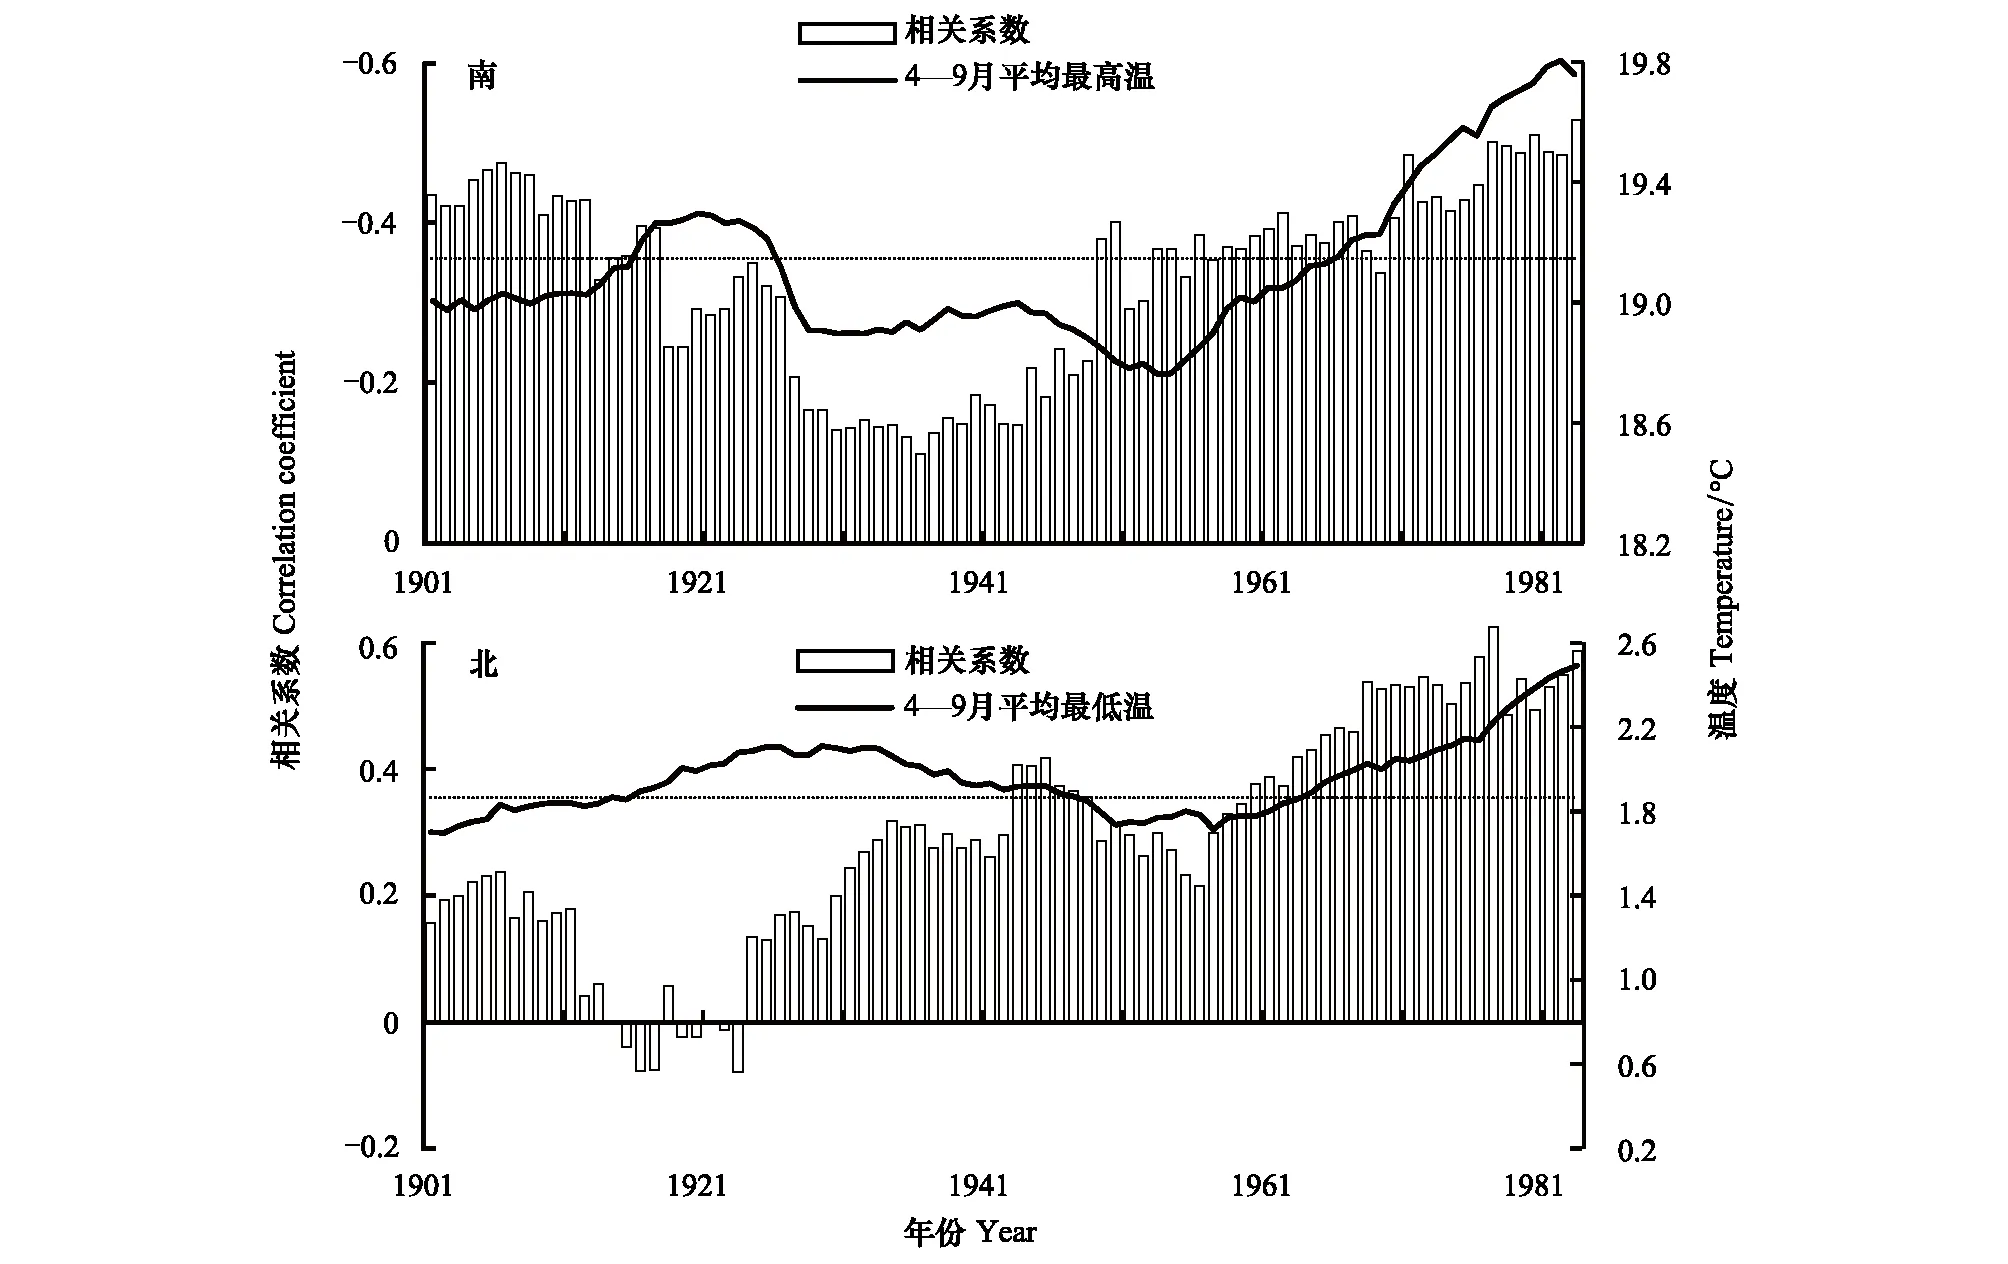
图4 南、北部差值年表与温度的滑动相关Fig.4 Moving correlation of RES chronology with temperature in the southern and northern area虚线表示相关性达到显著水平(P<0.05),横坐标表示滑动窗口的起始年
2.3 樟子松生长量变化及其与气候变化的关系
t检验结果显示,1960—2013年南部樟子松平均BAI为24.4cm2/a,北部为5.29cm2/a,南北部生长量变化显著不同(P<0.001)。大兴安岭地区樟子松存在两种不同的生长模式,南部樟子松生长量远大于北部(图5a),而且近54年来生长量变化趋势也明显不同(图5b)。南部BAI从1960年的31.68cm2降低为2013年的25.34cm2,下降了20%。北部BAI从1960年的5.87cm2提高至2013年的9.37cm2,增加了59.6%。线性回归结果表明,南部樟子松BAI呈极显著下降趋势(r=0.612,P<0.001),年均下降值达到0.253cm2,北部呈极显著上升趋势(r=0.474,P<0.001),年均增加值为0.039cm2。

图5 樟子松BAI序列、其11年滑动平均(a)及近54年的变化趋势(b)Fig.5 P. sylvestris var. mongolica basal area increment series with their 11-year moving average(a)and their trends in the past 54 years(b)
1960年以后,大部分采样树木(树龄在50—100年)都达到成熟(表1),而且离自然衰老还很远,因此过去54年樟子松生长量是受气候因素影响。近半个世纪来南部4—9月的降水量变化平稳,但平均最高温显著上升(r=0.612,P<0.01),干旱程度加剧。平均最高温与BAI的年际变化几乎完全相反,平均最高温的峰值往往对应着BAI的谷值,降水量与BAI的年际变化一致(图6)。相关分析表明,BAI与当年4—9月的平均最高温极显著负相关(r= -0.681,P<0.01),与降水量为极显著正相关,但相关系数只有0.454。北部地区近54年来4—9月的降水量增加,平均最低温上升,湿润程度有所增加,但都未达到显著水平。BAI、降水量及平均最低温的变化趋势相同。BAI和平均最低温的年际变化也基本一致,多数峰值和谷值都能对应(图6)。同时,BAI与当年4—9月的降水量显著相关(r=0.31,P<0.01)。

图6 南、北部标准化BAI和气候因子指数的动态变化Fig.6 Dynamic changes of standardized index of BAI and climate factors in the southern and northern area
3 讨论
3.1 树木径向生长对气候因子的响应
大兴安岭地区4—9月是树木生长的关键时期,树木在4月末孕育萌芽,在9月底停止生长[19]。南、北部樟子松对降水、SPEI的响应基本一致,均与该时期的总降水量、平均SPEI显著正相关,水分增加有利于树木生长[14, 24]。南部属于半干旱地区,生长季光照充足,树木生理活动所需热量得到满足,可利用水分的多少就成为限制树木生长的主要因素[25]。而北部属于寒温带半湿润区,降水量比南部多,温度比南部低,所以该地区樟子松对水分的敏感度比南部低。
南部樟子松年轮宽度与生长季温度之间以负相关为主,尤其是月平均最高温的升高不利于樟子松生长(图3)。干旱地区最高温的升高会加快土壤蒸发和植物蒸腾,导致水分胁迫加剧,不利于植物生长[24]。北部樟子松生长主要受多个月份平均最低温影响(图3),该地区属寒温带半湿润区,生长季常发低温冷害[26],植物生长所需的热量条件不足,因此最低温是樟子松生长的限制因子,其限制了树木的光合、呼吸作用以及茎的生长等生理过程[27]。最低温的升高使形成层活动提前[28],也促进了木质部发生[29],所以4—9月平均最低温与树木生长显著正相关。树线地区树木对温度的响应相反现象普遍存在[11,30],当温度超过树木的生理阈值,呼吸作用增强,光合速率下降,对树木生长产生负面影响[31]。南部4—9月温度和北部6月平均最高温可能超过了阈值,再加上樟子松本身不耐高温[32],因此生长受限。
近半个世纪的升温对南部树木生长不利,对北部树木生长有利(图4)。而且无论在南部半干旱地区还是在北部半湿润地区,樟子松生长对温度的敏感性均在增强,这与中国青海云杉[3]、兴安落叶松[33]及欧洲挪威云杉(Piceaasperata)[34]等的研究结果一致。
3.2 树木生长量变化及气候驱动因子
近54年来,接近分布区南界的樟子松生长量明显降低,生长衰退(图5)。该地区属半干旱区,水分成为树木生长的主要限制因子,而水分状况又受到降水、温度等因素的影响。近半个世纪来4—9月的降水量变化较平稳,同期4—9月平均最高温明显上升,高温引起干旱加剧,土壤水分蒸发和植物蒸腾作用加强,土壤和植物体内可利用水分减少[35-36],造成细胞分裂停止时间提前及细胞的径向宽度变窄[37]。平均最高温与生长量的高频(年际)变化基本对称(图6),变化趋势相反,而且生长量与平均最高温的相关性远高于降水,所以升温导致的水分胁迫是该地区樟子松生长量下降的主要原因,气候变暖不利于该地区树木生长。近几十年来,升温引起的干旱也导致其他水分限制地区树木生长出现了明显的下降趋势[35,38]甚至引起一些地区的森林死亡[8]。此外,碳获取不足也可能导致树木生长量下降[39-40]。
而北部樟子松生长量显著增加,生长趋好(图5)。BAI、4—9月平均最低温及降水量变化均呈上升趋势,BAI与平均最低温的年际变化也基本相同(图6)。生长季初期4月温度的升高加快了冰雪融化,为树木生长提供了水分条件[1]。最低温升高也使树木开始活动时间提前,延长了生长期,有利于生物量积累[4,41-42]。在非水分限制地区(寒冷湿润地区),气候变暖对森林生产力有促进作用[43]。近54年来4—9月降水量缓慢增加,在土壤水分相对充足的条件下,生长季最低温的上升会促进树木生长[44],所以樟子松生长量增加与最低温上升密切相关。同时该地区樟子松生长量增加与4—9月降水量显著正相关,可能是因为降水量增加可以满足升温引起的水分需求,提高光合作用效率。因此北部樟子松生长量增加是受到4—9月平均最低温和降水量的耦合作用。
近几十年,大兴安岭南、北部樟子松生长量变化趋势相反。气候变暖限制了天然分布区南端樟子松生长,促进了北部樟子松生长。因此,如果未来气候持续变暖,樟子松天然林分布区可能北移,这与东北地区森林的模型模拟结果一致[45]。
[1] Vila B, Vennetier M, Ripert C, Chandioux O, Liang E Y, Guibal F, Torre F.Has global change induced divergent trends in radial growth ofPinussylvestrisandPinushalepensisat their bioclimatic limit? The example of the Sainte-Baume forest (south-east France). Annals of Forest Science, 2008, 65(7): 709- 709.
[2] Martín-Benito D, Del Río M, Caellas I. Black pine (PinusnigraArn.) growth divergence along a latitudinal gradient in Western Mediterranean mountains. Annals of Forest Science, 2010, 67(4): 401- 401.
[3] Zhang Y X, Wilmking M. Divergent growth responses and increasing temperature limitation of Qinghai spruce growth along an elevation gradient at the northeast Tibet Plateau. Forest Ecology and Management, 2010, 260(6): 1076- 1082.
[4] Yu D P, Liu J Q, Lewis B J, Zhou L, Zhou W M, Fang X M, Wei Y W, Jiang S W, Dai L M. Spatial variation and temporal instability in the climate-growth relationship of Korean pine in the Changbai Mountain region of Northeast China. Forest Ecology and Management, 2013, 300: 96- 105.
[5] Jiang Y, Zhang W T, Wang M C, Kang M Y, Dong M Y. Radial growth of two dominant montane conifer tree species in response to climate change in North-Central China. PLos One, 2014, 9(11): e112537.
[6] Dass P, Rawlins M A, Kimball J S, Kim Y. Environmental controls on the increasing GPP of terrestrial vegetation across northern Eurasia. Biogeosciences, 2016, 13: 45-62.
[7] Zhou L M, Tucker C J, Kaufmann R K, Slayback D, Shabanov N V, Myneni R B. Variations in northern vegetation activity inferred from satellite data of vegetation index during 1981 to 1999. Journal of Geophysical Research Atmospheres, 2001, 106(D17): 20069- 20083.
[8] Liu H Y, Williams A P, Allen C D, Guo D L, Wu X C, Anenkhonov O A, Liang E Y, Sandanov D V, Yin Y, Qi Z H, Badmaeva N K. Rapid warming accelerates tree growth decline in semi-arid forests of Inner Asia. Global Change Biology, 2013, 19(8): 2500- 2510.
[9] Liang E Y, Leuschner C, Dulamsuren C, Wagner B, Hauck M. Global warming-related tree growth decline and mortality on the north-eastern Tibetan plateau. Climatic Change, 2016, 134(1/2): 163- 176.
[10] Verbyla D. The greening and browning of Alaska based on 1982- 2003 satellite data. Global Ecology and Biogeography, 2008, 17(4): 547- 555.
[11] Wilmking M, Juday G P, Barber V A, Zald H S J. Recent climate warming forces contrasting growth responses of white spruce at treeline in Alaska through temperature thresholds. Global Change Biology, 2004, 10(10): 1724- 1736.
[12] Pisaric M F J, Carey S K, Kokelj S V, Youngblut D. Anomalous 20th century tree growth, Mackenzie Delta, Northwest Territories, Canada. Geophysical Research Letters, 2007, 34(5): L05714.
[13] 朱教君, 曾德慧, 康宏樟, 吴祥云, 范志平. 沙地樟子松人工林衰退机制. 北京: 中国林业出版社, 2005.
[14] Chen Z J, Zhang X L, Cui M X, He X Y, Ding W H, Peng J J. Tree-ring based precipitation reconstruction for the forest-steppe ecotone in northern Inner Mongolia, China and its linkages to the Pacific Ocean variability. Global and Planetary Change, 2012, 86- 87: 45- 56.
[15] Liu Y, Bao G, Song H M, Cai Q F, Sun J Y. Precipitation reconstruction from Hailar pine (Pinussylvestrisvar.mongolica) tree rings in the Hailar region, Inner Mongolia, China back to 1865AD. Palaeogeography, Palaeoclimatology, Palaeoecology, 2009, 282(1/4): 81- 87.
[16] 王晓春, 宋来萍, 张远东. 大兴安岭北部樟子松树木生长与气候因子的关系. 植物生态学报, 2011, 35(3): 294- 302.
[17] Zhang T W, Yuan Y J, Wei W S, Yu S L, Zhang R B, Shang H M, Chen F, Fan Z A, Qin L. Tree-ring-based temperature reconstruction for the northern Greater Higgnan Mountains, China, since A. D. 1717. International Journal of Climatology, 2013, 33(2): 422- 429.
[18] 李露露, 李丽光, 陈振举, 周永斌, 张先亮, 白学平, 常永兴, 肖建强. 辽宁省人工林樟子松径向生长对水热梯度变化的响应. 生态学报, 2015, 35(13): 4508- 4517.
[19] 张先亮, 何兴元, 陈振举, 崔明星, 黎娜. 大兴安岭山地樟子松径向生长对气候变暖的响应——以满归地区为例. 应用生态学报, 2011, 22(12): 3101- 3108.
[20] Holmes R L. Computer-assisted quality control in Tree-ring dating and measurement. Tree-Ring Bulletin, 1983, 43: 51- 67.
[21] Cook E R, Holmes R L. Users Manual for Program AR-STAN. Tucson, USA: Laboratory of Tree-Ring Research, University of Arizona, 1986.
[22] Fritts H C. Tree Rings and Climate. London: Academic Press, 1976.
[23] 苏宏新, 李广起. 基于SPEI的北京低频干旱与气候指数关系. 生态学报, 2012, 32(17): 5467- 5475.
[24] 尚建勋, 时忠杰, 高吉喜, 徐丽宏, 吕世海, 冯朝阳, 王鲁秀. 呼伦贝尔沙地樟子松年轮生长对气候变化的响应. 生态学报, 2012, 32(4): 1077- 1084.
[25] Liang E Y, Shao X M, Eckstein D, Liu X H. Spatial variability of tree growth along a latitudinal transect in the Qilian Mountains, northeastern Tibetan Plateau. Canadian Journal of Forest Research, 2010, 40(2): 200- 211.
[26] 温克刚, 孙永罡. 中国气象灾害大典: 黑龙江卷. 北京: 气象出版社, 2007.
[27] Liang E Y, Wang Y F, Xu Y, Liu B, Shao X M. Growth variation inAbiesgeorgeivar.smithiialong altitudinal gradients in the Sygera Mountains, southeastern Tibetan Plateau. Trees, 2010, 24(2): 363- 373.
[28] 郭媛媛, 江源. 环境因子对树木形成层活动及木质部发生影响的研究进展. 北京师范大学学报: 自然科学版, 2015, 51(6): 613- 619.
[29] Swidrak I, Gruber A, Kofler W, Oberhuber W. Effects of environmental conditions on onset of xylem growth inPinussylvestrisunder drought. Tree Physiology, 2011, 31(5): 483- 493.
[30] Jiao L, Jiang Y, Zhang W T, Wang M C, Zhang L N, Zhao S D. Divergent responses to climate factors in the radial growth ofLarixsibiricain the eastern Tianshan Mountains, northwest China. Trees, 2015, 29(6): 1673- 1686.
[31] D′Arrigo R D, Kaufmann R K, Davi N, Jacoby G C, Laskowski C, Myneni R B, Cherubini P. Thresholds for warming-induced growth decline at elevational tree line in the Yukon Territory, Canada. Global Biogeochemical Cycles, 2004, 18(3): GB3021.
[32] Pichler P, Oberhuber W. Radial growth response of coniferous forest trees in an inner Alpine environment to heat-wave in 2003. Forest Ecology and Management, 2007, 242(2/3): 688- 699.
[33] Zhang X L, Bai X P, Chang Y X, Chen Z J. Increased sensitivity of Dahurian larch radial growth to summer temperature with the rapid warming in Northeast China. Trees, 2016, 30(5): 1799- 1806.
[34] Ponocná T, Spyt B, Kaczka R, Büntgen U, Treml V. Growth trends and climate responses of Norway spruce along elevational gradients in East-Central Europe. Trees, 2016, 30(5): 1633- 1646.
[35] Schuster R, Oberhuber W. Drought sensitivity of three co-occurring conifers within a dry inner Alpine environment. Trees, 2013, 27(1): 61- 69.
[36] Oberhuber W, Kofler W, Schuster R, Wieser G. Environmental effects on stem water deficit in co-occurring conifers exposed to soil dryness. International Journal of Biometeorology, 2015, 59(4): 417- 426.
[37] Gruber A, Strobl S, Veit B, Oberhuber W. Impact of drought on the temporal dynamics of wood formation inPinussylvestris. Tree Physiology, 2010, 30(4): 490- 501.
[38] Buermann W, Parida B, Jung M, Macdonald G M, Tucker C J, Reichstein M. Recent shift in Eurasian boreal forest greening response may be associated with warmer and drier summers. Geophysical Research Letters, 2014, 41(6): 1995- 2002.
[39] Mencuccini M, Martínez-Vilalta J, Vanderklein D, Hamid H A, Korakaki E, Lee S, Michiels B. Size-mediated ageing reduces vigour in trees. Ecology Letters, 2005, 8(11): 1183- 1190.
[40] Bond-Lamberty B, Wang C K, Gower S T. Net primary production and net ecosystem production of a boreal black spruce wildfire chronosequence. Global Change Biology, 2004, 10(4): 473- 487.
[41] 何吉成, 王丽丽, 邵雪梅. 漠河樟子松树轮指数与标准化植被指数的关系研究. 第四纪研究, 2005, 25(2): 252- 257.
[42] Gruber A, Wieser G, Oberhuber W. Intra-annual dynamics of stem CO2efflux in relation to cambial activity and xylem development inPinuscembra. Tree Physiology, 2009, 29(5): 641- 649.
[43] Boisvenue C, Running S W. Impacts of climate change on natural forest productivity - evidence since the middle of the 20th century. Global Change Biology, 2006, 12(5): 862- 882.
[44] 李广起, 白帆, 桑卫国. 长白山红松和鱼鳞云杉在分布上限的径向生长对气候变暖的不同响应. 植物生态学报, 2011, 35(5): 500- 511.
[45] 晏寒冰, 彭丽潭, 唐旭清. 基于气候变化的东北地区森林树种分布预测建模与影响分析. 林业科学, 2014, 50(5): 132- 139.
DifferentresponsesofnaturalPinussylvestrisvar.mongolicagrowthtoclimatechangeinsouthernandnorthernforestedareasintheGreatXing′anMountains
LI Junxia1, BAI Xueping1, ZHANG Xianliang1, CHANG Yongxing1, LU Xu1, ZHAO Xuepeng1, CHEN Zhenju1,2, *
1ShenyangAgriculturalUniversity,Shenyang110866,China2ResearchStationofLiaohe-RiverPlainForestEcosystem,ChineseForestEcosystemResearchNetwork,Changtu112500,China
ThePinussylvestrisvar.mongolicanatural forest is mainly distributed in the Great Xing′an Mountains. To investigate different responses of radial growth ofP.sylvestrisvar.mongolicato climate change in the southern and northern regions, we collected tree-ring samples from the southern and northern edges of the natural distribution of the forest. Tree-ring width residual chronology (RES) was developed using dendrochronological methods for each region. The relationship between tree-ring width and climate factors, including monthly mean temperature, monthly mean maximum temperature, monthly mean minimum temperature, monthly precipitation, and standardized precipitation evapotranspiration index (SPEI) from the previous October to September of the current year was analyzed by correlation analysis during the study period (1960—2013). The results indicated that tree-ring width was significantly positively correlated (r=0.639,P<0.01) with average SPEI in April-September in the southern region (Arxan and Hailar), whereas it was significantly positively correlated (r=0.488,P<0.01) with mean minimum temperature during the same period in the northern region (Mohe and Tahe). The southern trees suffered from water stress, whereas the northern trees suffered from low temperature stress. Thus, the southern tree radial growth was mainly limited by moisture from April to September, but northern tree growth was affected by the monthly mean minimum temperature of the same period. Radial growth exhibited consistently positive responses to precipitation, but the response was opposite for temperature from April to September (except June) in the two regions. Tree-ring width was basically negatively correlated with temperature in the southern area, and it was mainly positively correlated in the northern area. As temperature increased significantly in recent decades (P<0.01), the sensitivity of radial growth ofP.sylvestrisvar.mongolicato mean temperature during April to September increased, and tree radial growth showed an increasingly negative response to the mean maximum temperature from April to September in the southern region and an increasingly positive response to the mean minimum temperature in the northern region at 31-year intervals. In addition, temporal changes in growth patterns differed between the two regions over the past 54 years. Radial growth declined rapidly in the southern region (r=0.612,P<0.001), whereas it increased significantly in the northern region (r=0.474,P<0.001). The fitted linear regression showed that the rate of decline in basal area increment (BAI) was 0.253cm2/a in the southern area, and the rate of increase was 0.039cm2/a in the northern area. Further study determined that mean maximum temperature for April to September contributed most to southern tree growth variability from 1960 to 2013 (r= -0.681,P<0.01). Hence, increasing drought stress caused by high temperature was the main reason for growth decline in the southern area. The northern BAI series tracked the standardized mean minimum temperature and precipitation series for April to September well. Rising minimum temperature benefited cambial cell activity and prolonged the tree grow period at high latitudes, and thus, increasing growth of northern trees was affected by both mean minimum temperature and precipitation. The warming climate restrains southern tree growth but promotes northern radial growth. If the warming is sustained, the distribution area ofP.sylvestrisvar.mongolicamay move northward in the future.
Great Xing′an Mountains; climate change;Pinussylvestrisvar.mongolica; radial growth; different response
国家自然科学基金项目(41271066, 31570632, 41601045, 41571094)
2016- 08- 13; < class="emphasis_bold">网络出版日期
日期:2017- 07- 11
*通讯作者Corresponding author.E-mail: zhenjuchen@ hotmail.com
10.5846/stxb201608131660
李俊霞,白学平,张先亮,常永兴,陆旭,赵学鹏,陈振举.大兴安岭林区南、北部天然樟子松生长对气候变化的响应差异.生态学报,2017,37(21):7232- 7241.
Li J X, Bai X P, Zhang X L, Chang Y X, Lu X, Zhao X P, Chen Z J.Different responses of naturalPinussylvestrisvar.mongolicagrowth to climate change in southern and northern forested areas in the Great Xing′an Mountains.Acta Ecologica Sinica,2017,37(21):7232- 7241.
