Experimental and theoretical study of coupled in fluence of flow velocity increment and particle size on particle retention and release in porous media
2017-11-20XingxinChenQipengCaiZhonghanWu
Xing-xin Chen*,Qi-peng Cai,Zhong-han Wu
aSchool of Transportation,Southeast University,Nanjing 210096,China bSchool of Civil Engineering,Huaqiao University,Xiamen 361021,China cSchool of Civil Engineering,Beijing Jiaotong University,Beijing 100044,China
Received 13 October 2016;accepted 17 April 2017 Available online 20 October 2017
Experimental and theoretical study of coupled in fluence of flow velocity increment and particle size on particle retention and release in porous media
Xing-xin Chena,b,*,Qi-peng Caib,Zhong-han Wuc
aSchool of Transportation,Southeast University,Nanjing 210096,ChinabSchool of Civil Engineering,Huaqiao University,Xiamen 361021,ChinacSchool of Civil Engineering,Beijing Jiaotong University,Beijing 100044,China
Received 13 October 2016;accepted 17 April 2017 Available online 20 October 2017
Experimental and theoretical studies were carried out to investigate the coupled in fluence of flow velocity increment and particle size on the retention and release of particles in porous media.Particle release was examined through measurement of changes in ef fluent particle concentrations,and particle retention was assessed through measurement of the final spatial distribution of particles remaining in the soil columns after the experiments.Particle release curves were simulated using a convection-dispersion model that includes the instantaneous release of the line source.Fitted model parameters were used to gain insights into the mechanisms that control particle retention and release.When the flow velocity increment was 0.0435cm/s,the peak concentration of particles decreased with increasing flow velocity until the latter approached a critical level,beyond which the particle concentration increased.Particle wedging and fouling were considered the primary mechanisms that controlled particle retention and release beyond the critical particle velocity.In experiments with large flow velocity increments,small particles exhibited lower particle mass fraction than large particles as particle wedging and fouling increased with particle size.The range of longitudinal dispersivity decreased with an increasing particle size and flow velocity increment.Moreover,the mean particle velocity increased with the mean interstitial fluid velocity.The mean particle velocity pro file was highly sensitive to the particle size at low velocity increments.In general,particle release rates increased with both flow velocity and velocity increment.The mass of the released particles provides further evidence that particle wedging and fouling are the major factors that control particle release in sand columns.
©2017 Hohai University.Production and hosting by Elsevier B.V.This is an open access article under the CC BY-NC-ND license(http://creativecommons.org/licenses/by-nc-nd/4.0/).
Particle;Porous media;Retention;Release;Hydrodynamic force
1.Introduction
The retention and release of particles in porous media have profound effects on many important processes occurring in thesubsurface zone.These processes affect clogging,structural changesof subsurfaceporousmedia,particle-facilitated transport of contaminants,and soil formation(Reddi et al.,2000;Tomlinson and Vaid,2000;Blume et al.,2002;Sen and Khilar,2006;Natarajan and Kumar,2011;Bradford et al.,2013,2014;Pazmino et al.,2014;Engstr¨om et al.,2015;Sasidharan et al.,2016).For example,contaminants are transported into the subsurface zone directly by dissolution in the fluid phase or indirectly by association with the particle surfaces(Grolimund et al.,1996;Karathanasis,1999;Missana et al.,2008;Bradford et al.,2013).Soil permeability can be either decreased by clogging of pore necks with fine particles,or increased by the washing out of the fine particles that leads to widening of the pore size(Blume et al.,2002).Furthermore,the transport of contaminants associated with particles is either facilitated or retarded by the mobile particles(Blume et al.,2002;Sen and Khilar,2006;Bradford et al.,2013).
To explain how particle retention and release contribute to contaminant transport in porous media,we first of all need to understand the mechanisms of particle transport and deposition.Mechanisms of particle retention and release in porous media involve wedging,straining,fouling,and attachment to solid surfaces(Sen and Khilar,2006;Torkzaban et al.,2008;Bradford et al.,2013;Raychoudhury et al.,2014).The ratio of the particle size to pore constriction size is important in particle plugging.When the particle size is close to the constriction size,single particle plugging occurs.When the ratio of the particle size to constriction size is between 0.01 and 0.1,there will be a possibility of multi-particle blocking(Sen and Khilar,2006).Bradford et al.(2002)found that straining is related with the size distributions of particles and pores.When the particle size is much smaller than the pore size,the straining effect on particle retention is very weak,and the effect of adsorption is strong.Porubcan and Xu(2011)found that the straining effect of particles increases with the increasing content of fine sand in heterogeneous media.Xu et al.(2006)con firmed the effects of particle size and sand size on the straining effect,and found that the critical value of the ratio of the particle size to sand size was about 0.008.
Furthermore,particle retention and release in porous media are dominated by a combination of forces,including gravitational force,lift force,buoyancy force,hydrodynamic force,London-van der Waals interaction,and electrical double-layer interaction(Tripathy,2010).The surface interaction force acts in a direction normal to the surface and helps the particle to remain attached to the surface of the porous media.The drag force acts on a particle in the presence of relative motion between the particle and fluid(Tripathy,2010).Particle release is initiated by scrolling through the collector surface under favorable deposition conditions,which are caused by destabilizations in chemical and flow conditions(Sharma et al.,1992;Bergendahl and Grasso,2000;Sasidharan et al.,2014).However,the deposition rate coef ficients decrease,and the release rate increases with an increasing flow velocity under unfavorable deposition conditions,which suggests that hydrodynamic drag can initiate release under unfavorable conditions(Li et al.,2005).
In natural subsurface flows,where flow velocities are generally low,particle release is more likely to be initiated by changes in soil solution chemistry(Blume et al.,2005;Grolimund and Borkovec,2006;Pazmino et al.,2014;Sasidharan et al.,2014;Torkzaban et al.,2015).Solution chemistry has been extensively examined,with particular emphasis on pH,organic matter,cation valence,ionic strength,aging,and surfactants(Blume et al.,2005;Grolimund and Borkovec,2006).At the same time,a few studies have reported that the hydrodynamic force affects particle retention and release(Sen and Khilar,2006;Chen et al.,2014;Engstr¨om et al.,2015).The hydrodynamic force in fluences low- flow and flow-stagnation zones,where the particles can be trapped.High flow velocities have been shown to increase hydraulic shear stress that can remove particles associated with the medium surface(Ochi and Vernoux,1998;Torkzaban et al.,2008;Sang et al.,2013).This phenomenon has been studied at the scope of bioremediation strategies in subsurface environments,water resources protection,nuclear waste disposal,improvement of oil recovery from the subsurface,arti ficial recharge,deep bed filtration,and grouting reinforcement(Thomas and Ward,1989;Blume et al.,2005;Saada et al.,2005;Sen and Khilar,2006;Van Beek et al.,2010;Natarajan and Kumar,2011;Bradford et al.,2013).
In this study,we explored the coupled roles of increasing hydrodynamic force and increasing particle size on particle retention and release in the saturated porous media.The behavior of two groups of particle size was examined in two series of column experiments with different flow velocity increments.Particle release was evaluated by measuring temporal changes in particle ef fluent concentrations,and particle retention was assessed by measuring the final spatial distribution of the particles remaining in the soil column after the experiment.The particle release curves were simulated using a convection-dispersion model that includes an instantaneous release of the line source.Fitted model parameters were employed to gain insights into the intrinsic mechanisms controlling particle retention and release in the porous media.
2.Materials and methods
Crushed quartz sand was employed as the porous media in the column experiments.Quartz sand was selected for a particle size range of 1.0-3.5 mm to prevent the large fouling that may reduce the permeability.The coef ficient of curvature,Cc,and uniformity index,Cu,are as follows:

where d10is the particle size corresponding to the value of 10%in the cumulative particle size distribution curve,d30is the particle size corresponding to the value of 30%in the cumulative particle size distribution curve,and d60is the particle size corresponding to the value of 60%in the cumulative particle size distribution curve.
For the selected sand particle size range,the coef ficient of curvature and uniformity index were 1.09 and 1.44,respectively.Bulkdensity(1.51 g/cm3)wasachievedbymeasuringthe quantity and volume of sand.The speci fic density was achieved byputtingdeionizedwaterintoa fixedmassofsand,andithada value of 2.65 g/cm3.The porosity of the porous media was 44.6%.The average hydraulic conductivity(K)of the sand was 2.32×10⁻²m/s.Priortoexperiments,thesandwastreatedwith diluted H2SO4to remove any possible contaminants,cleaned with deionized water,and then dried at 105°C.
Two kinds of synthetic spherical SiO2particles were employed as retained particles.According to the particle size analysis using a Mastersizer 2000E,the median diameters(D50)of the two kinds of SiO2particles were 3.40 and 5.10 μm.Properties of the synthetic SiO2particles are listed in Table 1.
Plexiglas soil columns of 30 cm in length and 7cm in diameter were used in the particle retention and release experiments.These columns were provided with Plexiglas screens and stand fittings at both ends.Plexiglas screens(with 1 mm mesh spacing)can equally scatter flow at the end of soil columns.Column tubing, fittings,screens,and O-rings were made of chemical-resistant materials such as Plexiglas,silicone,and stainless steel.Prior to experiments,clean and dry quartz sand,employed as the porous media,was saturated until the surface was wet.Subsequently,the SiO2particles and sand were blended at a ratio of 1:1000.The soil column was filled with multiple layers of 3-cm sand and SiO2particle mixture,and then shaken to reduce any layering and settling,to remove any captured air,and to mimic uniform density.The water level was kept over the sand surface to resemble the saturated conditions in the sand.After these procedures,the initial particle-to-sand mass ratio was 1:1000 in all sand columns.Based on the measured speci fic density and soil bulk density,the porosity of the soil column was estimated to be 0.439.
Fig.1 is a schematic representation of the employed experimental arrangement.A peristaltic pump(LongerPump-BT600-2J,China)was used to push deionized water upward through the columns.The flow velocity(U)was counted by the flow meter in Fig.1,and the upward flow minimized the uneven flow across the transverse section of the column.Through control of the pump or flow meter,two series of experiments with flow velocity increments (ΔU) of 0.0435 cm/s and 0.0870 cm/s,respectively,were performed.These flow velocities surpass natural flow in aquifers,but are typical for forced flows such as grouting reinforcement,artifi cial recharge,and improvement of oil recovery from the subsurface.Prior to experiments in both series,the soil columns were flushed with deionized water to eliminate any suspended or weak deposited particles from the sand column during the initial flow at a velocity of 0.0870 cm/s until the turbidity value in the ef fluent was close to 0.24 NTU(approaching the turbidity value for deionized water).The experiments with increased flow velocity were then initiated.All the experiments were run for both sizes of the synthetic SiO2particles.
In series 1,experiments were carried out with a flow velocity increment of 0.0435 cm/s,and corresponding flowvelocities of 0.1305,0.1740,0.2175,and 0.2610 cm/s.In the course of each experiment,ef fluent samples were gathered in 20-mL glass vials,and the turbidity value of the sample was measured three times with an HACH turbidity meter(HACH Co.,USA)to obtain the mean value.The experiment was maintained until the mean turbidity of the ef fluent reached 0.24 NTU,and then the next experiment with a larger flow velocity was initiated.Particle concentrations were determined from the correlation between the turbidity and concentration:

Table 1 Properties of synthetic spherical SiO2particles.

Fig.1.Schematic diagram of experimental setup.

where Y and x are the particle concentration and turbidity level,respectively;and A,B,and C are the monomial coef ficient,quadratic term coef ficient,and constant,respectively.
The values of A,B,and C for the two kinds of SiO2particles are listed in Table 2.
After the completion of each particle retention and release experiment,the spatial distribution of particles in the soil column was determined.The end cover was torn down and the sand was scooped into 30-mL aluminum bottles.Six bottles were employed to extract the soil mass from each sand column.The bottles were then filled with deionized water,and slowly shaken for 1 h to liberate the trapped particles.The turbidity value of the solutions was recorded using the HACH turbidity meter in the same experimental procedure delineated for the ef fluent samples.Filled bottles were dried at 105°C for 12 h to remove any remaining water from the sand.The mass of the sand and the volume of water in each bottle were determined by measuring the weight of the empty bottles,water,and sand- filled bottles.After each experiment on the particle spatial distribution,all the sand in the column was cleaned with deionized water and dried at 105°C for the next series of experiments.
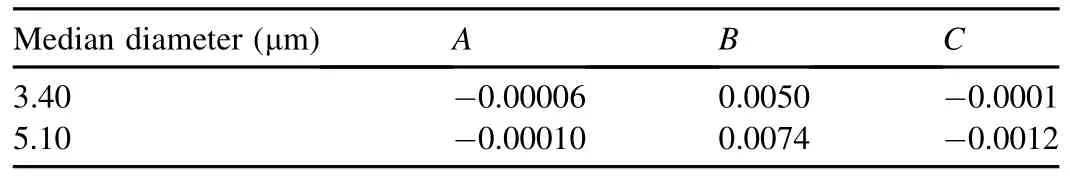
Table 2 Values of coef ficients in relationship between turbidity value and particle concentration.
In series 2,experiments were carried out with a flow velocity increment of 0.0870 cm/s,and the corresponding flow velocities of 0.1740 cm/s and 0.2610 cm/s.All other experimental steps were the same as those in series 1.
3.Mathematical modeling
The retention and release of particles in the sand column experiments were simulated using a one-dimensional convection-dispersion model that involves a source-sink term for particle release.Particle dispersion has a large in fluence on the particle transport near the pumping well.However,in previous studies,the dispersive flux was not taken into account in the deposition kinetic equation,and only the effect of hydrodynamic dispersion on the mass balance equation was considered(Herzig et al.,1970).Considering the dispersive flux,the mass balance equation and the particle deposition kinetic equation were formulated as follows(Chen et al.,2014):
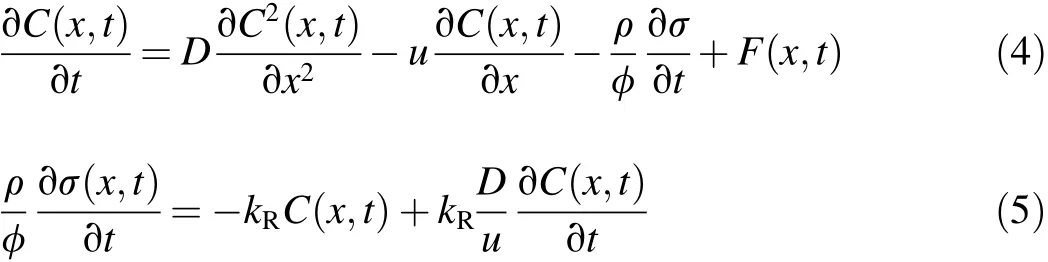
where C(x,t)is the particle concentration in the ef fluent,D is the dispersion coef ficient, σ(x,t)is the number of particles deposited on the unit surface area of the collector,u is the mean particlevelocity,tistime,xisthe distance theparticle travels,φ denotes the porosity of the porous media,ρ is the particle density,F(x,t)is the source-sink term,and kRis the particle release rate coef ficient from the solid phase to aqueous phase.
The initial and boundary conditions for a semi-in finite medium are as follows:
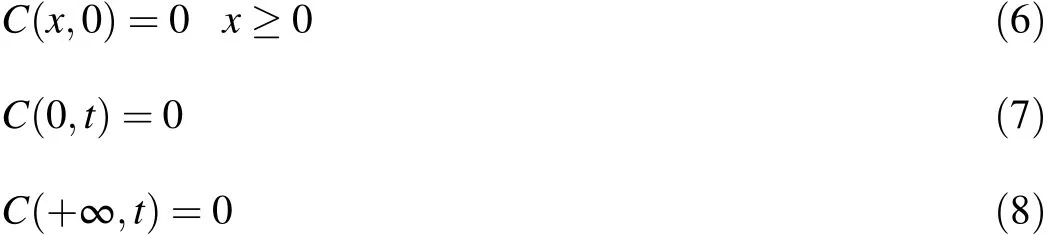
The given boundary condition(Eq.(8))is not realistic for the limited column length used in this study,but is essential to providing an analytical solution.The corresponding analytical solution of Eqs.(4)and(5),according to Eq.(6)through(8),is as follows(Chen et al.,2014):

For an instantaneous release,assuming that the saturated porous media contain a linear particle release source,which ranges from a to b,the particle release source function is as follows(Chen et al.,2014):
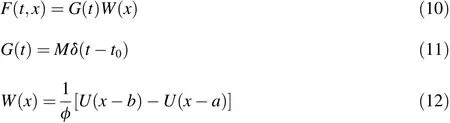
where G(t)is the particle release rate,W(x)denotes the distribution of the line source,U(x)is the Heaviside function,δ(t)is the Dirac delta function,M is the total mass of the particle release,and t0is the particle release time.The analytical solution for instantaneous release of a line source is as follows(Chen et al.,2014):
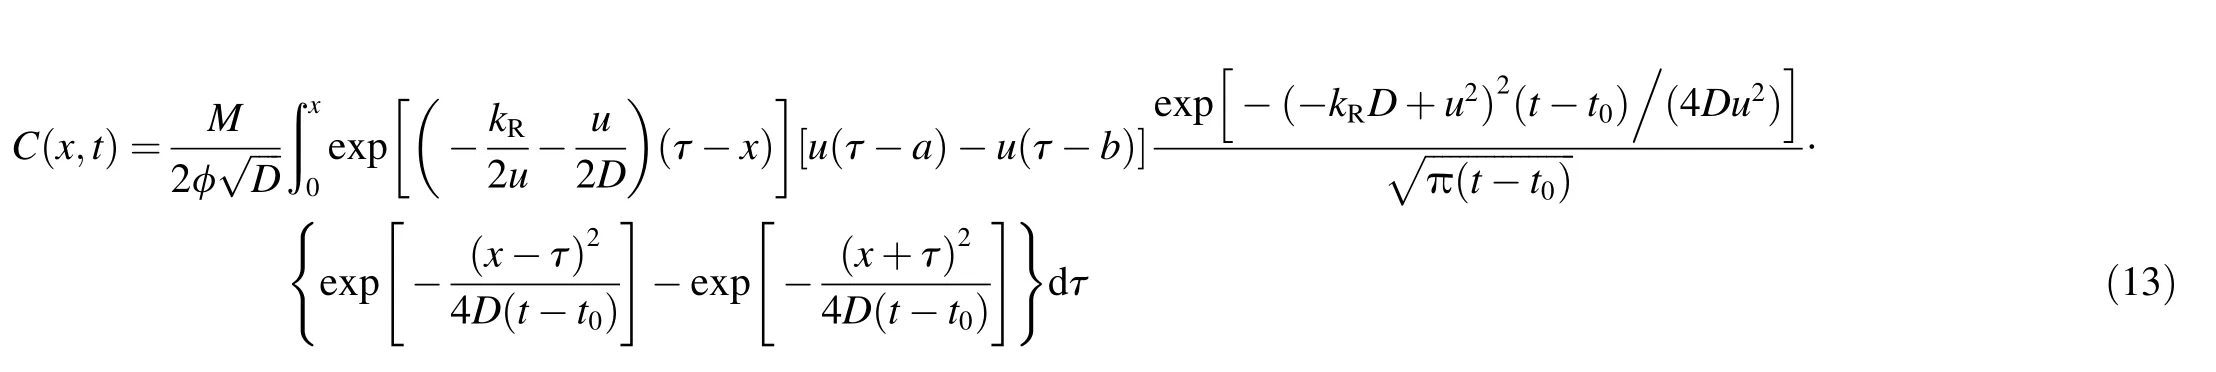
Based on the analytical solution given in Eq.(13),the 1stOpt software(7D-Soft High Technology Inc.,China)was employed to interpret the experimental release curves.1stOpt is a state-of-the-art software for the numerical optimization analysis,particularly at the scope of multivariable simulations,which can minimize the initial value problems(Fang et al.,2010;Wang et al.,2013).The universal global optimization algorithm in the 1stOpt software was used to calculate four required parameters:M,D,kR,and u(Fang et al.,2010;Wang et al.,2013).All fitting results showed that the squares of the correlation coef ficients were greater than 0.90.
4.Results and discussion
4.1.Laboratory experiments
Results of the retention and release experiments were interpreted by the analytical solution presented above.The ef fluent curves were fitted with the analytical solution shown in Eq.(13),and the release parameters were determined.
4.1.1.Behaviors of particle release in course of initial flow
In an aqueous solution,natural porous media forming minerals usually have a negative charge on the surface and attract counter ions for charge balance.This formation creates an electrical double layer.In our experiments,the soil column was flushed with deionized water.Deionized water has a low ionic strength and a thick electrical double layer.Therefore,the electric double-layer repulsion,which dominates the London-van der Waals attractive potential,extends deep into the aqueous solution.Eventually,particles are more easily detached and attachment to solid-water interfaces is inhibited.
Fig.2 shows the particle concentration in the ef fluent as a function of pore volume(a product of column volume and porosity)for water passing through the soil column at a flow velocity of 0.0870 cm/s.As can be observed,the ef fluent concentration curves for the various particle sizes are similar,and the particle concentration decreases with the increasing pore volume.As particles existed in both deposited and suspended states,the suspended particles and the weak deposited particles were eliminated at a steady flow until the turbidity value in the ef fluent was close to 0.24 NTU.In this case,hydrodynamic force and particle diffusion were suf ficient to conquer the weak binding force,and these particles were eventually mobilized at lower flow velocities.Particles were retained in the sand column largely via wedging and fouling,while straining made a minor contribution in this study.Moreover,when the pore volume was fixed,the concentration of the smaller-sized particles was higher.This suggests that the effect of particle wedging and fouling increases with the increasing particle size.All of these observations indicate that hydrodynamic force,particle wedging,and fouling were the main mechanisms of particle removal in the porous media used in this study.
4.1.2.Deposited particle release curves at two velocity increments

Fig.2.Particle concentration in ef fluent versus pore volume for initial flow velocity of 0.0870cm/s in two series.
Fig.3 shows particle concentration in the ef fluent as a function of pore volume for particle sizes of 3.40 and 5.10 μm with a velocity increment of 0.0435 cm/s.For a given flow velocity,particle concentrations first increased and then decreased with increasing pore volume.As the velocity increased to a given value,the hydrodynamic force on the particles increased and the volume of low velocity regions decreased.These results suggest that flow velocity inhibits wedging and fouling of particles in the porous media.Similar breakthrough times were observed for different flow velocities.It is assumed that breakthrough time for a given particle is not sensitive to the flow velocity.Furthermore,the peak concentration of particles decreased with flow velocity until the latter reached a critical value,beyond which the particle concentration increased(as shown in Fig.3).The critical velocities of peak concentrations for 3.40-and 5.10-μm particles were 0.1740 and 0.2175cm/s,respectively.As the majority of particles in the porous media were deposited owing to gravity and weak binding force,these particles were released and transported at lower flow velocities.However,only the trapped particles were present in the porous media when the flow velocity reached a critical value.Beyond this critical velocity,the particle concentration increased with the flow velocity.These observations suggest that particle wedging and fouling,which decrease with increasing flow velocity,represent the control mechanisms of particle release beyond the critical velocity.Moreover,the ef fluent concentration curves in Fig.3 gradually approach the peak concentration value,which indicates a transition from particle attachment to particle wedging and fouling accompanied with the increasing flow velocity.
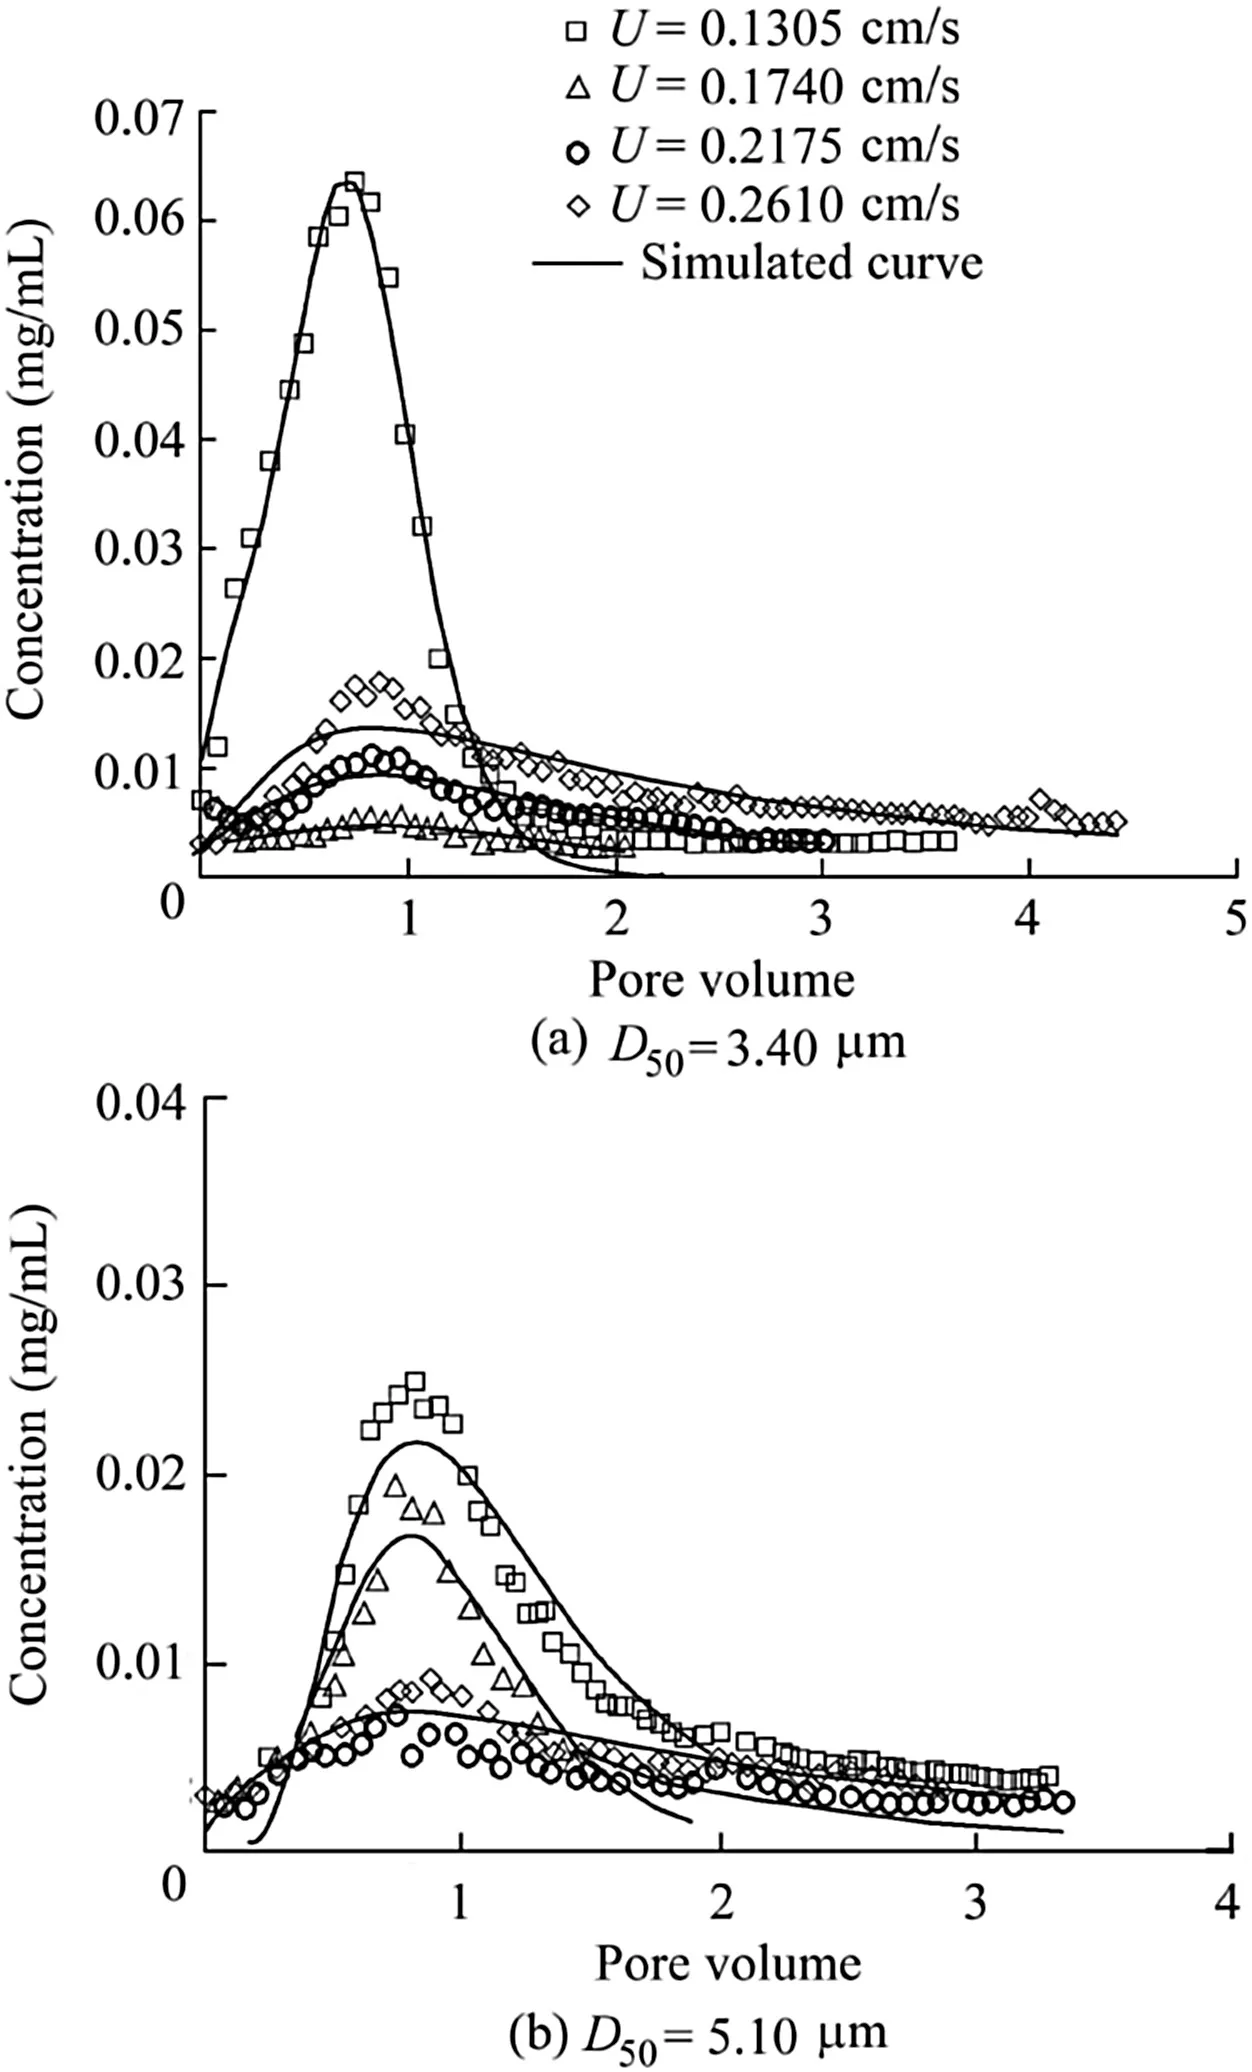
Fig.3.Observed release curves and corresponding simulated curves for particles with flow velocity increment of 0.0435cm/s.
Fig.4 presents particle concentration in the ef fluent as a function of pore volume for 3.40-and 5.10-μm particles with a velocity increment of 0.0870 cm/s.The particle concentration initially increased and then decreased with increasing pore volume.A larger peak concentration was observed for the 3.40-μm particles(0.180 mg/mL)compared to the 5.10-μm particles(0.160 mg/mL)at a velocity of 0.1740 cm/s.As the effect of wedging and fouling increases with an increasing particle size,these results indicate that particle wedging and fouling are important mechanisms of particle release in sands.
4.1.3.Spatial distribution of particles
Following the particle release experiments using sands,the distance of remaining particle mass from the column inlet was measured.Fig.5 shows the particle-to-sand mass ratio as a function of the normalized distance from the column inlet for the two velocity increment experiments.

Fig.4.Observed release curves and corresponding simulated curves for particles with flow velocity increment of 0.0870 cm/s.
The fraction of the 3.40-μm particle mass retained in the sand decreased with the increasing distance from the column inlet(Fig.5(a)).This observation is attributed to the particle wedging and fouling,which inhibit particle release over the first few centimeters of soil from the bottom as the blocked pores act like dead ends for the released particles.After the first few centimeters,particles are mainly transported in the larger,more continuous pores.Particle wedging and fouling further constrain particle release with the increasing particle mass.Therefore,particle mass distribution gradually approaches a reduced value with depth.Comparison of the 3.40-and 5.10-μm particles(Fig.5(a))indicates presence of very similar trends in both size groups.This observation can be interpreted through resemblances in the hydrodynamic force.However,the 5.10-μm particles exhibit larger particle mass fractions at the column inlet than the 3.40-μm particles,which is attributable to the greater particle wedging and fouling.Moreover,the particle-to-sand mass ratio is somewhat higher than the initial ratio(0.1%),perhaps owing to background interference of natural particles in these sands or resulting from the process of soil column packing.It is noteworthy that soil columns were packed under the same conditions,and the deposition pro files were obtained by shaking the excavated sand in the deionized water.Thus,the effect of background interference of natural particles as well as the effect of the packing process on particle retention should be the same in the conducted experiments.
Fig.5(b)shows that the particle mass fraction retained in the soil approaches a more constant value with depth.This is because of the particle wedging and fouling processes,which inhibit particle release.Comparison of the 3.40-and 5.10-μm particles indicates that particle concentration pro files are highly dependent on the particle size given a larger flow velocity increment condition.The 3.40-μm particles exhibit lower particle mass fractions at the velocity increment of 0.0870 cm/s.This result indicates that the enhanced particle wedging and fouling,associated with the increasing particle size,is especially pronounced at larger velocity increments.Fig.5 also shows that particles in the experiments with smaller velocity increments had a larger mass fraction at the column inlet.Furthermore,comparison of Fig.5(a)and(b)shows that a higher particle retention was observed for the 3.40-μm particles at the flow velocity increment of 0.0435 cm/s as compared to 0.0870 cm/s.These results further indicate that particle retention depends on the velocity increment.However,a lower particle retention was observed for the 5.10-μm particles at the flow velocity increment of 0.0435cm/s as compared to 0.0870 cm/s at depths greater than 5cm.These results provide evidence that the particle wedging and fouling and the velocity increment are interrelated.
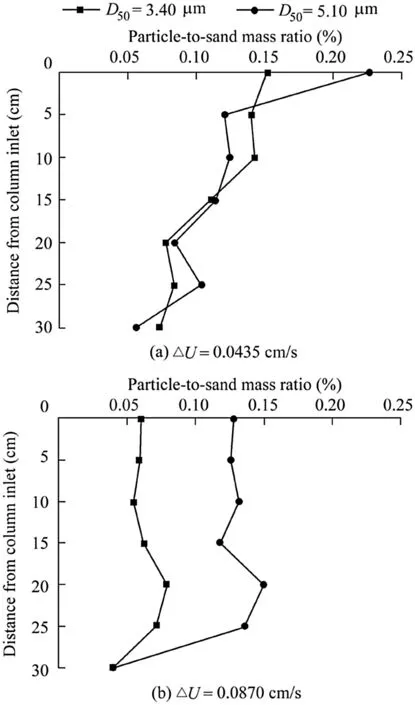
Fig.5.Relationship between particle-to-sand massratio and normalized distance from column inlet for 3.40-and 5.10-μm particles at different flow velocity increments.
4.2.Modeling experiments
Following the particle release experiments,the particle release behavior was computed using the universal global optimization algorithms of the 1stOpt software.A good fit between the experimental and model release curves was obtained for all flow velocities and particle sizes.
4.2.1.Effect of flow conditions on longitudinal dispersivity
Fig.6 shows the longitudinal dispersivity (α)for the 3.40-and 5.10-μm particles as a function of flow velocity(U)in both velocity increment experiments.The relationship between the dispersion coef ficient and longitudinal dispersivity depends on the kind of particle.By setting the experimental constant at n=1,the longitudinal dispersivity could be calculated using the following equation(Ah fir et al.,2009):

Forthe experimentswith a velocity incrementof 0.0435 cm/s,the longitudinal dispersivity decreased with the flow velocity until the critical velocity was reached.Beyond this threshold,the longitudinal dispersivity slightly increased.The critical velocity of longitudinal dispersivity for both 3.40-and 5.10-μm particles was 0.1740cm/s,indicating that the longitudinal dispersivity is related to particle amount and hydrodynamic force in the sand.Particle release is primarily controlled by the particle amount at a critical velocity.However,when the flow velocity reaches a critical threshold and hydrodynamic force becomes increasingly dominant with an increasing flow velocity,the longitudinal dispersivity increases.The longitudinal dispersivity of the sand was approximately 10-40 times larger than the maximum size of the sand for the 3.40-μm particles,while it was 4-40 times larger than the maximum size of the sand for the 5.10-μm particles.Thus,the longitudinal dispersivity decreases with increasing particle size.
For the velocity increment of 0.0870 cm/s(Fig.6),the longitudinal dispersivity slightly increased with the flow velocity.The longitudinal dispersivity of the sand was approximately 7-9 times larger than the maximum size of the sand for the 3.40-and 5.10-μm particles,which could be explained by the increased hydrodynamic force with increasing flow velocity.Comparison of the experiments with 0.0435 and 0.0870 cm/s velocity increments indicates that the range of the longitudinal dispersivity decreases with increasing velocity increment.Thus,the particle size and the velocity increment are inextricably linked in controlling the longitudinal dispersivity.
4.2.2.Effect of flow conditions on mean particle velocity
Fig.7 represents the mean particle velocity(u)as a function of the mean interstitial fluid velocity(v)for the 3.40-and 5.10-μm particles.Note that v is calculated as follows(Herzig et al.,1970):

The mean particle velocity increases with the increasing mean interstitial fluid velocity for both particle size groups and thevelocityincrementof0.0435cm/s(Fig.7).Thisisexplained by the action of hydrodynamic force,which tends to increase with increasing mean interstitial fluid velocity,on the released particles.Similartrendswere observedinthemeanvelocitiesof the two particle sizes at a velocity increment of 0.0870 cm/s(Fig.7).Comparison of the 3.40-and 5.10-μm particles at the velocity increment of 0.0435 cm/s indicates that the mean particle velocity increases with the particle size.Hydrodynamic forcealsoincreaseswithparticlesize.Largerparticlescannotbe transportedneartheporewallsorinthesmallerporesbecauseof their size.Therefore,they have to be transported at higher velocities close to the pore axis in larger pores.In such a way,larger particles appear to be transported through the column faster than the smaller particles.

Fig.6.Relationship between longitudinal dispersivity of particles and flow velocity for 3.40-and 5.10-μm particles.
Comparison of the 3.40-μm particles at velocity increments of 0.0435 and 0.0870 cm/s indicates that the mean particle velocity increases with the velocity increment.A similar trend is observed for the 5.10-μm particles,implying that velocity increment controls the particle velocity in porous media.
4.2.3.Effect of flow conditions on release rate
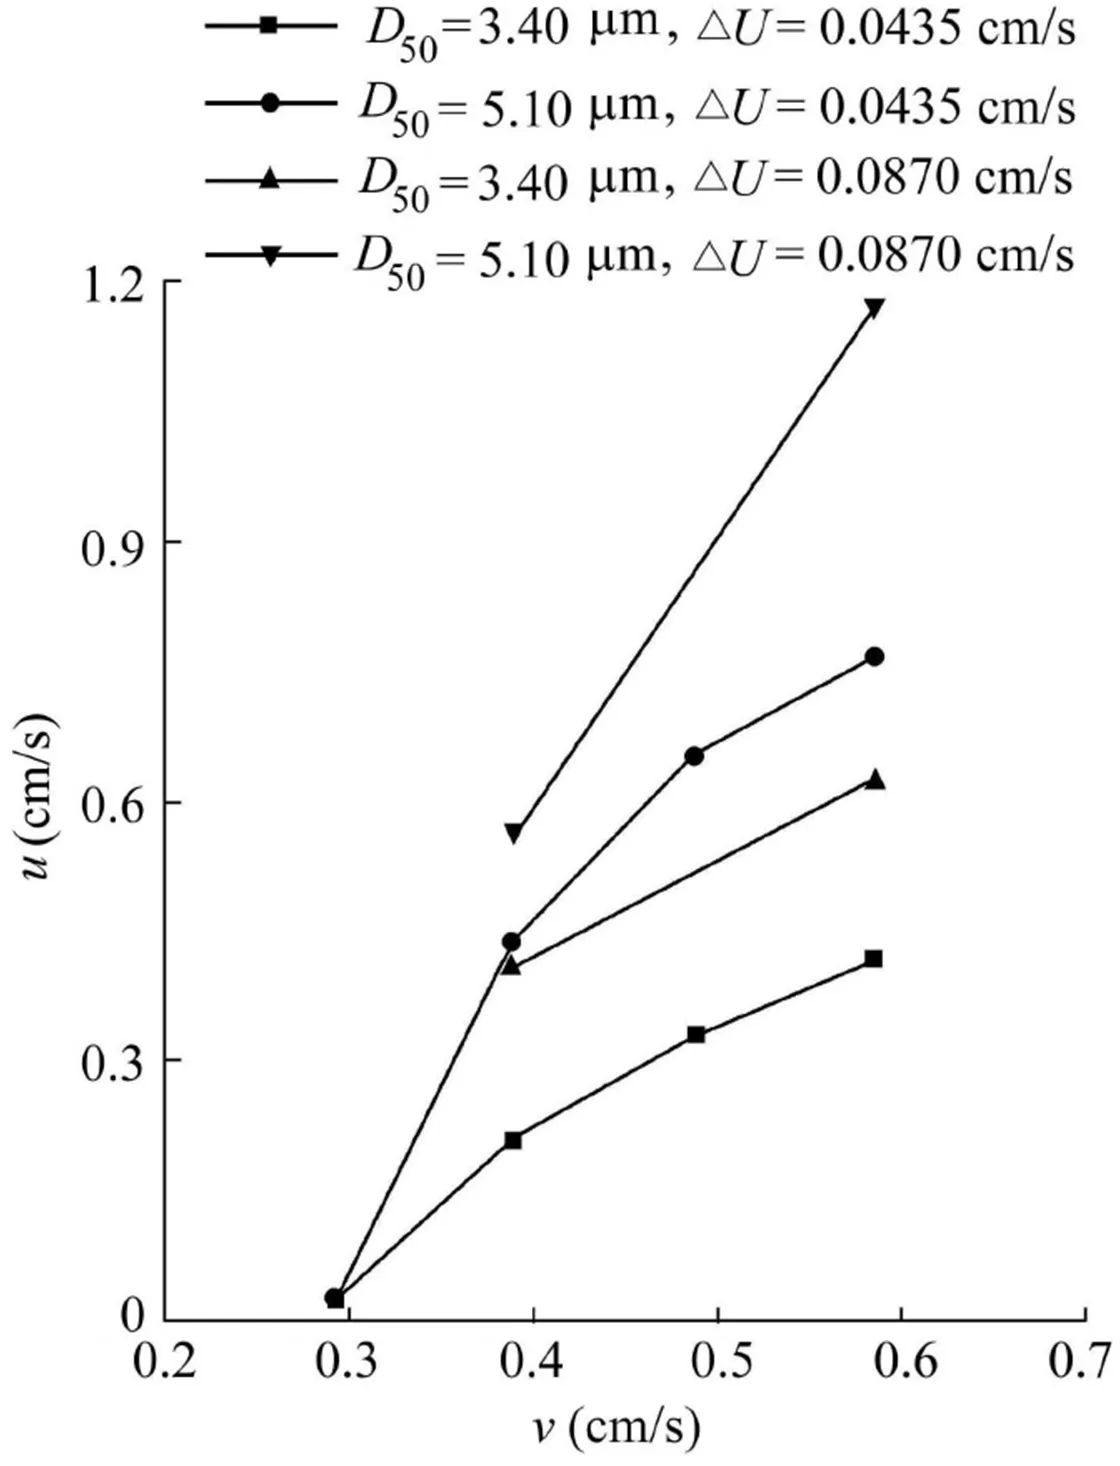
Fig.7.Relationship between mean particle velocity and mean interstitial fluid velocity for 3.40-and 5.10-μm particles.
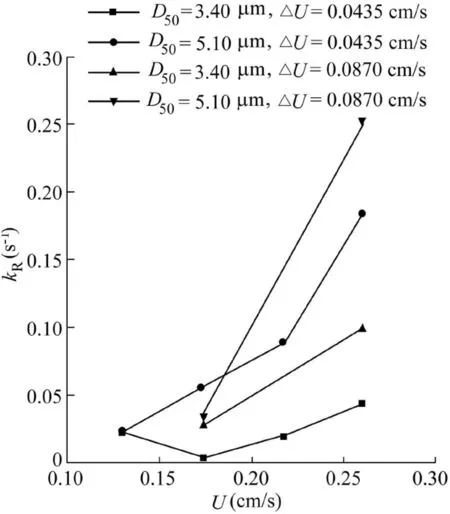
Fig.8.Relationship between release rate of particles and flow velocity for 3.40-and 5.10-μm particles.
Fig.8 shows the release rate (kR)as a function of flow velocity for the 3.40-and 5.10-μm particles.It is noteworthy that the relative contribution of each mechanism responsible for the particle retention also in fluences deposition kinetics,and thus the data for all deposition and release processes are combined into one signal.As seen in Fig.8,release rates show an upward trend with increasing flowvelocity.However,when thevelocity increment is 0.0435cm/s,the release rate of the 3.40-μm particles decreases slightly with flow velocity until a critical velocity is reached,and then increases(Fig.8).In this case,the insigni ficant hydrodynamic force being applied to the particles causestheretentionofaconsiderableamountofmassinthe first few flows as a result of particle attachment.Beyond the critical velocity,the hydrodynamic force being applied to the particle increases owing to the increasing flow velocity.Particle wedging and fouling are presumed to inhibit particle release from the porous media.Comparison of the 3.40-and 5.10-μm particles at the velocity increment of 0.0435 cm/s reveals that the5.10-μmparticlesexhibitahigherreleaseratebecauseofthe larger hydrodynamic force as a result of the increased particle size.Experiments with a velocity increment of 0.0870 cm/s indicate that hydrodynamic force constitutes the primary mechanism of particle release.As hydrodynamic force increases with the increasing particle size,the 3.40-μm particles exhibit a lower release rate than the 5.10-μm particles.
Comparison of the particle release rate for the 3.40-μm particles at velocity increments of 0.0435 and 0.0870 cm/s indicates that the particle release rate increases with velocity increment,which is associated with the mass of particles retained in the sand column.The larger the velocity increment is,the lower the mass of particles retained in the sand column will be.Therefore,the latter could be regarded as the primary control for particle release.At a flow velocity of 0.2610 cm/s,the particle release rate for the 5.10-μm particles is larger at a velocity increment of 0.0870 cm/s than at 0.0435 cm/s,which further validates this hypothesis.

Fig.9.Relationship between mass of released particles and flow velocity for 3.40-and 5.10-μm particles.
Fig.9 shows the mass of released particles(M)as a function of flow velocity for the 3.40-and 5.10-μm particles.The mass of released particles decreases with the flow velocity until a critical velocity is reached.Beyond this,the mass reaches a constant value for the 3.40-μm particles at a 0.0435 cm/s velocity increment.In this case,the mass of the retained particle initially controls particle release during the first flow velocity experiment,and after this,hydrodynamic force increases with the increasing flow velocity,and the mass of the retained particles decreases with the number of injections of flow,and then approaches a constant value.Comparison of the 3.40-and 5.10-μm particles at a 0.0435cm/s velocity increment shows that a much greater mass of 3.40-μm particles is retained,compared to that of 5.10-μm particles.This is another item of evidence of the particle wedging and fouling increasing with the particle size,and is consistent with the release curves shown in Fig.3.
5.Conclusions
Studies were undertaken to measure the coupled effect of increasing hydrodynamic force and particle size on the particle retention and release in saturated porous media.The behavior of particles of two size groups was examined in two series of experiments with two flow velocity increments.Particle release curves were in good agreement with the analytical solutions of a convection-dispersion model that includes a source-sink term for particle release.The experimental and modeling results provide strong evidence that wedging,fouling,and hydrodynamic force are the primary mechanisms of particle retention and release in our column experiments.Particle wedging and fouling in a speci fic porous medium represent a complex mechanism,coupled with such parameters as particle size,particle mass,and hydrodynamic force.Our speci fic findings are the following:
(1)The release concentration curves showed that the particle concentration initially increased and then decreased with increasing pore volume.The peak concentrations of particles decreased with the flow velocity until a critical velocity was reached,beyond which they increased.These observations suggest that particle wedging and fouling are the primary mechanisms for particle release beyond a critical velocity.
(2)Forexperiments with a velocity incrementof 0.0435 cm/s,the remaining particle mass in the sand decreased with increasing distance from the column inlet.However,for experiments with a velocity increment of 0.0870 cm/s,larger particles had higher particle mass fractions due to particle wedging and fouling increasing with particle size.
(3)For experiments with a low-velocity increment,the longitudinal dispersivity decreased with the flow velocity until a criticalvelocitywasreached,beyondwhichitincreasedslightly.However,for large velocity increment experiments,the longitudinal dispersivity increased slightly with the flow velocity.Furthermore,the range of longitudinal dispersivity decreased with increasing particle size and velocity increments.The results show that particle size and velocity increment are inextricably linked in controlling the longitudinal dispersivity.
(4)The mean particle velocity increased with the increasing mean interstitial fluid velocity.The mean particle velocity pro files were highly sensitive to the particle size at lowvelocity increments,and the mean particle velocity increased with the velocity increment.
(5)In general,particle release rates increase with both flow velocity and velocity increment.As increases in particle size induce larger hydrodynamic force,smaller particles exhibit a lower release rate than larger particles.The mass of the released particles provides further evidence that particle wedging and fouling are the major factors that control particle release in the sand columns.
Ah fir,N.D.,Benamar,A.,Alem,A.,Wang,H.,2009.In fluence of internal structure and medium length on transport and deposition of suspended particles:A laboratory study.Transp.Porous Media 76(2),289-307.https://doi.org/10.1007/s11242-008-9247-3.
Bergendahl,J.,Grasso,D.,2000.Prediction of colloid detachment in a model porous media hydrodynamics.Chem.Eng.Sci.55(9),1523-1532.https://doi.org/10.1016/S0009-2509(99)00422-4.
Blume,T.,Weisbrod,N.,Selker,J.S.,2002.Permeability changes in layered sediments:Impact of particle release.Groundwater 40(5),466-474.https://doi.org/10.1111/j.1745-6584.2002.tb02530.x.
Blume,T.,Weisbrod,N.,Selkera,J.S.,2005.On the critical salt concentrations for particle detachment in homogeneous sand and heterogeneous Hanford sediments.Geoderma 124(1-2),121-132.https://doi.org/10.1016/j.geoderma.2004.04.007.
Bradford,S.A.,Yates,S.R.,Bettahar,M.,Simunek,J.,2002.Physical factors affecting the transport and fate of colloids in saturated porous media.Water Resour.Res.38(12),63-1-63-12.https://doi.org/10.1029/2002WR001340.
Bradford,S.A.,Morales,V.L.,Zhang,W.,Harvey,R.W.,Packman,A.,Mohanram,A.,Welty,C.,2013.Transport and fate of microbial pathogens in agricultural settings.Crit.Rev.Environ.Sci.Technol.43(8),775-893.https://doi.org/10.1080/10643389.2012.710449.
Bradford,S.A.,Wang,Y.,Kim,H.,Torkzaban,S.,ˇSimůnek,J.,2014.Modeling microorganism transport and survival in the subsurface.J.Environ.Qual.43(2),421-440.https://doi.org/10.2134/jeq2013.05.0212.
Chen,X.X.,Bai,B.,Cai,Q.P.,2014.Theoretical solution of particle releasetransport in saturated porous media.Sci.Sin.44(6),610-618.https://doi.org/10.1360/092013-1188(in Chinese).
Engstr¨om,E.,Thunvik,R.,Kulabako,R.,2015.Water transport,retention,and survival of Escherichia coli in unsaturated porous media:A comprehensive review of processes,models,and factors.Crit.Rev.Environ.Sci.Technol.45(1),1-100.https://doi.org/10.1080/10643389.2013.828363.
Fang,X.,Dai,Q.,Yin,Y.,Xu,Y.,2010.A compact and accurate empirical model for turbine mass flow characteristics.Energy 35(12),4819-4823.https://doi.org/10.1016/j.energy.2010.09.006.
Grolimund,D.,Borkovec,M.,Barmettler,K.,Sticher,H.,1996.Colloidfacilitated transport of strongly sorbing contaminants in natural porous media:A laboratory column study.Environ.Sci.Technol.30(10),3118-3123.https://doi.org/10.1021/es960246x.
Grolimund,D.,Borkovec,M.,2006.Release of colloidal particles in natural porous media by monovalent and divalent cations.J.Contam.Hydrol.87(3-4),155-175.https://doi.org/10.1016/j.jconhyd.2006.05.002.
Herzig,J.P.,Leclerc,D.M.,Goff,P.L.,1970.Flow of suspensions through porous media:Application to deep filtration.Ind.Eng.Chem.62(5),8-35.https://doi.org/10.1021/ie50725a003.
Karathanasis,A.D.,1999.Subsurface migration of copper and zinc mediated by soil colloids.Soil Sci.Soc.Am.J.63(4),830-838.https://doi.org/10.2136/sssaj1999.634830x.
Li,X.,Zhang,P.,Lin,C.L.,Johnson,W.P.,2005.Role of hydrodynamic drag on microsphere deposition and re-entrainment in porous media under unfavorable conditions.Environ.Sci.Technol.39(11),4012-4020.https://doi.org/10.1021/es048814t.
Missana,T.,Alonso,U´.,García-Guti■errez,M.,Mingarro,M.,2008.Role of bentonite colloids on europium and plutonium migration in a granite fracture.Appl.Geochem.23(6),1484-1497.https://doi.org/10.1016/j.apgeochem.2008.01.008.
Natarajan,N.,Kumar,G.S.,2011.Spatial moment analysis of colloid facilitated radionuclide transport in a coupled fracture-matrix system.Int.J.Energy Environ.2(3),491-504.
Ochi,J.,Vernoux,J.F.,1998.Permeability decrease in sandstone reservoirs by fluid injection:Hydrodynamic and chemical effects.J.Hydrol.208(3-4),237-248.https://doi.org/10.1016/S0022-1694(98)00169-3.
Pazmino,E.,Trauscht,J.,Johnson,W.P.,2014.Release of colloids from primary minimum contact under unfavorable conditions by perturbations in ionic strength and flow rate.Environ.Sci.Technol.48(16),9227-9235.https://doi.org/10.1021/es502503y.
Porubcan,A.A.,Xu,S.P.,2011.Colloid straining within saturated heterogeneous porous media.Water Resour.Res.45(4),1796-1806.https://doi.org/10.1016/j.watres.2010.11.037.
Raychoudhury, T., Tufenkji, N., Ghoshal, S., 2014. Straining of polyelectrolyte-stabilized nanoscale zero valent iron particles during transport through granular porous media.Water Res.50,80-89.https://doi.org/10.1016/j.watres.2013.11.038.
Reddi,L.N.,Ming,X.,Hajra,M.G.,Lee,I.M.,2000.Permeability reduction of soil filters due to physical clogging.J.Geotech.Geoenviron.Eng.126(3),236-246.https://doi.org/10.1061/(ASCE)1090-0241(2000)126:3(236).
Saada,Z.,Canou,J.,Dormieux,L.,Dupla,J.C.,Maghous,S.,2005.Modelling of cement suspension flow in granular porous media.Int.J.Numer.Anal.Methods Geomech.29(7),691-711.https://doi.org/10.1002/nag.433.
Sang,W.,Morales,V.L.,Zhang,W.,Stoof,C.R.,Gao,B.,Schatz,A.L.,Zhang,Y.L.,Steenhuis,T.S.,2013.Quanti fication of colloid retention and release by straining and energy minima in variably saturated porous media.Environ.Sci.Technol.47(15),8256-8264.https://doi.org/10.1021/es40 0288c.
Sasidharan,S.,Torkzaban,S.,Bradford,S.A.,Dillon,P.J.,Cook,P.G.,2014.Coupled effects of hydrodynamic and solution chemistry on long-term nanoparticle transport and deposition in saturated porous media.Colloids Surfaces A Physicochem.Eng.Aspects 457,169-179.https://doi.org/10.1016/j.colsurfa.2014.05.075.
Sasidharan,S.,Torkzaban,S.,Bradford,S.A.,2016.Transport and retention of bacteria and viruses in biochar-amended sand.Sci.Total Environ.548-549,100-109.https://doi.org/10.1016/j.scitotenv.2015.12.126.
Sen,T.K.,Khilar,K.C.,2006.Review on subsurface colloids and colloidassociated contaminant transport in saturated porous media.Adv.Colloid Interface Sci. 119(2-3), 71-96.https://doi.org/10.1016/j.cis.2005.09.001.
Sharma,M.M.,Chamoun,H.,Sarma,D.S.R.,Schechter,R.S.,1992.Factors controlling the hydrodynamic detachment of particles from surfaces.J.Colloid Interface Sci.149(1),121-134.https://doi.org/10.1016/0021-9797(92)90398-6.
Thomas,J.M.,Ward,C.H.,1989.In situ biorestoration of organic contaminants in the subsurface.Environ.Sci.Technol.23(7),760-766.https://doi.org/10.1021/es00065a004.
Tomlinson,S.S.,Vaid,Y.P.,2000.Seepage forces and con fining effects on piping erosion.Can.Geotech.J.37(1),1-13.https://doi.org/10.1139/t99-116.
Torkzaban,S.,Bradford,S.A.,van Genuchten,M.T.,Walker,S.L.,2008.Colloid transport in unsaturated porous media:The role of water content and ionic strength on particle straining.J.Contam.Hydrol.96(1-4),113-127.https://doi.org/10.1016/j.jconhyd.2007.10.006.
Torkzaban,S.,Bradford,S.A.,Vanderzalm,J.L.,Patterson,B.M.,Harris,B.,Prommer,H.,2015.Colloid release and clogging in porous media:Effects of solution ionic strength and flow velocity.J.Contam.Hydrol.181,161-171.https://doi.org/10.1016/j.jconhyd.2015.06.005.
Tripathy,A.,2010.Hydrodynamically and chemically induced in situ kaolin particle release from porous media an experimental study.Adv.Powder Technol.21(5),564-572.https://doi.org/10.1016/j.apt.2010.02.012.
Van Beek,C.G.E.M.,De Zwart,A.H.,Balemans,M.,Kooiman,J.W.,Van Rosmalen,C.,Timmer,H.,Vandersluys,J.,Stuyfzand,P.J.,2010.Concentration and size distribution of particles in abstracted groundwater.Water Res.44(3),868-878.https://doi.org/10.1016/j.watres.2009.09.045.
Wang,W.,Chen,D.,Chu,J.,Li,J.,Xue,T.,Wang,L.,Wang,D.,Qi,T.,2013.In fluence and hydrolysis kinetics in titanyl sulfate solution from the sodium hydroxide molten salt method.J.Cryst.Growth 381,153-159.https://doi.org/10.1016/j.jcrysgro.2013.07.023.
Xu,S.P.,Gao,B.,Saiers,J.E.,2006.Straining of colloidal particles in saturated porous media.Water Resour.Res.42(2),W12S16,1-10.https://doi.org/10.1029/2006WR004948.
This work was supported by the National Natural Science Foundation of China(Grant No.51308235),the Natural Science Foundation of Fujian Province of China(Grant No.2015J01209),and the Project Funded by the China Postdoctoral Science Foundation(Grant No.2015M580384).
*Corresponding author.
E-mail address:cxx0910@gmail.com(Xing-xin Chen).
Peer review under responsibility of Hohai University.
杂志排行
Water Science and Engineering的其它文章
- Simulation of flow pattern at rectangular lateral intake with different dike and submerged vane scenarios
- Flow patterns and critical criteria of thermally strati fied shear flow in braided rivers
- Fate of nitrogen in subsurface in filtration system for treating secondary ef fluent
- Application of SWAT99.2 to sensitivity analysis of water balance components in unique plots in a hilly region
- Assessment of future climate change impacts on hydrological behavior of Richmond River Catchment
- Numerical modeling of solute transport in deformable unsaturated layered soil