Numerical modeling of solute transport in deformable unsaturated layered soil
2017-11-20ShengWuDongshengJeng
Sheng Wu,Dong-sheng Jeng*
Cities Research Institute,Grif fith School of Engineering,Grif fith University,Southport 4222,Australia Received 3 February 2017;accepted 30 June 2017 Available online 30 September 2017
Numerical modeling of solute transport in deformable unsaturated layered soil
Sheng Wu,Dong-sheng Jeng*
Cities Research Institute,Grif fith School of Engineering,Grif fith University,Southport 4222,Australia Received 3 February 2017;accepted 30 June 2017 Available online 30 September 2017
The effect of soil strati fication was studied through numerical investigation based on the coupled model of solute transport in deformable unsaturated soil.The theoretical model implied two-way coupled excess pore pressure and soil deformation based on Biot's consolidation theory as well as a one-way coupled volatile pollutant concentration field developed from the advection-diffusion theory.Embedded in the model,the degree of saturation, fluid compressibility,self-weight of the soil matrix,porosity variance,longitudinal dispersion,and linear sorption were computed.Based on simulation results of a proposed three-layer land fill model using the finite element method,the multi-layer effects are discussed with regard to the hydraulic conductivity,shear modulus,degree of saturation,molecular diffusion coef ficient,and thickness of each layer.Generally speaking,contaminants spread faster in a strati fied field with a soft and highly permeable top layer;soil parameters of the top layer are more critical than the lower layers but controlling soil thicknesses will alter the results.This numerical investigation showed noticeable impacts of strati fied soil properties on solute migration results,demonstrating the importance of correctly modeling layered soil instead of simply assuming the averaged properties across the soil pro file.
©2017 Hohai University.Production and hosting by Elsevier B.V.This is an open access article under the CC BY-NC-ND license(http://creativecommons.org/licenses/by-nc-nd/4.0/).
Solute transport;Layered soil;Consolidation;Unsaturated soil;Deformable media
1.Introduction
Contaminant mass transport through porous media is usually described by well-established conventional advectiondispersion transport models(e.g.,Bear,1972;Barry,1992)with the ability to account for advection,dispersion,and sorption.Since the mid-20th century,numerous researchers have worked on the advection-dispersion equation(ADE)through analytical approximations(Wang and Zhan,2015),numerical simulations(Craig and Rabideau,2006;Boso et al.,2013),and experimental investigations(Rolle et al.,2012)of fully saturated soil environments.Furthermore,solute transport in an unsaturated soil matrix has been studied by severalresearchers.For example,Fityus et al.(1999)focused on the effects of the degree of saturation and presented pollutant migration in a steady-state unsaturated soil liner under a land fill,and Kumar and Dodagoudar(2010)proposed a stable and convergent two-dimensional(2D)approximate solution using the mesh-free technique.
All the aforementioned studies were based on the assumption of rigid porous media that the volume of the porous media does not change and advective flow is only induced by an external hydraulic gradient.In fact,soil volume change(i.e.,soil consolidation)occurs simultaneously with solute transport inmanycases.Forexample,itoccurswherethe fieldisunderan applied load(self-weight, fill placement, finite size loading,etc.)or experiencing changes in the groundwater table(pumping,artesianwells,etc.).Insuchcases,the coupledeffectofsoil deformation and solute transport needs to be considered.Alshawabkeh et al.(2004)showed that the excess pore pressure dissipation producedatransient advective fluxofcontaminants,which had a strong in fluence on overall flux.The first attempt at a consolidation-induced solute transport model was formulated by Potter et al.(1994),with errors compared to centrifuge model test results.Later,based on the mass conservation principle,Smith(2000)derived a one-dimensional(1D)contaminanttransportequationandprovidedananalyticalsolutionfora steady-stateconcentrationandavariedporositycircumstancein a fully saturated deformable porous media.The coupled effect of soil consolidation was incorporated into the solute transport model by, first,computing the porosity variation during consolidationand,second,introducingsolutemigrationintothe solid phase.To link the two components of solute in pore fluid and solid phases,a linear sorption relationship was postulated.Later,Peters and Smith(2002)extended their previous model(Smith,2000)to accommodate the time-dependent solute migration process.Recently,adopting Biot's(1941)consolidation theory,Zhang et al.(2012)further developed Peters and Smith's(2002)small strain model to account for the degree of saturation and fluid compressibility.When soil deformation increases,large strain models are required,as reported in Fox(2007a,2007b)and Zhang et al.(2013).In this study,we only used a small strain model as the first approximation for the case of a multi-layer deformable medium.
Bene fitting from the simplicity of the traditional ADE,the conventional model enjoys vast applicability,including in the modeling of solute transport,especially of purely diffusive flows in a heterogeneous soil matrix.For example, field measurement(Ellsworth and Jury,1991)and soil column experimental evaluations have been conducted to examine the solute behavior in layered soil(Sharma et al.,2014).Satisfying the solute mass conservation principle at soil interfaces,Leij and Van Genuchten(1995)derived an analytical solution for solute transport in two-layer porous media with the technique of Laplace transformation.Liu et al.(1998)provided an analytical solution with an arbitrary initial condition and inlet boundary condition.Later,Li and Cleall(2011)extended previous studies to incorporate different combinations of fixed concentration,zero flux,and fixed flux conditions at inlet and outlet boundaries.However,to date,the effect of soil deformation on the solute transport within layered soil has not been fully studied.The only attempt,for a coupled solute transport and consolidation model in multi-layer soil,was made by Pu and Fox(2016a,2016b)using the piecewise method.They compared the numerical modeling results of two-layer soil and homogenous soil to highlight the impact of layered soil in a fully saturated soil matrix undergoing signi ficant deformation.However,for an unsaturated layered soil,data are not available in the literature.
The aim of this study was to investigate the consolidationinduced solute transport in uniform and layered unsaturated porous media and address the importance of correctly modeling soil heterogeneity.This paper will first provide a brief review of the theoretical model of solute transport in partially saturated deformable porous media.Then,the numerical model for solute transport in a three-layer unsaturated soil matrix will be outlined.Finally,the multi-layer effect will be examined in detail through the results of a parametric study.
2.Model description
Based on the fundamental construction method of a land fill site,an unsaturated multi-layer soil matrix subjected to a vertical ramp load on the top of the field was assumed,as shown in Fig.1,where P1through P7are the points used in the parametric study.The soil is deformable.Therefore,it will produce excess pore pressure when an external ramp load is applied and the excess pore pressure will dissipate gradually when the load becomes constant(the post-loading state).The excess pore pressure will generate a transient advective flow,which carries the non-active contaminant migrating downward.Furthermore,the width of the land fill site was assumed to be larger than the thickness of each soil layer,and the load on the top surface was assumed to be uniform.Therefore,a 1D model was used,with its positive z-axis pointing downward.In contrast to the previous study of Zhang et al.(2012),this study focused on a multi-layer structure and ran simulations in a dimensional form.
2.1.Governing equations
Following previous work(Zhang et al.,2012),in order to numerically model the coupled solute transport and soil consolidation,three governing equations were derived.
The governing equation for the field of excess pore pressure(pe)is

where Sris the degree of saturation,n0is the initial porosity,K is the hydraulic conductivity,ρwis the fluid density,u is the soil vertical displacement,g is the acceleration due to gravity,t is time,and β is the fluid compressibility due to the change in pore pressure,which is de fined as(Fredlund and Rahardjo,1993)

where Kw0is the pore water bulk modulus,with a value of 2 GPa;rhis the volumetric fraction of dissolved air within pore water,with a value of 0.02;and Paand P0are the gauge air pressure and atmospheric pressure,respectively,with P0=100 kPa.
The governing equation for the soil vertical displacement(u)is

where G and ν are the soil shear modulus and Poisson's ratio,respectively,and ρsis the solid particle density.
The governing equation for solute concentration(cf)is

where Kdis the partition coef ficient of the contaminant,which de fines the mass of the contaminant being absorbed onto the solid phase,and Dmand αLare the coef ficients of molecular diffusion and longitudinal dispersion,respectively.A detailed explanation and derivation can be found in Zhang et al.(2012).
In this study,the soil consolidation and conventional solute transport processes were semi-coupled.The excess pore pressure and soil deformation resulting from the applied load were assumed to trigger the solute transport in the soil but the contaminant migration did not have an effect on the consolidation process.In the numerical model,the force balance equation needs to be solved simultaneously with the storage equation,while the solute transport equation can be solved separately by adopting the pore pressure and soil deformation from previous calculations.
2.2.Boundary conditions and initial conditions
In this study,a land fill with one leachate collection system was assumed to be constructed on the top of a compacted clay layer and two natural soil layers(Fig.1).The contaminant migration through the three soil layers beneath the land fill was evaluated.
At the top boundary(z=0),the impermeable geomembrane layer prevented Darcy's flow.Therefore,a zero excess pore pressure gradient was postulated,as follows:

Furthermore,as the waste was disposed to the land fill gradually until it reached its capacity,a ramp load was assumed with a constant increasing rate.As shown in Fig.2,the external load Q(t)keeps increasing at an annual rate of 200 kPa for two years and remains constant(400 kPa)until the end of the simulation period.
To derive the top boundary condition for soil deformation,an elastic deformation was taken into account,and a vertical force balance relationship was applied.This led the soil deformation at the top boundary to be

According to Zhang et al.(2012),considering the volatile organic compounds that diffuse through the geomembrane layer and dissolve into the pore water,the top boundary condition for the solute concentration was

where DGis the mass transfer coef ficient of geomembrane,and c0is the reference solute concentration in the waste.
At the two interfaces(z=Z1=L1and z=Z2=L1+L2),boundary conditions of continuity were applied to the pore pressure,soil deformation,and solute concentration fields,and the continuity of the solute mass flux was incorporated(Peters and Smith,2001):where Diis the coef ficient of hydrodynamic dispersion that describes the joint effects of molecular diffusion and longitudinal dispersion at the ith interface,andrefer to the positions right above and below the ith interface,respectively.
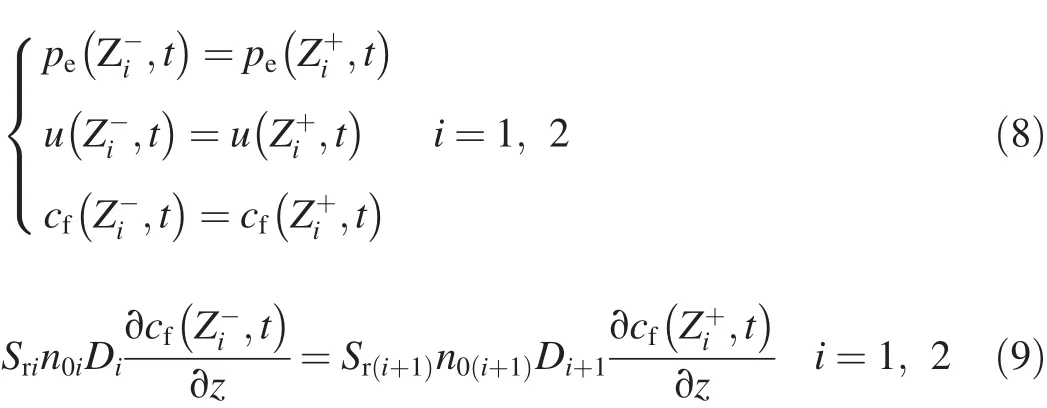
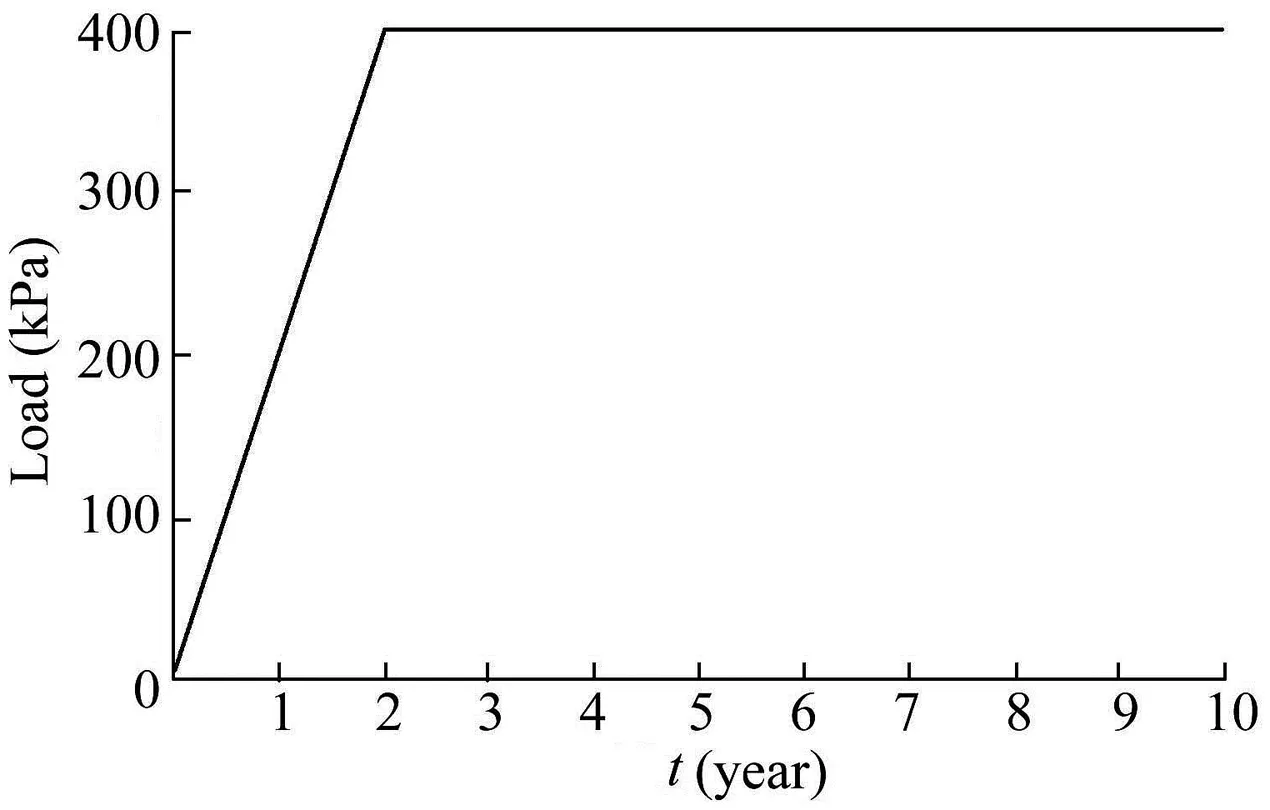
Fig.2.Ramp load.
At the exit boundary(z=Le=L1+L2+L3),a free drainage condition was considered,which implied a zero pore pressure,and no deformation was allowed at that point.In addition,the concentration gradient was assumed to be zero.Hence,only advective flow occurred at the outlet boundary.The lower boundary conditions were expressed as

To simplify the model,all initial values for the pore pressure,soil deformation,and solute concentration fields were assumed to be zero,i.e.,

2.3.Input parameters
First of all,a single-layer(SL)model was simulated as the reference group.Table 1 summarizes the parameter input for the SL model.
A parametric study was conducted to investigate the multilayer effects by varying certain parameters for each layer while keeping the rest of the parameters the same as those in the SL model,as follows:in model A,the hydraulic conductivity of each layer was varied,with the values of each layer determined to be K1=1.50×10⁻¹¹m/s,K2=1.50×10-10m/s,and K3=2.85×10⁻¹⁰m/s,respectively;in model B,the shear modulus was varied,with thevalues of each layer determined to be G1=5.00×10⁵Pa,G2=2.75×10⁶Pa,and G3=5.00×10⁶Pa,respectively;in model C,the molecular diffusion coef ficient was varied,with the values of each layerdeterminedtobeDm1=5.00×10⁻¹⁰m2/s,Dm2=2.75×10-9m2/s,and Dm3=5.00×10⁻⁹m2/s,respectively;in model D,the degree of saturation was varied,with the values of each layer determined to be Sr1=0.80,Sr2=0.90,and Sr3=0.98,respectively;in model E,Poisson's ratio was varied,with the values of each layer determined to be ν1=0.20,ν2=0.33,and ν3=0.40,respectively;inmodelF,the shear modulus was varied in the reversed order compared to model B,with the values of each layer determined to be G1=5.00×10⁶Pa,G2=2.75×10⁶Pa,and G3=5.00×10⁵Pa,respectively;in model G,the thickness of each layer and molecular diffusion coef ficient were varied simultaneously,with the values of thickness of each layer determined to be L1=0.5 m,L2=1.0 m,and L3=1.5 m,respectively,and thevalues of molecular diffusioncoef ficient of each layer the same as those in model C.Note that the parametersusedintheSLmodelwereconsistentwiththemiddle-layer parameters in the three-layer model,most of which were the average values of the varied parameters for each layer.A combination of the parameters was selected to ensure that the coef ficient of consolidation(cv)stayed within the range of 1×10⁻⁸to 3×10⁻⁷m2/s(Wallace and Otto,1964).The coef ficient of consolidation(cv)can be expressed as

Additionally,while making selection of the parameters,soil deformation was kept less than 20%to satisfy the small deformation assumption.
2.4.Validation
The modeling results of the pore pressure,soil deformation,and solute concentration distributions along the soil depth for different years,the solute concentration at some points(P1,P4,and P7in Fig.1),and the advective emission(Eadv)at the outlet,obtained with the present three-layer model and the full SL model in Zhang et al.(2012),were first compared,as shown in Fig.3.Before making any comparison to the three-layer model,all dimensionless results presented in Zhang et al.(2012)were convertedtoadimensionalform.Fig.3showsthatthethree-layer model agrees with the previous SL model(Zhang et al.,2012).
Utilizing the piecewise function,the ramp load can be applied with different smoothing methods at the turning point.Here,a continuous second derivative was adopted and applied for a period of half a year.This smoothing method can be understood as follows:when the land fill site is about to reach capacity,less waste is disposed into this field,and more waste delivered to a new site.Therefore,the loading rate decreases.
3.Results and discussion
3.1.Single-layer model
Adopting the parameters listed in Table 1,the three-layer model was first used for a simulation of 80 years to mimic asingle-layer situation,and the results are shown in Fig.4.The consolidation progress can be observed in Fig.4(a)and(b).For the first two years,when the external load keeps rising at a constant increasing rate of 200 kPa/year,the excess pore pressure dramatically increases and reaches its maximum.The soil alsoshowsnoticeabledeformationduringtheperiodbecausethe pore fluid is expelled from the soil matrix.However,during the post-loading period,the excess pore pressure dissipates and leadstoanincrementoftheeffectivestress,whichcontributesto further soil deformation.Fig.4(a)indicates that the excess pore pressure will fully dissipate in 20 years,with the soil deformation reaching its maximum(soil deforms less than 4%)around the same time(Fig.4(b)).Additionally,Fig.4(c)illustrates the distribution of the normalized solute concentration.After one year,the contaminant migrates to a depth of 1 m;after 10 years,the contaminant reaches the bottom boundary.Although the excess pore pressure has fully dissipated at the twentieth year,due to the molecular diffusion,the contaminant keeps spreading until the whole site is polluted.Fig.4(d)shows the revolution of the solute concentration at the top,middle,and bottom of each layer.From this figure,the breakthrough time,which is the time taken for the contaminant concentration to reach a certain pollutionlevel,canberead.Forexample,ittakes15yearsforthe contaminantlevelattheoutletboundary(P7)toreach10%ofthe concentration in the land fill.It is an important metric for the evaluation of the contaminant transport,and an earlier breakthrough time implies that the site may be polluted more easily.

Table 1 Parameters of SL model.
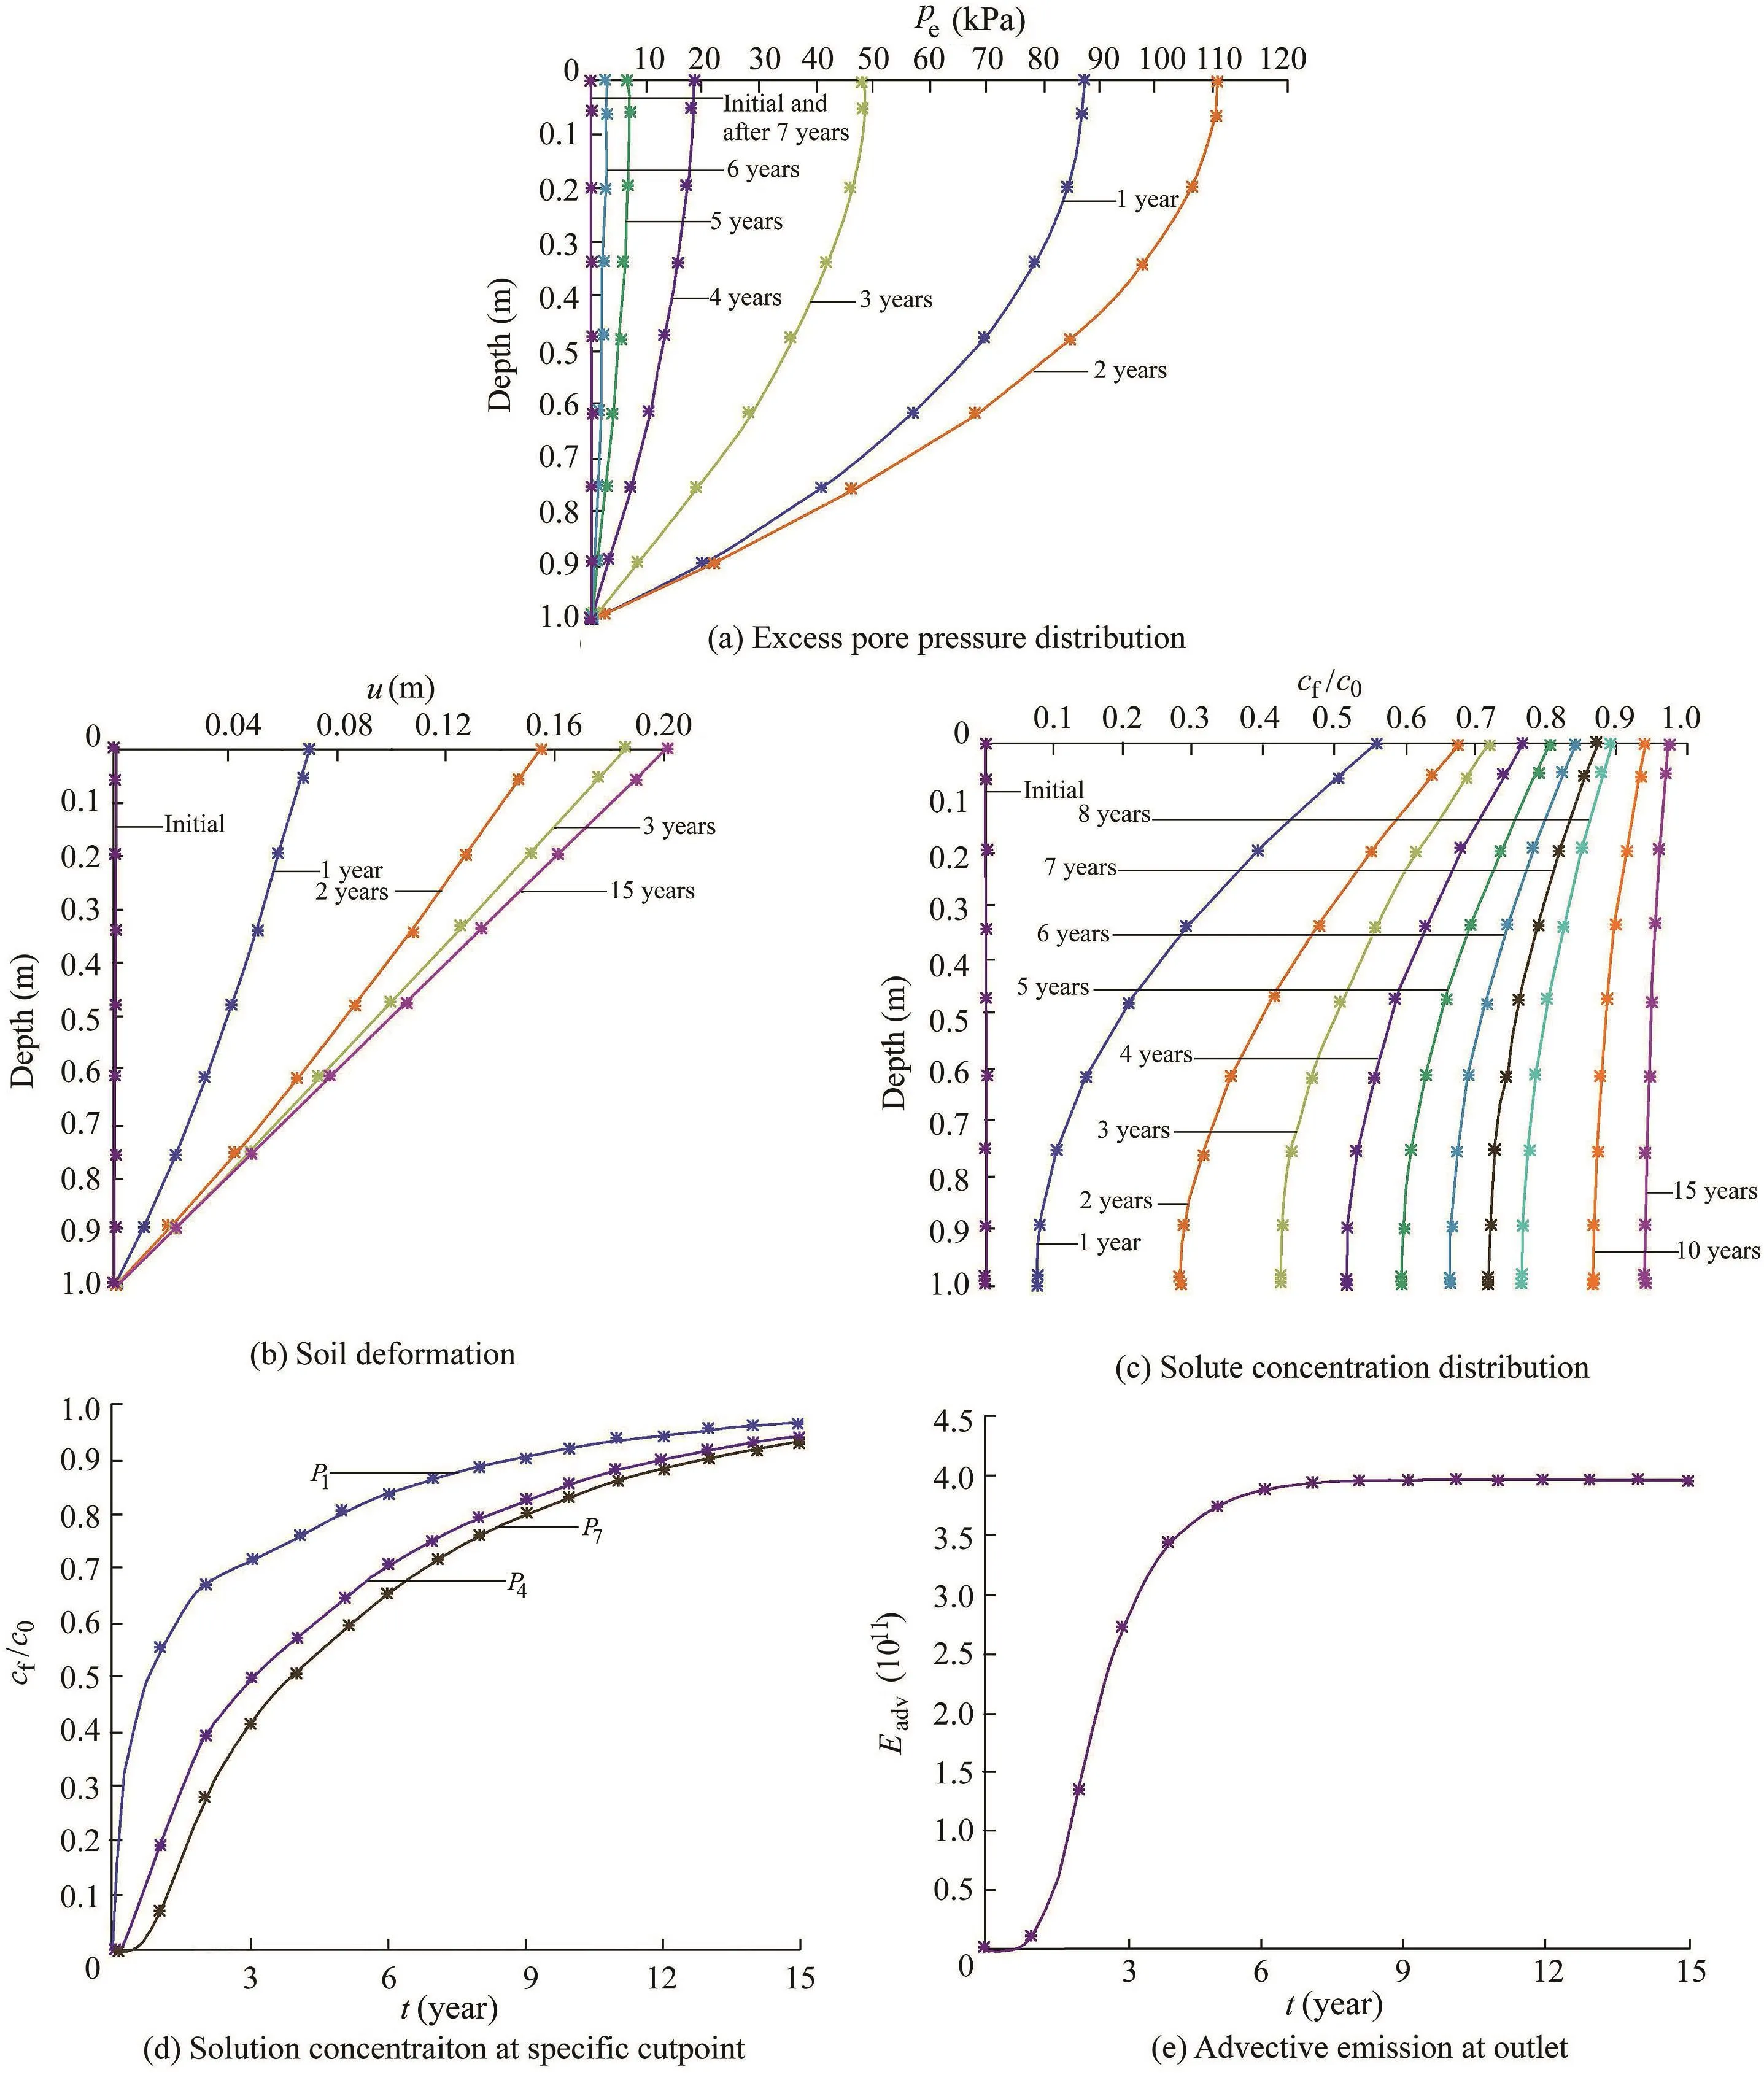
Fig.3.Comparison of modeling results of present three-layer model(*)and SL model in Zhang et al.(2012)(solid line)with Sr=1,L=1/3 m,G=500 kPa,K=1.00×10⁻¹⁰m/s,and Dm=5.00×10⁻⁹m2/s.
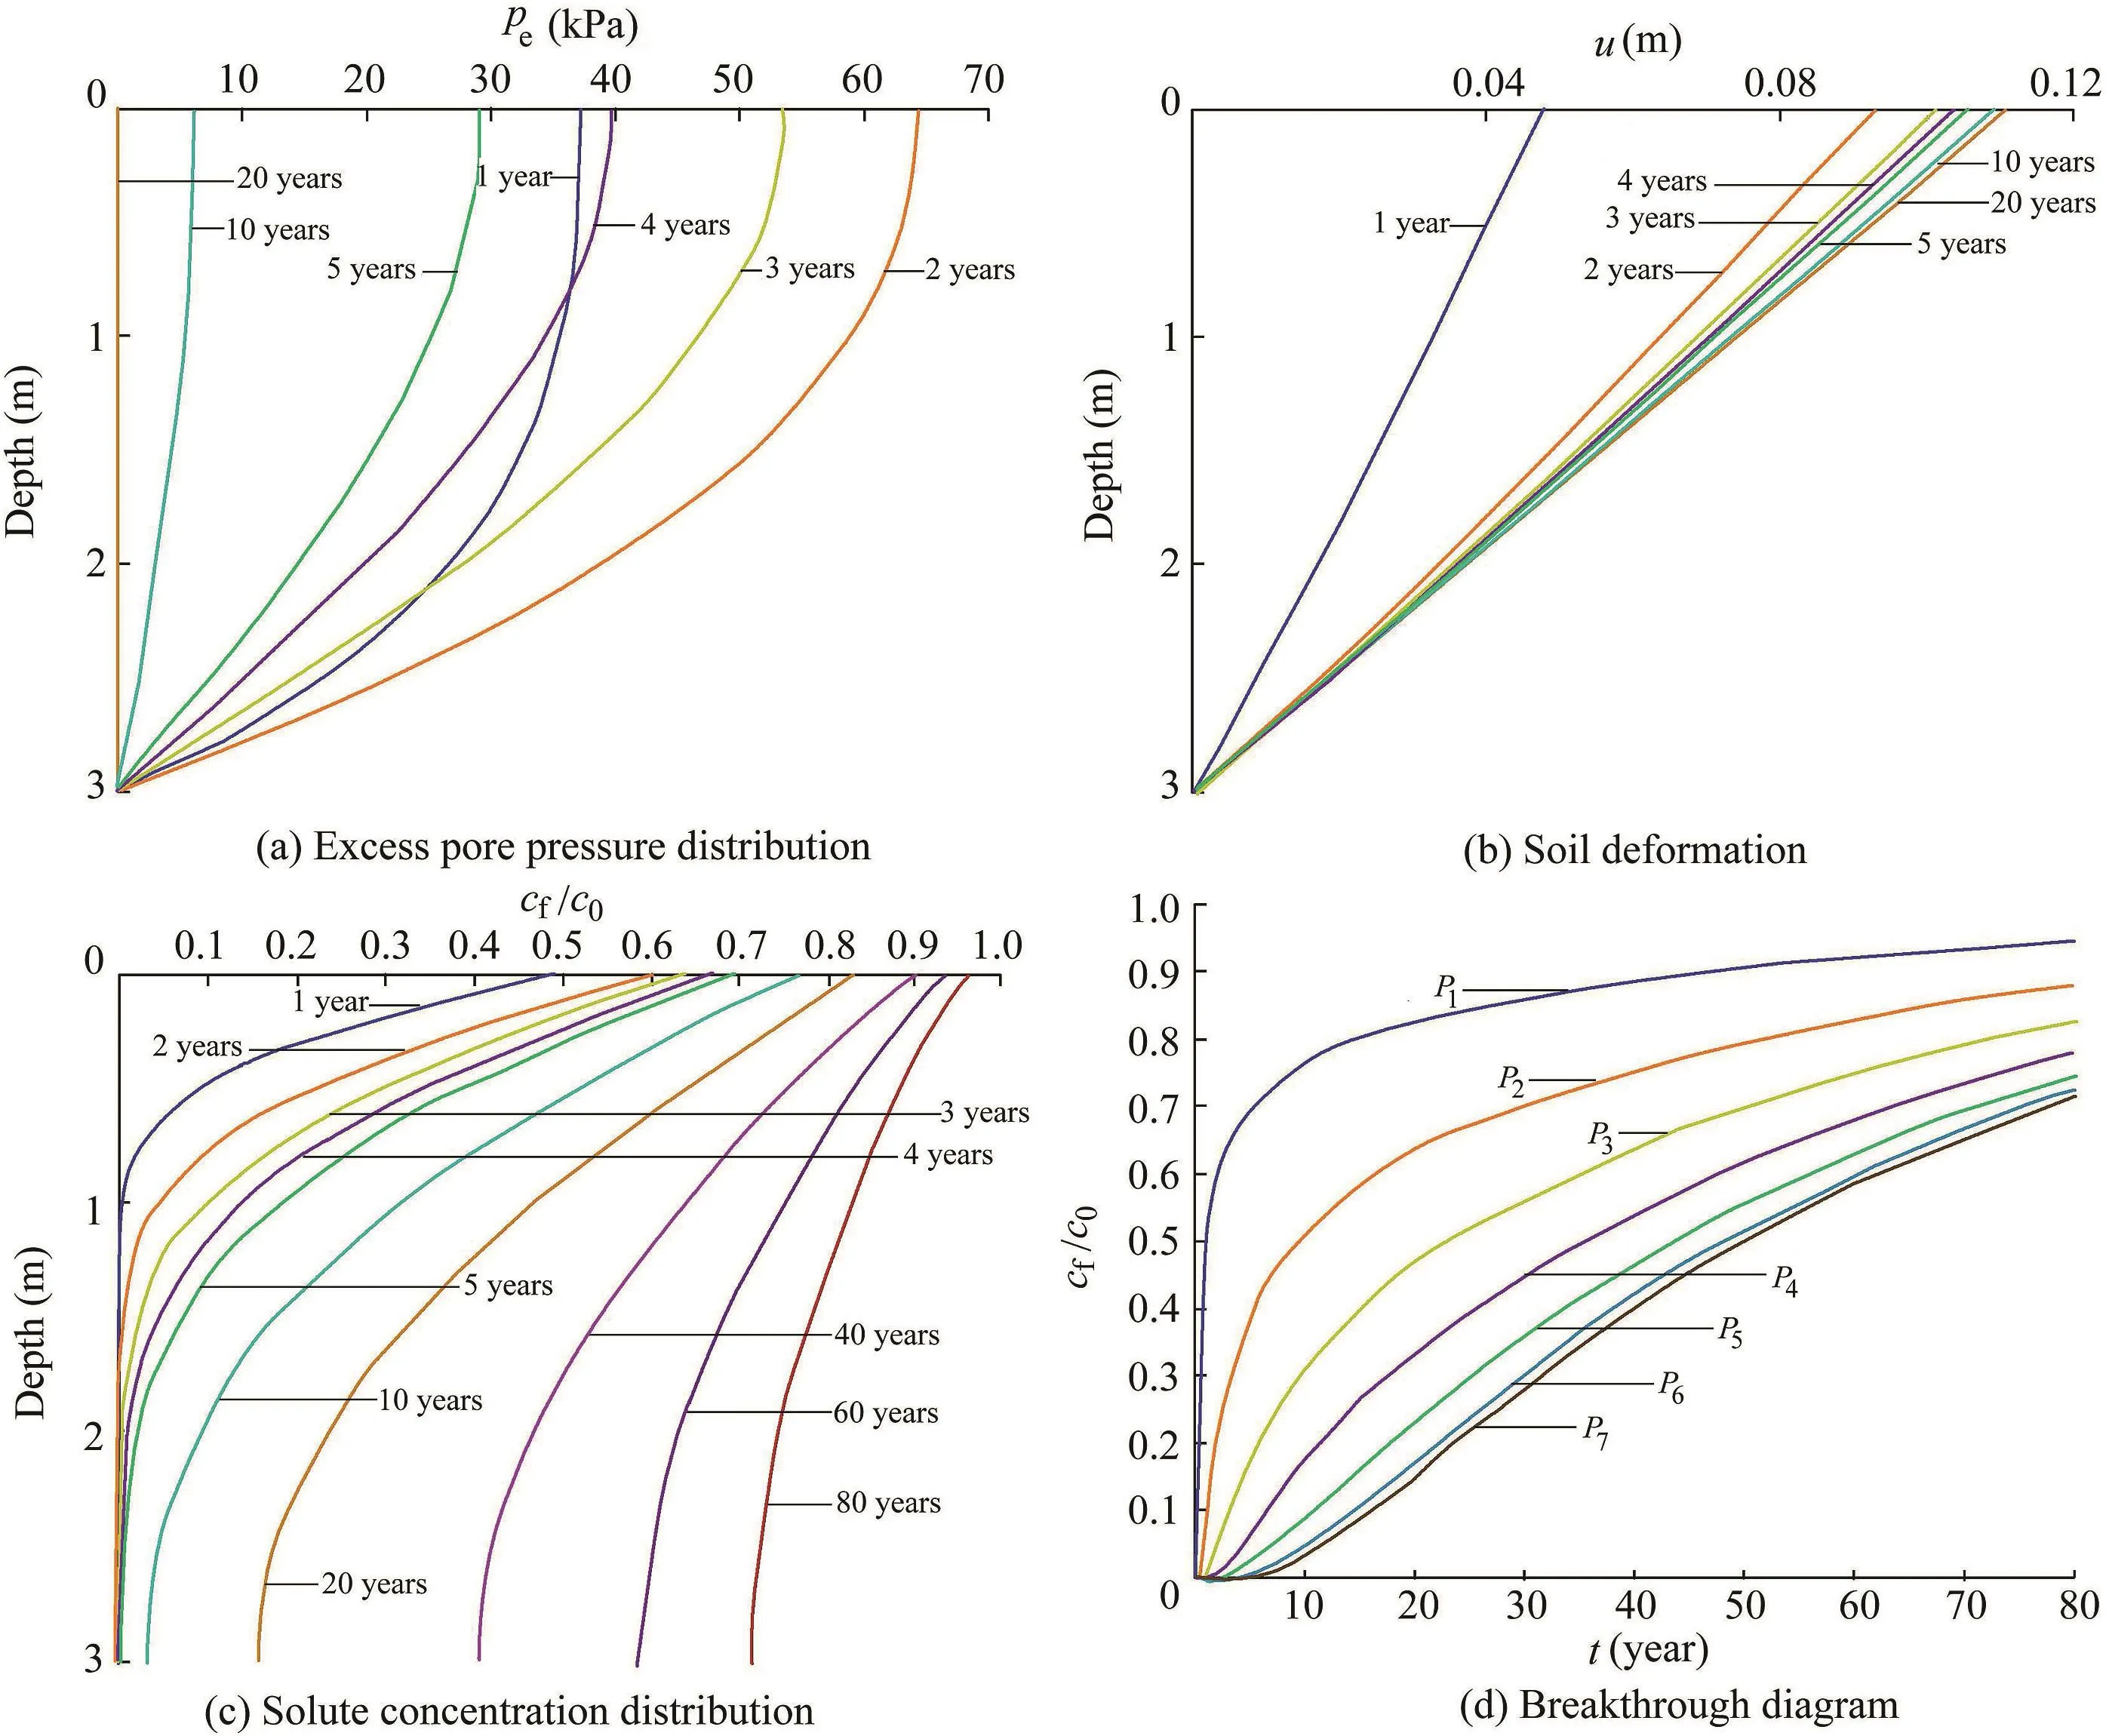
Fig.4.Results of SL model.
The results of the SL model were used as the reference group in the parametric study described below.Figs.5 through 11 provide the results from models A through G,respectively,with the critical results from the SL model plotted against them in dashed lines.When there is no signi ficant difference,the result from the SL model is not presented.
3.2.Effects of hydraulic conductivity
Fig.5 illustrates the soil strati fication effect of the hydraulic conductivity K.The vertical distribution of the excess pore pressure can be observed in Fig.5(a).The first layer with a K value(1.5×10⁻¹¹m/s)smaller than that in the SL model experiences a faster excess pore pressure buildup during the loading period,a slower dissipation process after the load becomes constant,and a higher peak excess pore pressure that occurs at the top surface.The differences are also made up by the lower layers with larger K values during the loading period,with the excess pore pressure at the bottom layer in model A decreasing below what it is in the SL model.Although the middle layer of model A shares the same parameter settings as the SL model,the soil responses are different(e.g.,slope of excess pore pressure,dissipation rate,etc.)due to the joint effects of internal boundary conditions and the relatively thin soil layer.Moreover,a much slower dissipation process can be observed through all three layers.A residual excess pore pressure of more than 3 kPa exists after the whole simulation time of 80 years in model A,whereas it takes less than 20 years for the excess pore pressure to fully dissipate in the homogenous situation.This is mainly due to the low hydraulic conductivity in the top layer that makes it more dif ficult for the excess flow to drain out.Due to the longlasting excess pore pressure,in general,model A shows faster solute transport and an earlier breakthrough(Fig.5(c)and(d)).The time required for the solute concentration at the intersurface of layers 2 and 3(P5in Fig.1)to reach 50%of the referenced solute concentration in the land fill is shortened for nearly 10 years(about 45 years in the SL model,and about 35 years in model A).Furthermore,the hydraulic conductivity has a certain effect on the rate of soil displacement but does not in fluence the final deformation(Fig.5(b)).
3.3.Effects of shear modulus
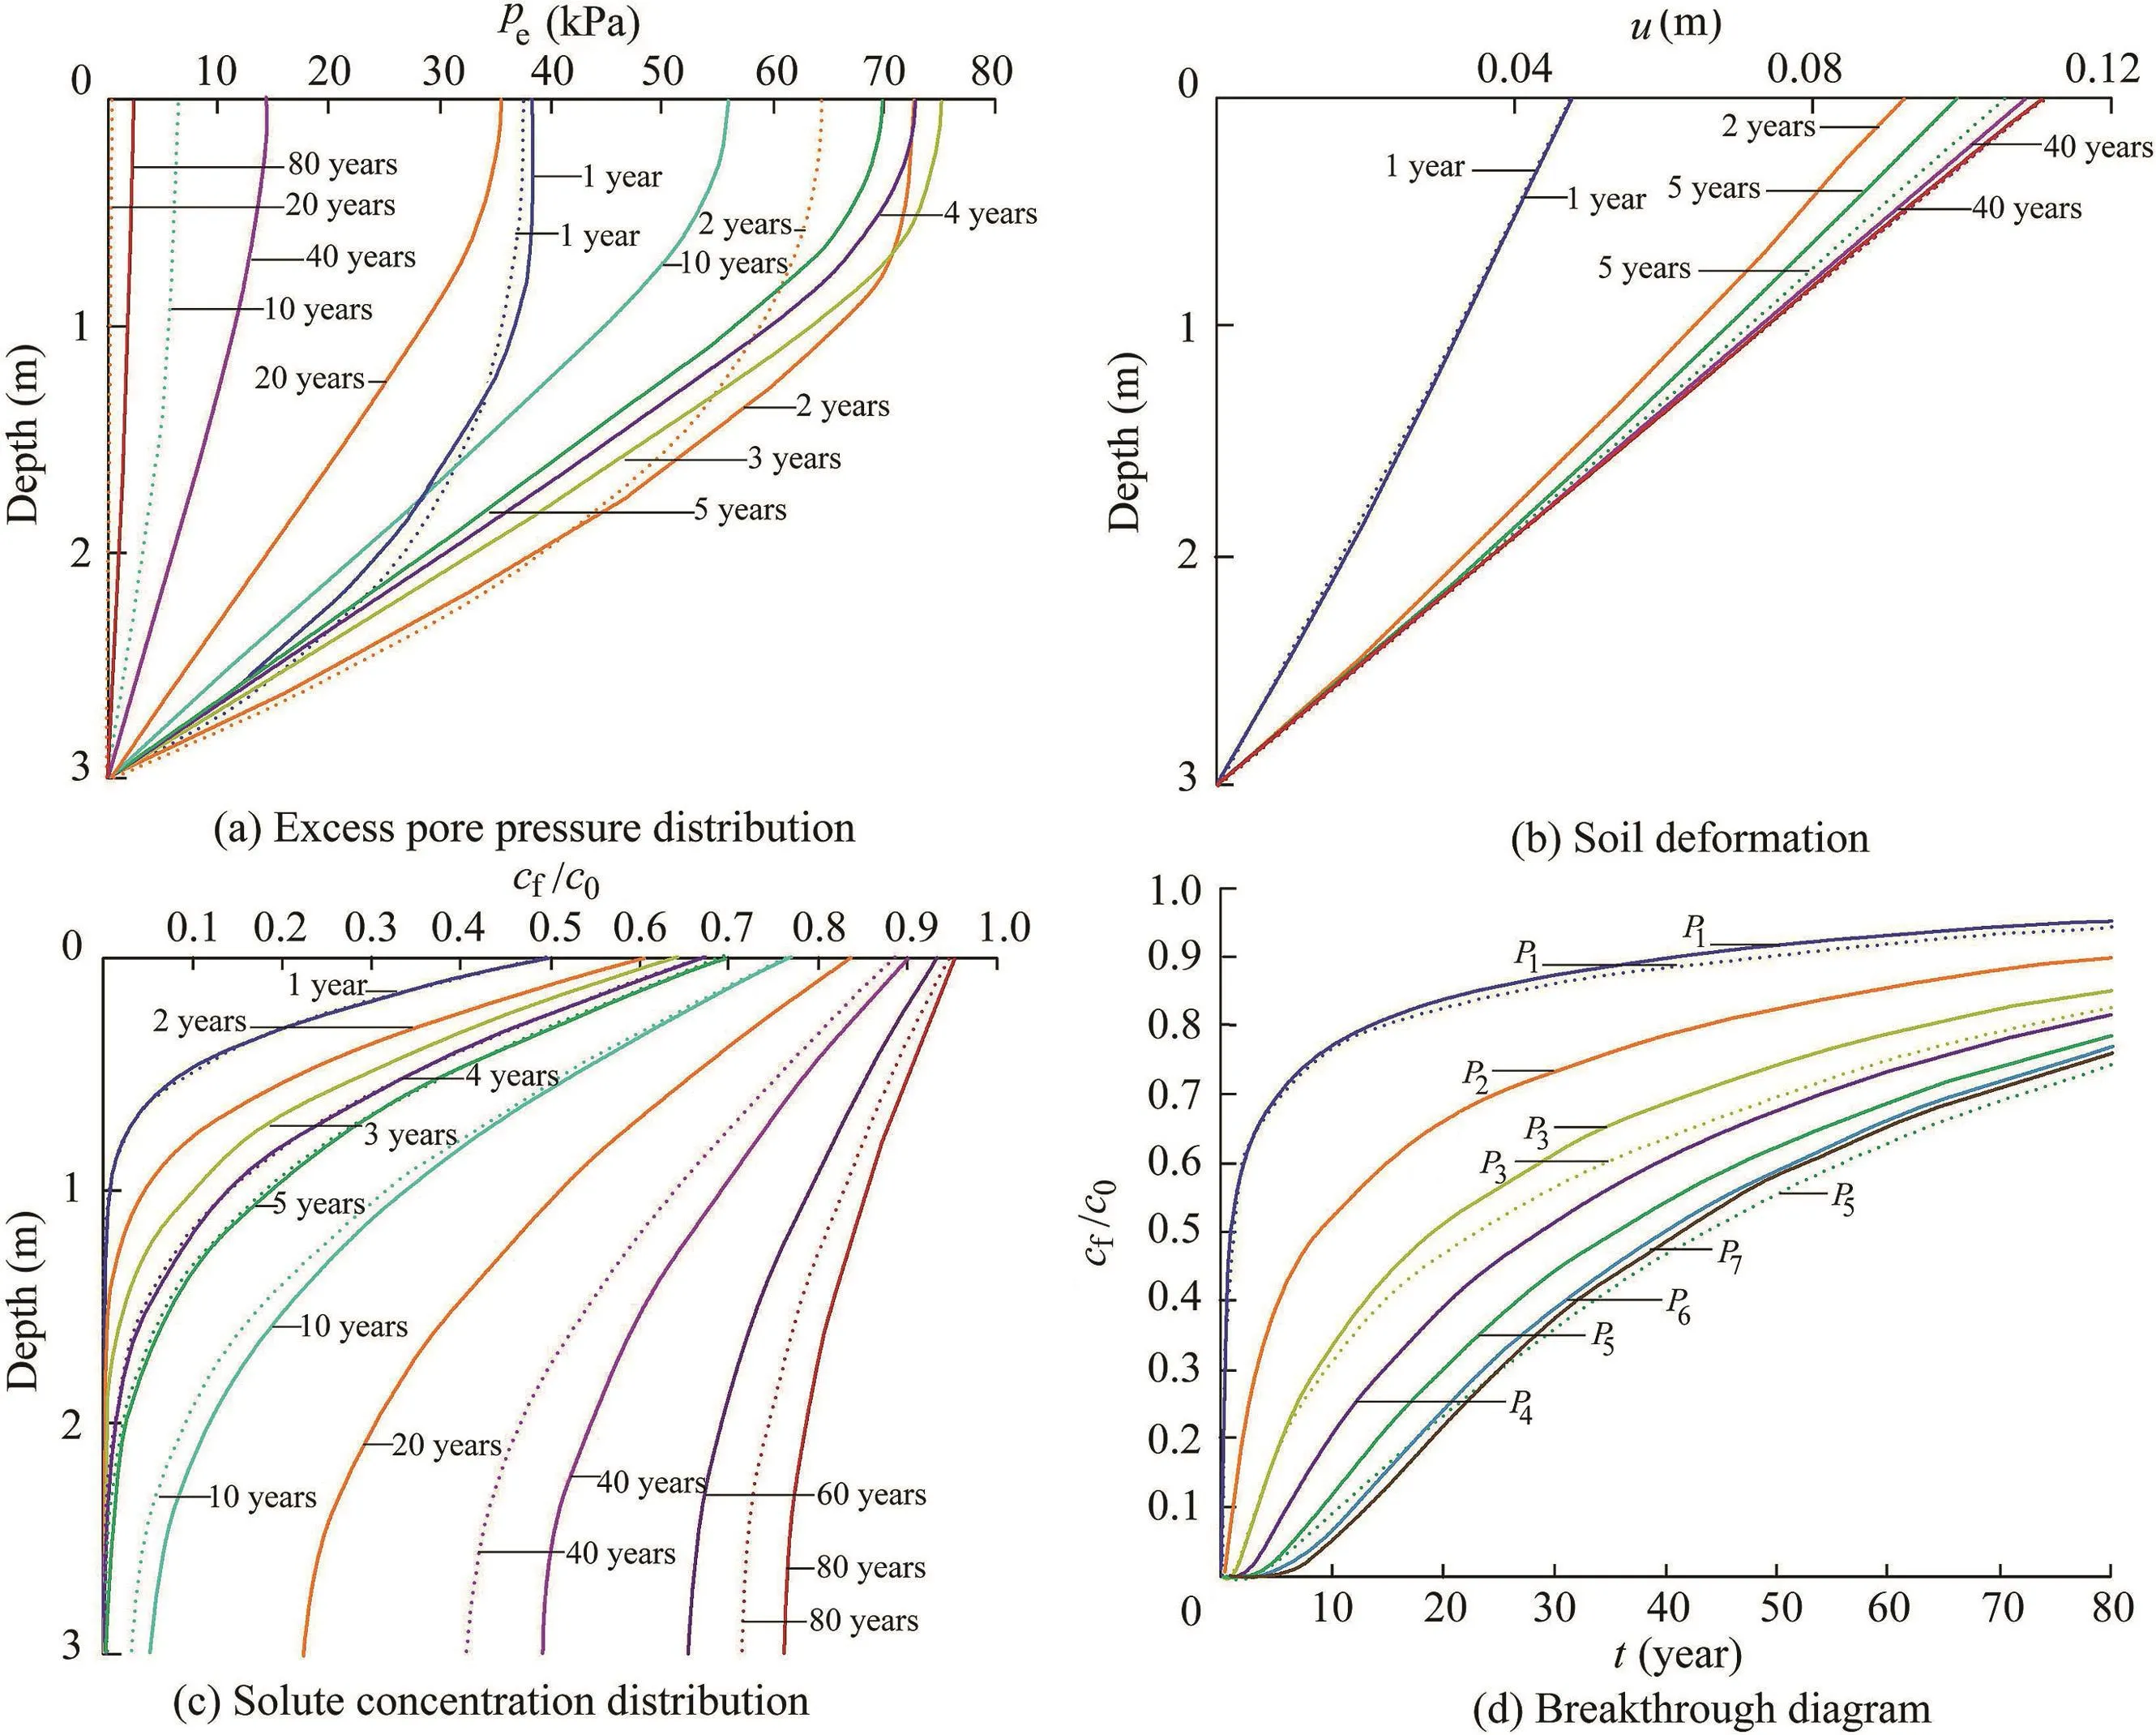
Fig.5.Results of model A with hydraulic conductivity varied for each layer.
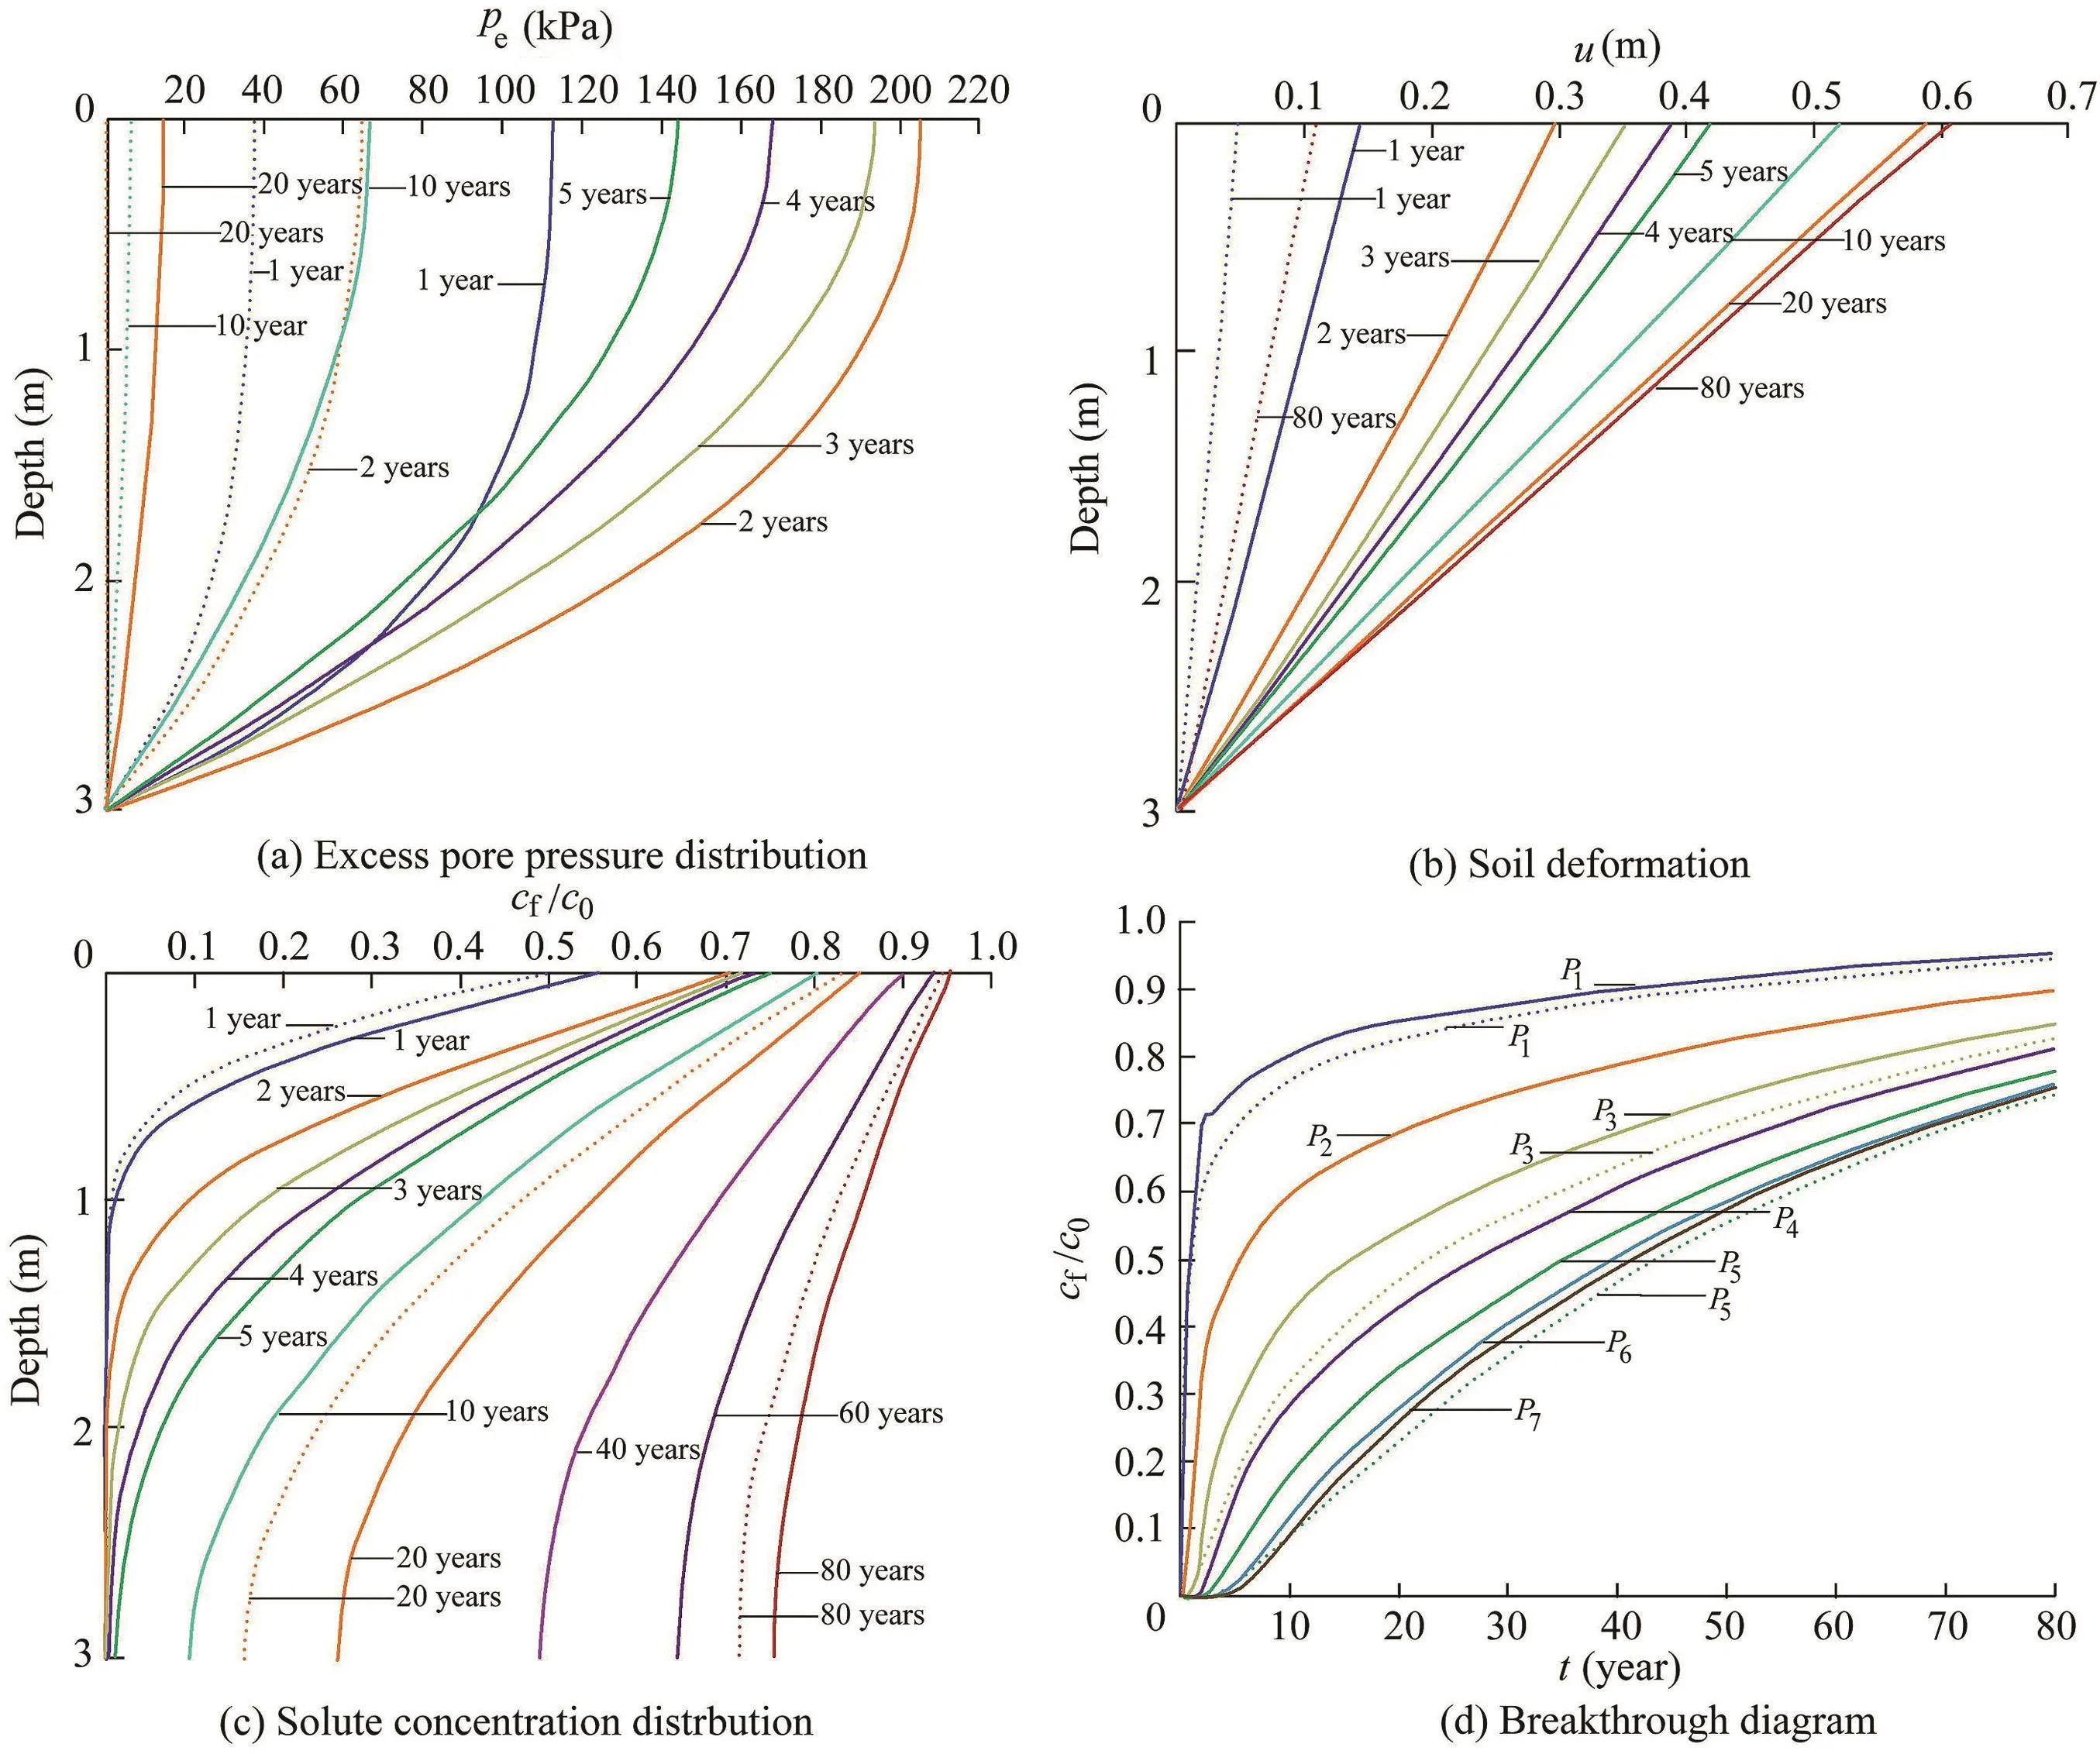
Fig.6.Results of model B with shear modulus varied for each layer.
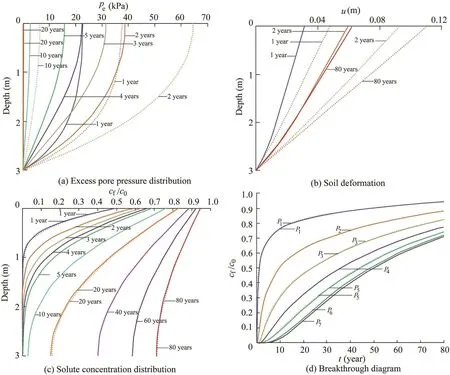
Fig.7.Results of model F with shear modulus for each layer set in a reverse order compared to model B.
The soil strati fication effect from the variation of the shear modulus G was studied and the results are presented in Fig.6.It is well known that the shear modulus plays an important role in soil consolidation and consequently affects the solute transport process.For model B,the shear modulus values in the three layers from top to bottom are 5×10⁵Pa,2.75×106Pa,and 5×10⁶Pa,soft to stiff.Due to a relatively small G in the top layer,the final deformation(around 20%)at the end of the simulation period is about six times larger than that in the SL model(Fig.6(b)).As for the excess pore pressure,its peak value at the inlet boundary increases to more than 200 kPa,and a longer time is required for the excess pore pressure to fully dissipate.Speci fically,at the end of 20 years,the excess pore pressure fully dissipates in the SL model,while a residual excess pore pressure of more than 10 kPa still exists at the top boundary in model B simulation results(Fig.6(a)).This is understandable considering a porous media that is more easily deformed under a load,but in which a relatively low hydraulic conductivity limits the rate of fluid expulsion.Therefore,the pore pressure increases.Finally,due to the high pore pressure and the slow dissipation process,the contaminant migrates at a faster rate,and an earlier breakthrough is detected(Fig.6(c)and(d)).
It seems that the soil properties of the top layer play a more important role in the layered soil behavior and solute transport.To verify this,model F was designed in a reverse order of G for each layer compared to model B,with the soil being most rigid on the top,and the results are shown in Fig.7.Compared to the SL model,the excess pore pressure dissipates more rapidly and less soil deformation is detected.Moreover,during the post-loading stage,the excess pore pressure in model F dissipates and leads to an increment of normal stress,and the top layer is too rigid to show any noticeable deformation.On the other hand,the soil in the bottom layer is soft.Therefore,little deformation is observed(Fig.7(a)and(b)).As for the contaminanttransport,no signi ficanteffectisdetected(Fig.7(c)and(d)).In general,results of model F shows no consistency with those of model B(Fig.(6)).Hence,a conclusion can be drawn that the order of parameter values for each layer will also signi ficantly alter the simulation result.Furthermore,the soil properties of the top layer seem to have a more noticeable effect on the soil response and solute transport process.
3.4.Effects of molecular diffusion coef ficient
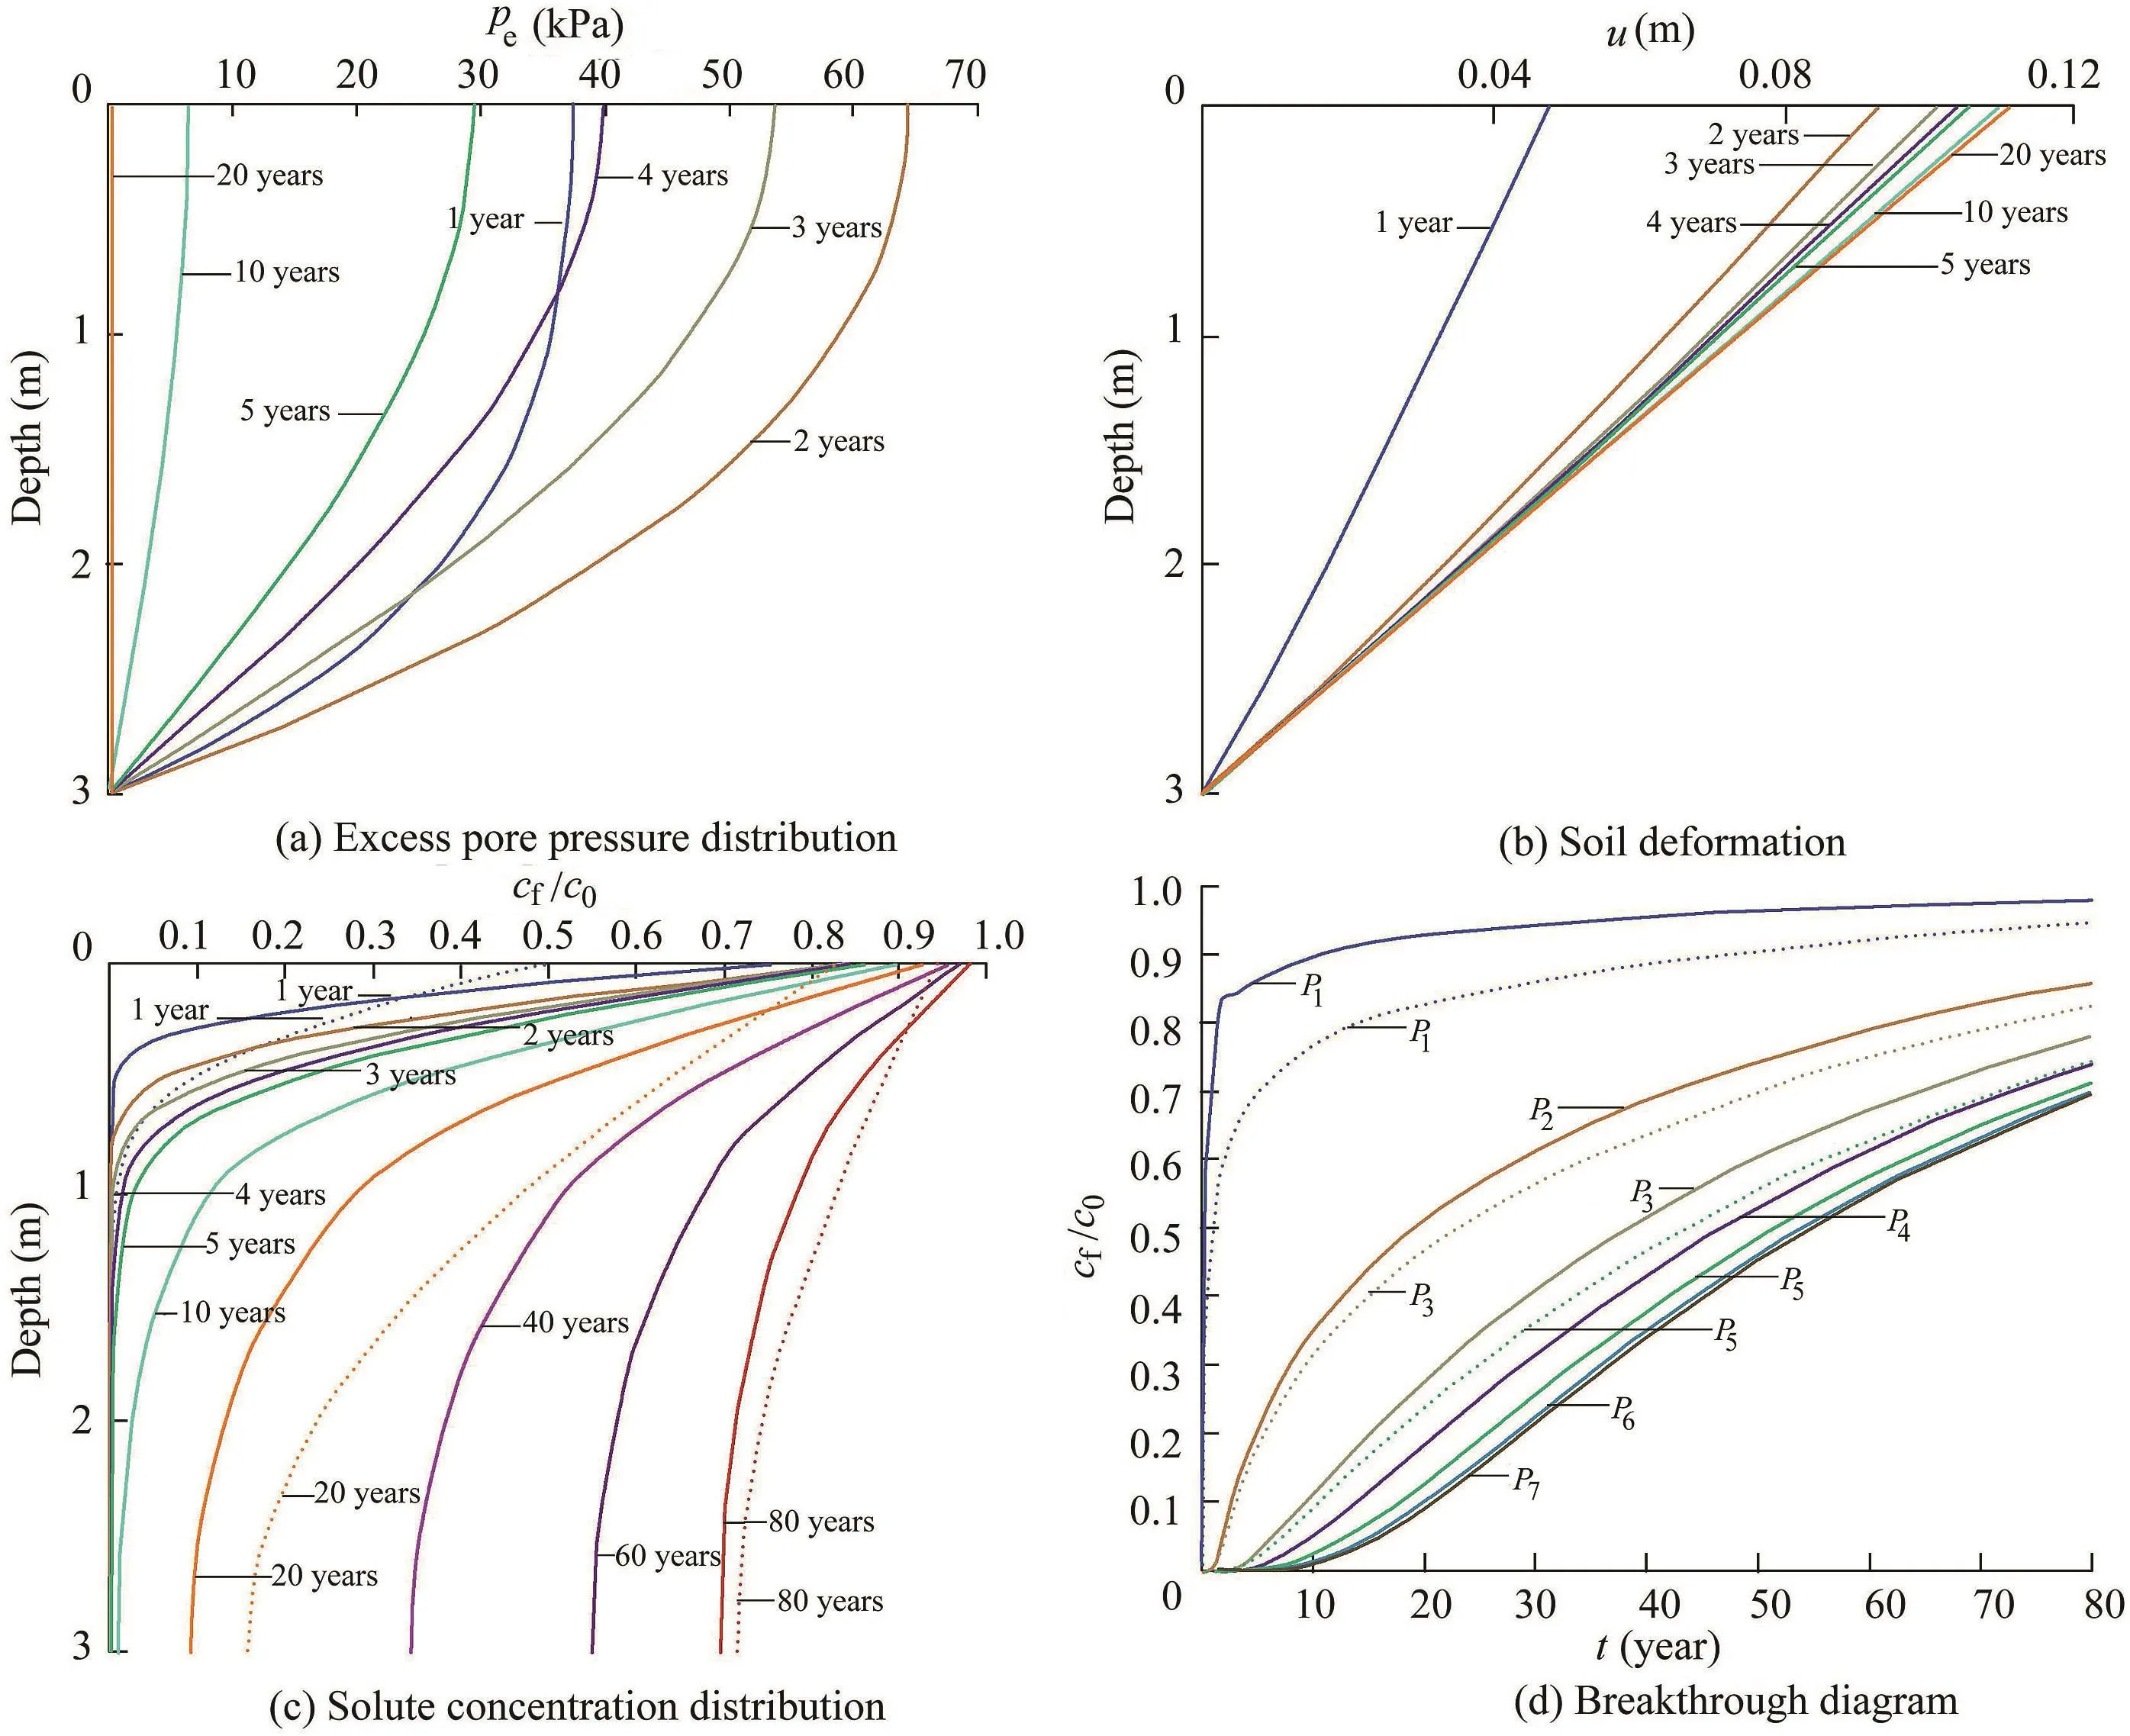
Fig.8.Results of model C with molecular diffusion coef ficient varied for each layer.
In this study,the contaminant transport was considered to be the joint effect of hydrodynamic dispersion and contaminants carried by transient advective flow due to consolidation.In particular,the molecular diffusion(controlled by Dm),one component of the hydrodynamic dispersion,is mainly manifested as particles move from an area of high concentration to an area of low concentration.Compared to the longitudinal dispersion(controlled by αL),in a relatively slow advective flow,the molecular diffusion dominates.The strati fied Dmeffect is demonstrated in model C.Fig.8(a)and(b)illustrate no differences in the consolidation process and transient flow from those in the SL model.This is consistent with the semicoupled computing scheme introduced in section 2.However,the strati fied Dmcontributes to a noticeable deceleration of solute transport even though the concentration at the inlet is greater than that in the SL model.Speci fically,with a smaller Dmin the top soil layer,a greater concentration gradient is obtained according to the top boundary condition of contaminant concentration,which is related to the nature of volatile pollutants diffusing through the geomembrane layer.In addition,Fig.8(c)shows a slower solute spread in model C than in the SL model,especially in the top layer.Although the differences are narrowed by the larger Dmin the bottom layer,a later breakthrough time and smaller concentration in model C are shown in Fig.8(c)and(d).These findings are consistent with the conclusion in section 3.3 that the factors of the top layer are more critical than those of the lower soil layers with the same layer thickness.
3.5.Effects of degree of saturation and Poisson's ratio
Fig.9 shows that different degrees of saturation Srin each layer result in a vital impact on the excess pore pressure evaluation,especially on the top layer where the soil is less saturated compared to the SL model.However,there is a very limited effect on the soil deformation and almost no in fluence on the solute transport process.This result reveals the rationality of the assumption made earlier for a constant Srduring the consolidation process.With the variance of Srin each layer,the fluid compressibility varies,contributing to the excess pore pressure differences between model D and the SL model.
Like the shear modulus,Poisson's ratio ν is an important factor in the soil deformation.To be speci fic,ν is a measurement of the material expansion that is perpendicular to the direction of compression.Compared to the SL model,a smaller Poisson's ratio in the top layer in model E allows less transverse expansion.According to Fig.10,for a strati fied ν distribution,greater excess pore pressure and soil deformation are observed.
3.6.Effects of thickness of each layer
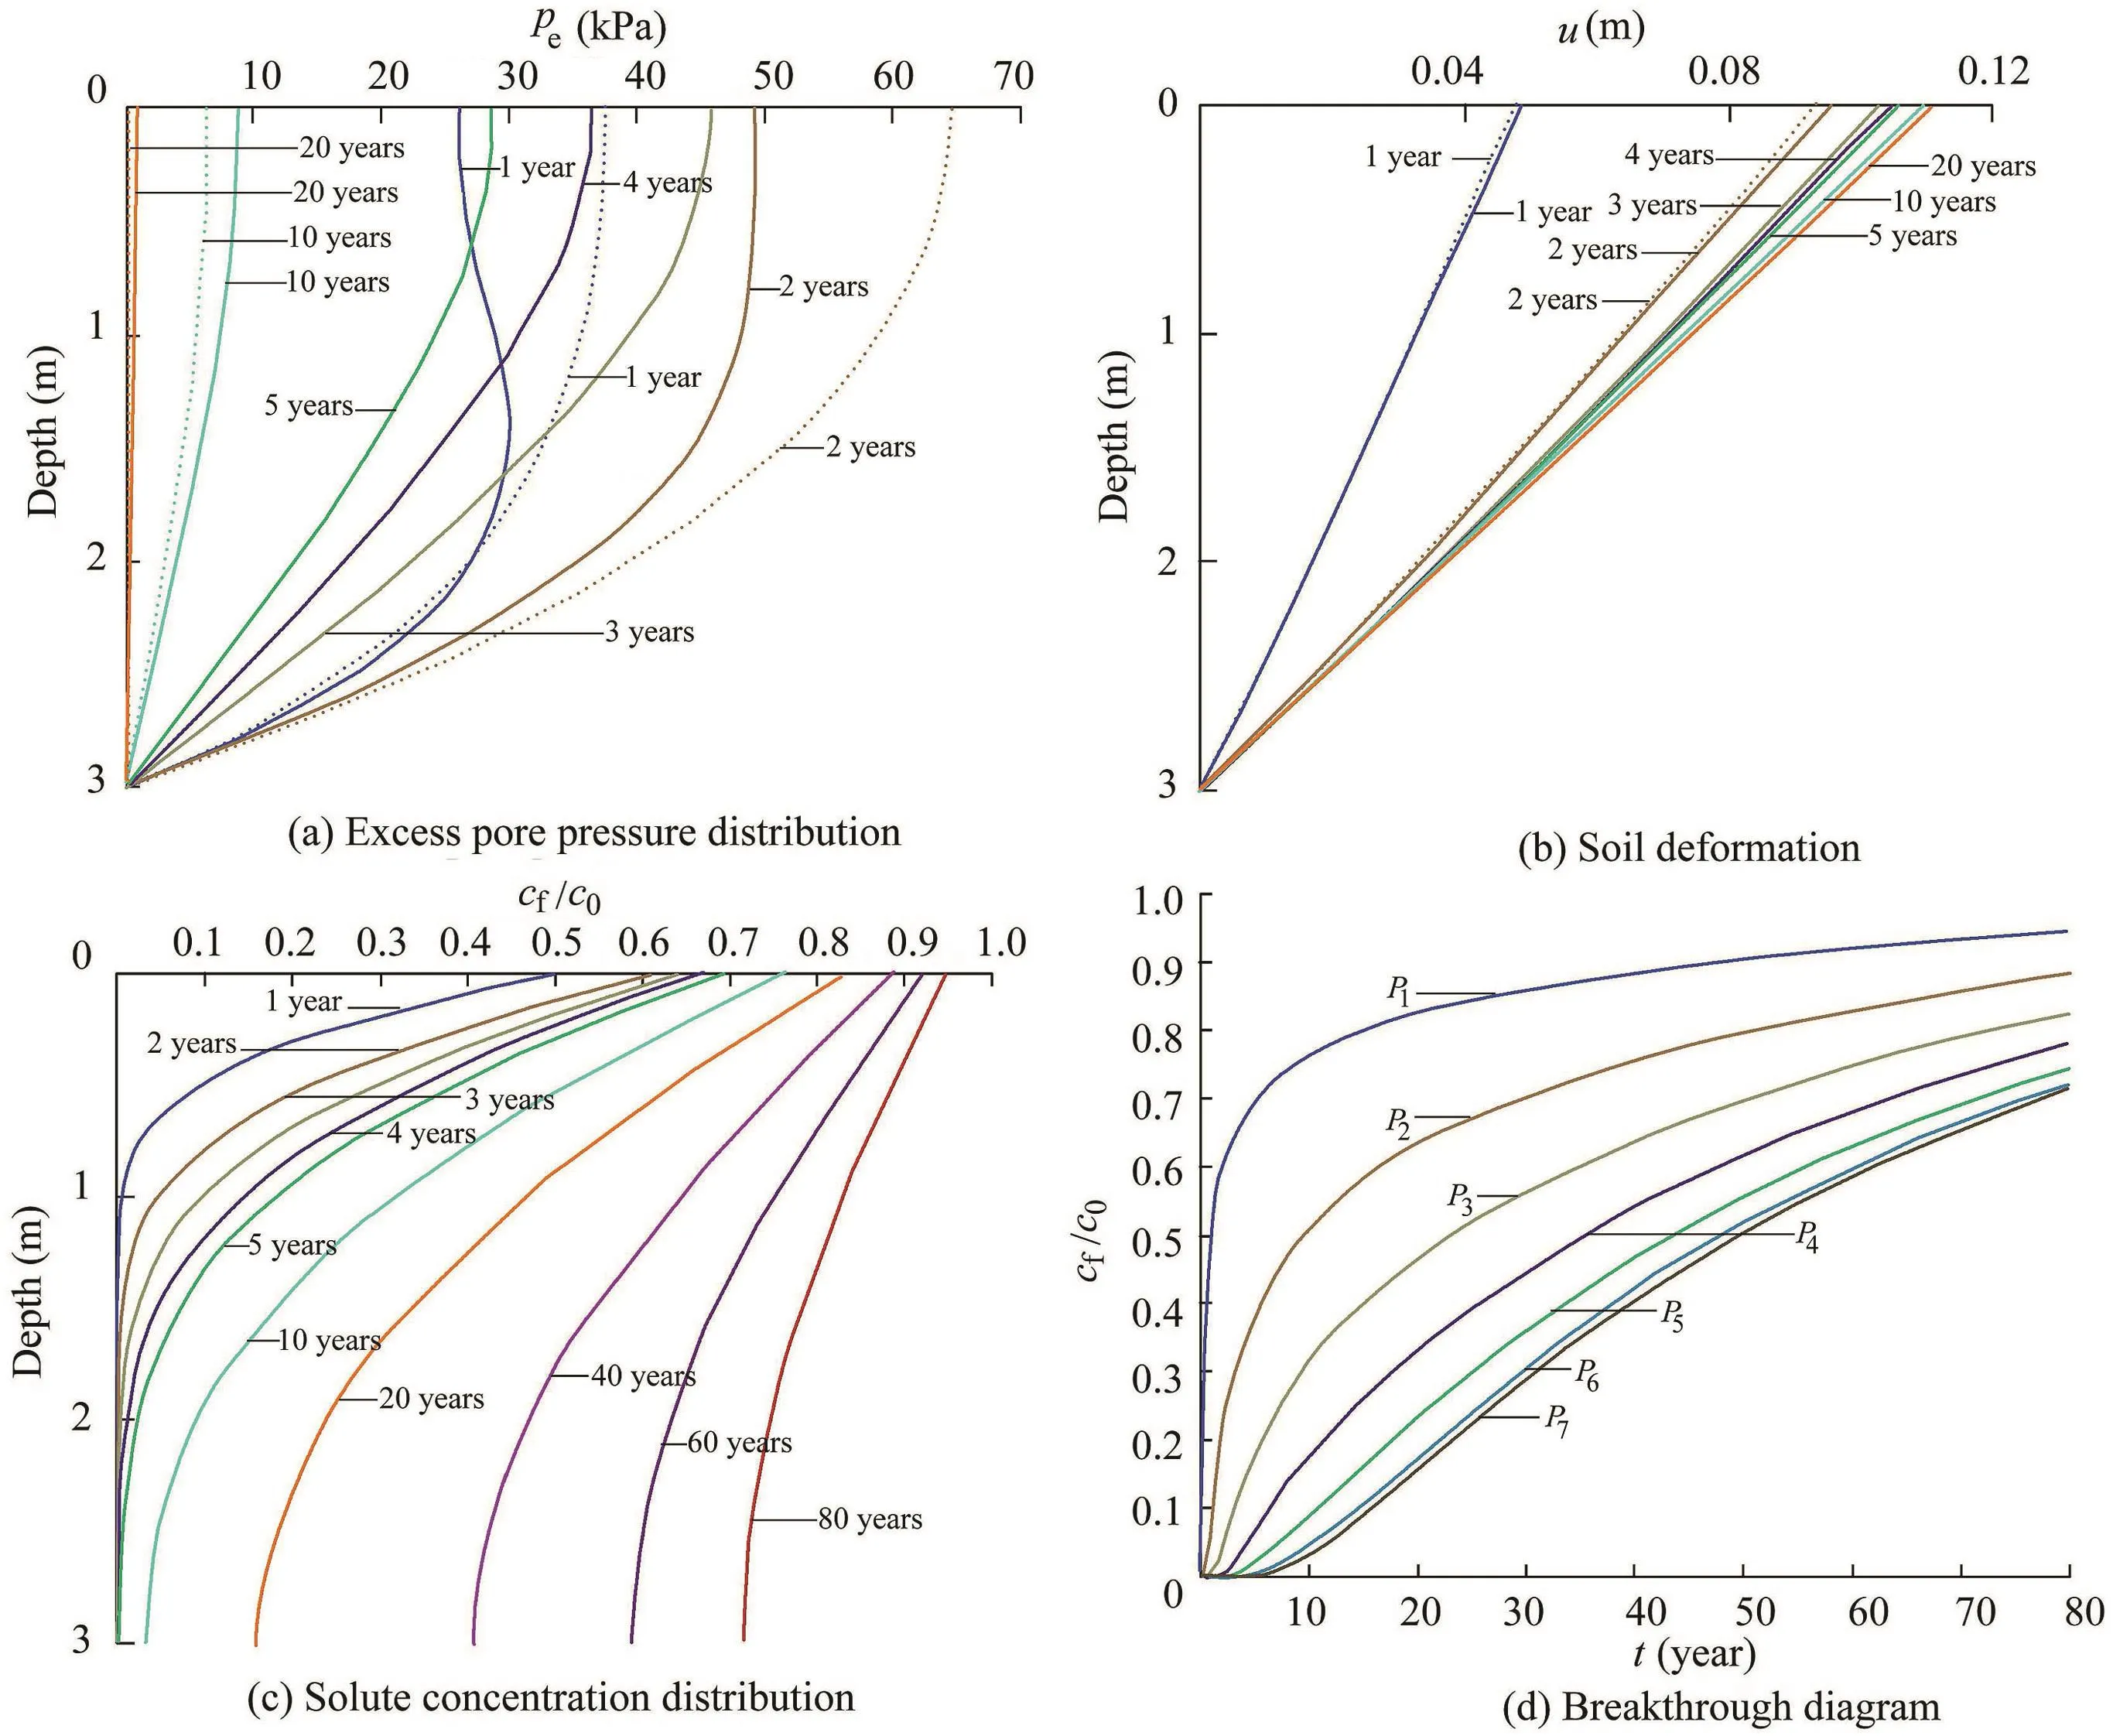
Fig.9.Results of model D with degree of saturation varied for each layer.
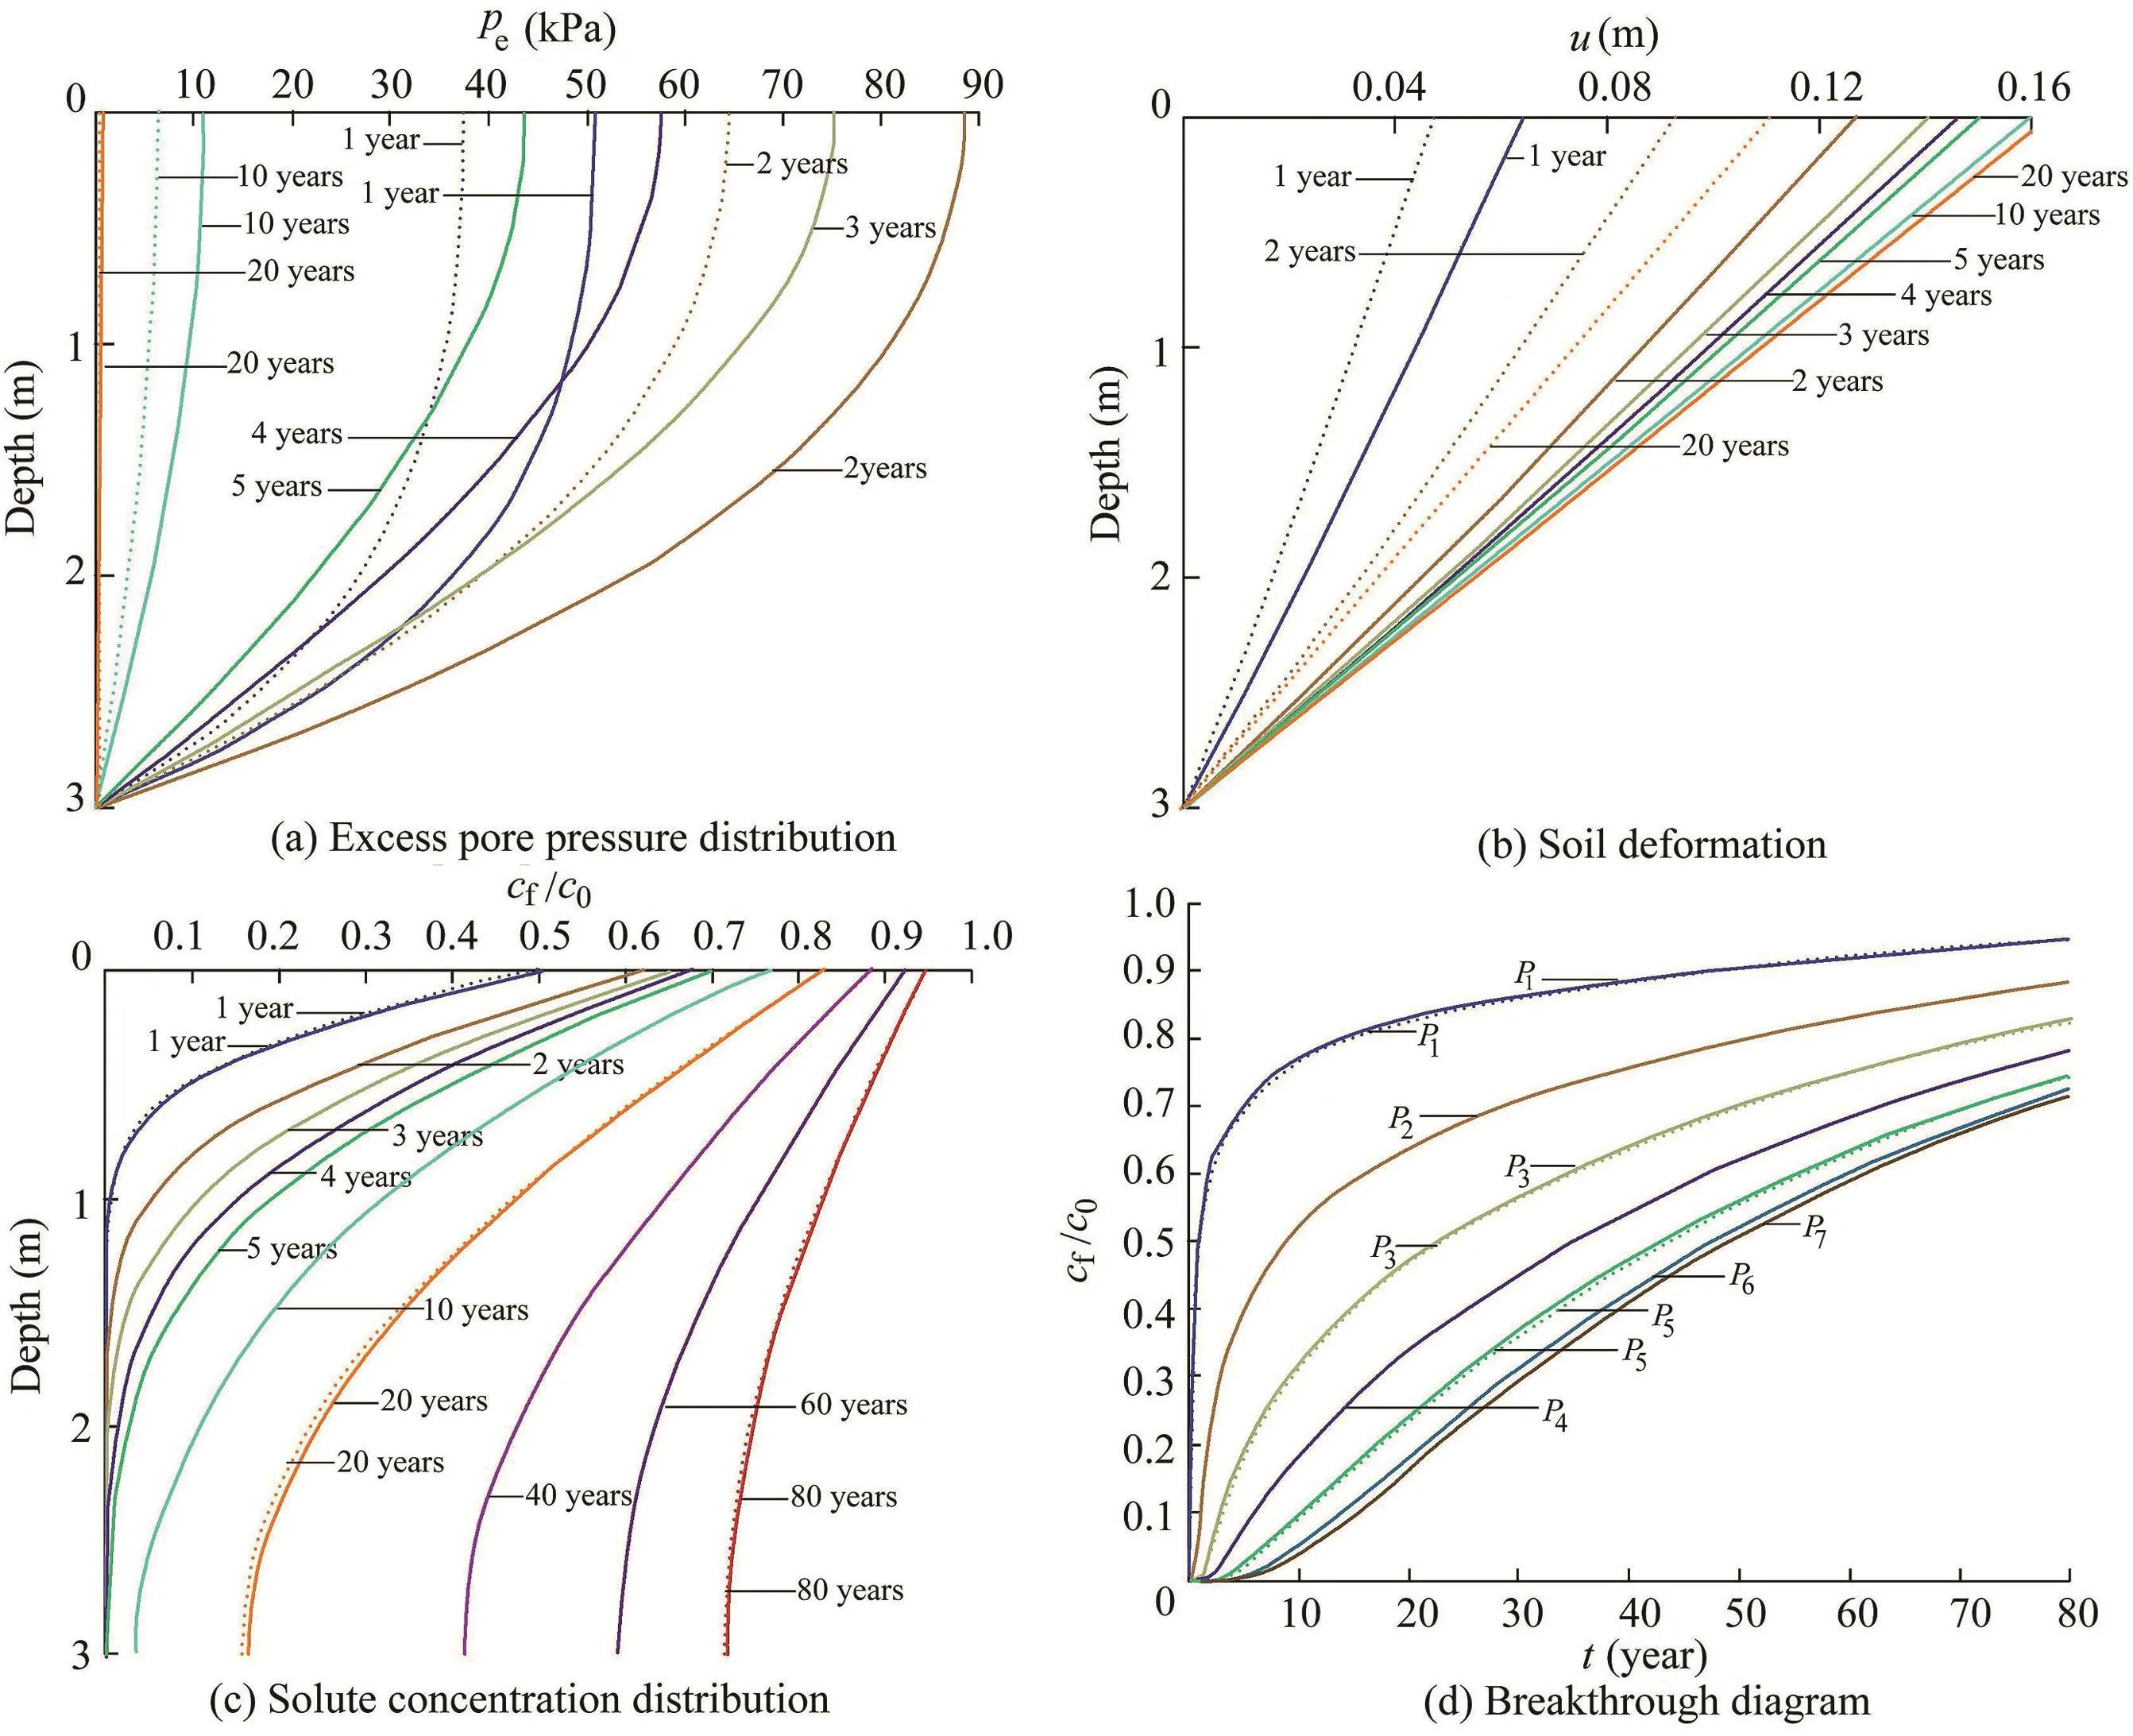
Fig.10.Results of model E with Poisson's ratio varied for each layer.
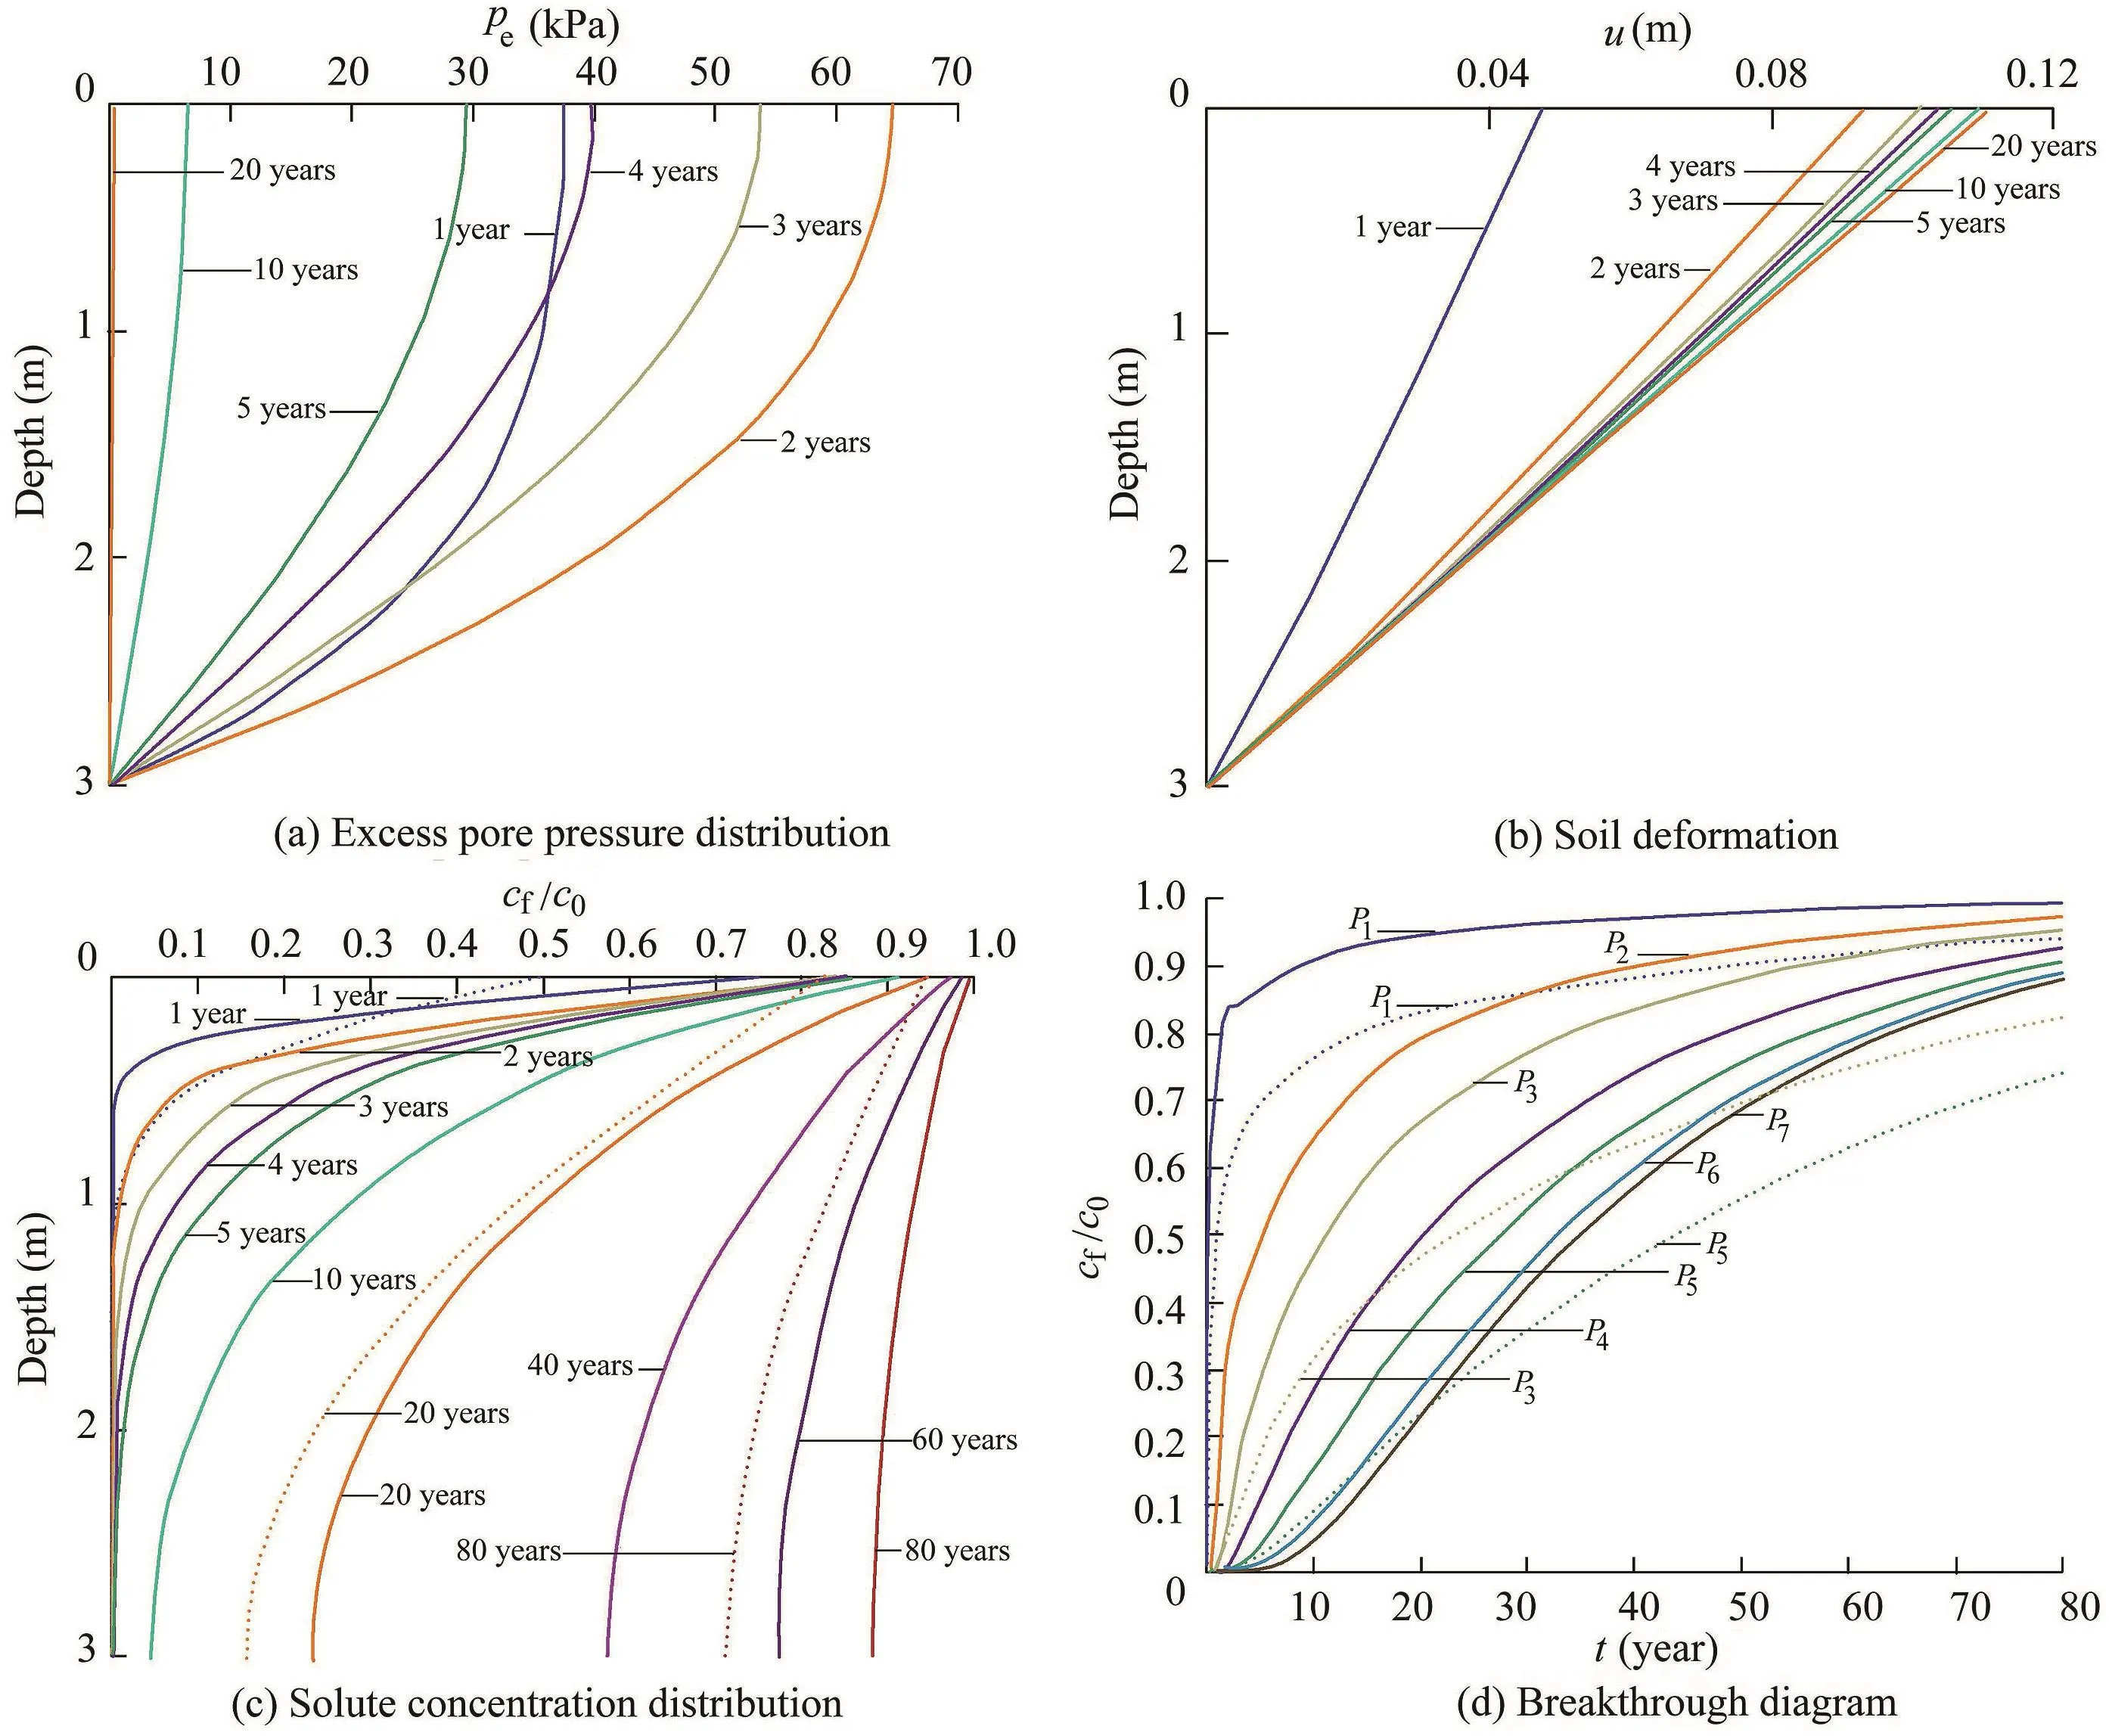
Fig.11.Results of model G with layer thickness and molecular diffusion coef ficient varied for each layer.
The soil strati fication effect in terms of the thickness of each layer was also tested.Model G utilized the same parameter setting as model C but adjusted the thickness for each layer so that they were 0.5 m,1.0 m,and 1.5 m,respectively.As discussed in section 3.4,the molecular diffusion coef ficient does notin fluencetheconsolidationprocess.Therefore,modelGand the SL model show no differences in terms of the excess pore pressure and soil vertical deformation(Fig.11(a)and(b)).However,in contrast to the results of model C,with a thin top layer and a small molecular diffusion coef ficient,the contaminant spreads faster in model G than in the SL model.Fig.11(c)illustrates higher contaminant concentration through all three layers,and Fig.11(d)indicates an earlier breakthrough time in model G.This is attributed to the high diffusion coef ficient in the bottom layer,of which the thickness is three times the top layer.In sections 3.3 and 3.4,a conclusion has been drawn that the modeling results are likely to be dominated by the parameters in the top layer.However,the control of soil thickness alters the results and provides an option in practice where the top layer condition is not desirable.
3.7.Average flow velocity and advective emission
To further examine the consolidation-induced advective flow,the average flow velocity at the bottom boundary for each model is plotted in Fig.12(a).It can be calculated as the summation of Darcy's velocity and the solid phase velocity:

The vfvalues for the SL model,model C,and model G are the same,since the variation of Dmonly affects solute transport but has no impact on soil consolidation.The peak νffor all models occurs at around two years,when the post-loading stage is about to begin.Model B,with the varied shear modulus,shows a faster transient advective flow,with a peak flow velocity more than twice as large as that of the SL model.Moreover,the transient excess flow lasts longest(more than 80 years)in model A,where a low hydraulic conductivity is assumed in the first layer(Fig.12(a)).This is consistent with the results in Fig.5,in which the excess pore pressure does not fully dissipate at the end of the simulation time.These transient excess flows triggered by soil consolidation show considerable in fluence on the solute transport.The effects can be observed from the advective emission(Eadv)as summarized in Fig.12(b).Eadvcan be calculated as(Zhang et al.,2012)

where τ is the independent variable of integration.
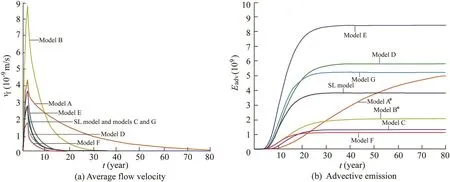
Fig.12.Average flow velocity and advective emission for all models(*means that the values of Eadvfor models A and B are multiplied by 10-2 for the convenience of comparison).
When a zero concentration gradient is assumed at the bottom outlet,no diffusion takes place and only advective flow occurs.Thus,the advective emission at each bottom boundary refers to the cumulative contaminant mass out flow,particularly due to the advective flow.Fig.12(b)presents the advective emission at each bottom boundary.As previously discussed,for some models(D,E,and F),the controlled parameters seem to have no discernible effects on the transit time needed for the contaminant to migrate through the soil layers or the solute breakthrough time.However,the advective emissions re flect noticeable differences compared to an averaged homogenous single-layer situation.According to Fig.12(a),a faster advective transient flow may lead to a greater emission flux.As for the SL model and models C and G,although the transient active flow shows no differences,the emission flux varies due to the individual molecular diffusion process.After the consolidation process ends(at around 35 years for model B and 15-25 years for the others),Eadvreaches its maximum and remains constant,except for model A,in which Eadvcontinues to accumulate.Furthermore,model B shows the fastest advective emission accumulation rate due to the high transient flow rate(vf).The largest advective emission occurs in model A,mainly due to its long-lasting consolidation process and higher excess pore pressure within voids.
4.Conclusions
In this study,a layered model for the solute transport in a deformable porous media was established.The model included a small level of soil deformation.The multi-layer model was veri fied with an earlier single-layer model(Zhang et al.,2012).With the new model,we further examined the multi-layer effectsonthesolutiontransportthroughaparametricstudy.Based onthenumericalexamplespresented,thefollowingconclusions can be drawn:
(1)The multi-layer effects in terms of the hydraulic conductivity,shear modulus,degree of saturation,molecular diffusion coef ficient,and Poisson's ratio were described.The thickness of each layer was also demonstrated to be a contributing factor to the soil consolidation and contaminant migration process.
(2)For equal-thickness multi-layer soil with the boundary condition set up as in this study,the soil properties in the top layer are more critical than in the layers below.Moreover,the alternation of the soil layer thickness has noticeable effect on both consolidation and solute transport results.
(3)Although some of the parameter-strati fied variations show only a limited effect on the solute transfer or breakthrough time,all parameter heterogeneity as examined in this study is proven to have a certain effect on the advective emission flux.
In summary,it is vital to correctly model a multi-layer soil matrix instead of simply replacing it with a homogenous situation with averaged soil pro files.This paper provides guidance for designing a land fill site subject to a multi-layer soil environment.Selection of the appropriate construction site or proper treatment(such as field compaction)of the natural soil,especially the top layer,may reduce costs and better control the contaminated degree.
Acknowledgements
The authors gratefully acknowledge the support of the Grif fith University Research Service Team and the use of the High Performance Computing Cluster Gowonda to complete this research.The first author is thankful for the support of the Grif fith University International Postgraduate Research Scholarship and the Grif fith University Postgraduate Research Scholarship.
Alshawabkeh,A.N.,Rahbar,N.,Sheahan,T.C.,Tang,G.P.,2004.Volume change effects in solute transport in clay under consolidation.In:Geo Jordan 2004:Advances in Geotechnical Engineering with Emphasis on Dams,Highway Materials,and Soil Improvement.ASCE,pp.105-115.https://doi.org/10.1061/40735(143)9.
Barry,D.A.,1992.Modelling contaminant transport in the subsurface:Theory and computer programs.In:Ghadiri,H.,Rose,C.W.(Eds.),Modelling Chemical Transport in Soil:Natural and Applied Contaminants.Lewis Publishers,Boca Raton,pp.105-144.
Bear,J.,1972.Dynamics of Fluids in Porous Media.Elsevier Scienti fic Publishing Company,New York.
Biot,M.A.,1941.General theory of three-dimensional consolidation.J.Appl.Phys.12(2),155-164.https://doi.org/10.1063/1.1712886.
Boso,F.,Bellin,A.,Dumbser,M.,2013.Numerical simulations of solute transport in highly heterogeneous formations:A comparison of alternative numerical schemes.Adv.Water Resour.52,178-189.https://doi.org/10.1016/j.advwatres.2012.08.006.
Craig,J.R.,Rabideau,A.J.,2006.Finite difference modeling of contaminant transport using analytic element flow solutions.Adv.Water Resour.29(7),1075-1087.https://doi.org/10.1016/j.advwatres.2005.08.010.
Ellsworth,T.,Jury,W.,1991.A three-dimensional field study of solute transport through unsaturated,layered,porous media,2:Characterization of vertical dispersion.Water Resour.Res.27(5),967-981.https://doi.org/10.1029/91WR00190.
Fityus,S.G.,Smith,D.W.,Booker,J.R.,1999.Contaminant transport through an unsaturated soil liner beneath a land fill.Can.Geotech.J.36(2),330-354.https://doi.org/10.1139/t98-112.
Fox,P.,2007a.Coupled large strain consolidation and solute transport,I:Model development.J.Geotechnical Geoenvironmental Eng.133(1),3-15.https://doi.org/10.1061/(ASCE)1090-0241(2007)133:1(3).
Fox,P.,2007b.Coupled large strain consolidation and solute transport,II:Modelveri fication and simulation results.J.GeotechnicalGeoenvironmental Eng.133(1),16-29.https://doi.org/10.1061/(ASCE)1090-0241(2007)133:1(16).
Fredlund,D.,Rahardjo,H.,1993.Soil Mechanics for Unsaturated Soils.Wiley,New York.
Kumar,P.,Dodagoudar,G.,2010.Meshfree analysis of two-dimensional contaminant transport through unsaturated porous media using EFGM.Int.J.Numer.Meth.Biomed.Eng.26(12),1797-1816.https://doi.org/10.1002/cnm.1266.
Leij,F.J.,Van Genuchten,M.T.,1995.Approximate analytical solutions for solute transport in two-layer porous media.Transp.Porous Media 18(1),65-85.https://doi.org/10.1007/BF00620660.
Li,Y.-C.,Cleall,P.J.,2011.Analytical solutions for advective dispersive solute transport in double-layered finite porous media.Int.J.Numer.Anal.Meth.Geomech.35(4),438-460.https://doi.org/10.1002/nag.903.
Liu,C.,Ball,W.P.,Ellis,J.H.,1998.An analytical solution to the onedimensional solute advection-dispersion equation in multi-layer porous media.Transp.Porous Media 30(1),25-43.https://doi.org/10.1023/A:1006596904771.
Peters,G.P.,Smith,D.W.,2001.Numerical study of boundary conditions for solute transport through a porous medium.Int.J.Numer.Anal.Meth.Geomech.25(7),629-650.https://doi.org/10.1002/nag.145.
Peters,G.P.,Smith,D.W.,2002.Solute transport through a deforming porous medium.Int.J.Numer.Anal.Meth.Geomech.26(7),683-717.https://doi.org/10.1002/nag.219.
Potter,L.J.,Savvidou,C.,Gibson,R.E.,1994.Consolidation and Pollutant Transport Associated with Slurried Mineral Waste Disposal.University of Cambridge,Cambridge.
Pu,H.,Fox,P.J.,2016a.Consolidation-induced contaminant transport in multi-layer soils.In:Fourth Geo-China International Conference.ASCE,pp.1-8.https://doi.org/10.1061/9780784480045.001.
Pu,H.,Fox,P.J.,2016b.Model for coupled large strain consolidation and solute transport in layered soils.Int.J.Geomech.16(2),04015064.https://doi.org/10.1061/(ASCE)GM.1943-5622.0000539.
Rolle,M.,Hochstetler,D.,Chiogna,G.,Kitanidis,P.K.,Grathwohl,P.,2012.Experimental investigation and pore-scale modeling interpretation of compound-speci fic transverse dispersion in porous media.Transp.Porous Media 93(3),347-362.https://doi.org/10.1007/s11242-012-9953-8.
Sharma,P.,Sawant,V.,Shukla,S.K.,Khan,Z.,2014.Experimental and numerical simulation of contaminant transport through layered soil.Int. J. Geotech. Eng. 8(4), 345-351. https://doi.org/10.1179/1939787913Y.0000000014.
Smith,D.W.,2000.One-dimensional contaminant transport through a deforming porous medium:Theory and a solution for a quasi-steady-state problem.Int.J.Numer.Anal.Meth.Geomech.24(8),693-722.https://doi.org/10.1002/1096-9853(200007)24:8<693::AID-NAG91>3.0.CO;2-E.Wallace,G.B.,Otto,W.C.,1964.Differential settlement at selfridge air force base.J.Soil Mech.Found.Div.90(5),197-220.
Wang,Q.,Zhan,H.,2015.On different numerical inverse Laplace methods for solute transport problems.Adv.Water Resour.75,80-92.https://doi.org/10.1016/j.advwatres.2014.11.001.
Zhang,H.J.,Jeng,D.-S.,Seymour,B.R.,Barry,D.A.,Li,L.,2012.Solute transport in partially-saturated deformable porous media:Application to a land fill clay liner.Adv.Water Resour.40,1-10.https://doi.org/10.1016/j.advwatres.2012.01.007.
Zhang,H.J.,Jeng,D.-S.,Barry,D.A.,Seymour,B.R.,Li,L.,2013.Solute transport in nearly saturated porous media under land fill clay liners:A finite deformation approach.J.Hydrol.479,189-199.https://doi.org/10.1016/j.jhydrol.2012.11.063.
*Corresponding author.
E-mail address:d.jeng@grif fith.edu.au(Dong-sheng Jeng).
Peer review under responsibility of Hohai University.
杂志排行
Water Science and Engineering的其它文章
- Simulation of flow pattern at rectangular lateral intake with different dike and submerged vane scenarios
- Experimental and theoretical study of coupled in fluence of flow velocity increment and particle size on particle retention and release in porous media
- Flow patterns and critical criteria of thermally strati fied shear flow in braided rivers
- Fate of nitrogen in subsurface in filtration system for treating secondary ef fluent
- Application of SWAT99.2 to sensitivity analysis of water balance components in unique plots in a hilly region
- Assessment of future climate change impacts on hydrological behavior of Richmond River Catchment
