我国基层医疗卫生机构卫生资源配置的公平性研究
2017-10-24王媛媛刘薇薇韩建军
王媛媛,刘薇薇*,韩建军
1.100191北京市,北京大学第三医院第二门诊部2.100053北京市,中国全科医学杂志社
·热点研究·
我国基层医疗卫生机构卫生资源配置的公平性研究
王媛媛1,刘薇薇1*,韩建军2
1.100191北京市,北京大学第三医院第二门诊部2.100053北京市,中国全科医学杂志社
目的探讨2012—2015年我国基层医疗卫生机构卫生资源配置的发展趋势及公平性,为后续研究和卫生政策制定提供依据。方法以2013年《中国卫生统计年鉴》和2014—2016年《中国卫生和计划生育统计年鉴》为资料来源,收集2012—2015年我国及各经济区基层医疗卫生机构数、床位数及卫生技术人员数。分析我国基层医疗卫生机构卫生资源配置情况及变化趋势,并采用基尼系数和泰尔指数进行公平性分析。结果2012—2015年,我国基层医疗卫生增长了8 150个机构、89 572张床位及205 950名卫生技术人员,年均增长率分别为0.30%、2.21%及3.24%。2012—2015年我国基层医疗卫生机构数的基尼系数分别为0.192、0.191、0.192、0.191;泰尔指数分别为0.066 2(区域内贡献率比区域间贡献率:58.91%比41.09%)、0.066 6(57.81%比42.19%)、0.066 6(57.81%比42.19%)、0.066 2(58.36%比41.64%)。我国基层医疗卫生机构床位数的基尼系数分别为0.166、0.168、0.174、0.178;泰尔指数分别为0.054 8(53.55%比46.45%)、0.057 1(52.79%比47.21%)、0.061 1(51.32%比48.68%)、0.063 1(52.12%比47.88%)。我国基层医疗卫生机构卫生技术人员数的基尼系数分别为0.089、0.096、0.091、0.090;泰尔指数分别为0.013 2(86.20%比13.80%)、0.014 9(78.73%比21.27%)、0.013 1(77.60%比22.40%)、0.013 0(73.99%比26.01%)。结论我国基层医疗卫生机构卫生资源配置的总体公平性较好,且卫生技术人员数的公平性优于机构数和床位数,但区域内差异大于区域间差异,建议注重各区域内部的基层医疗卫生机构卫生资源配置的公平性。
初级卫生保健;卫生保健公平提供;基尼系数;泰尔指数
王媛媛,刘薇薇,韩建军.我国基层医疗卫生机构卫生资源配置的公平性研究[J].中国全科医学,2017,20(28):3451-3456.[www.chinagp.net]
WANG Y Y,LIU W W,HAN J J.Equity of health resource distribution in primary healthcare institutions in China[J].Chinese General Practice,2017,20(28):3451-3456.
基层医疗卫生机构是国家医疗卫生体系的重要基石,是保障居民健康需求的首要环节。在2016年中共中央 国务院印发的《“健康中国2030”规划纲要》中,提出了“坚持以基层为重点”“建立覆盖城乡居民的中国特色基本医疗卫生制度”的战略主题及目标[1]。公平性是卫生服务研究领域的重要议题之一,也是决定医疗体系改革成败的关键问题之一[2]。然而,目前国内关于基层医疗卫生机构卫生资源配置情况及公平性的研究,资料来源多局限于早年全国年鉴数据或某个局部区域的统计数据[3-4],缺乏对全国范围内公平性最新趋势的探索和分析。鉴于此,本研究通过查阅近几年卫生年鉴数据,分析了2012—2015年我国基层医疗卫生机构卫生资源配置的发展趋势及公平性,以期为后续研究的开展和卫生政策的制定提供参考依据。
1 资料与方法
1.1 资料来源 本研究数据来源于2013年《中国卫生统计年鉴》[5]和2014—2016年《中国卫生和计划生育统计年鉴》[6-8]。
1.2 方法


1.3 经济区划分方法 采用国务院发展研究中心于2005年公布的全国八大综合经济区的划分标准,(1)东北:辽宁、吉林、黑龙江;(2)北部沿海:北京、天津、河北、山东;(3)东部沿海:上海、江苏、浙江;(4)南部沿海:福建、广东、海南;(5)黄河中游:陕西、山西、河南、内蒙古;(6)长江中游:湖北、湖南、江西、安徽;(7)大西南:云南、贵州、四川、重庆、广西;(8)大西北:甘肃、青海、宁夏、西藏、新疆[15]。
1.4 统计学方法 采用Excel 2007软件进行双录入、数据核查以及描述性统计分析。
2 结果
2.1 全国基层医疗卫生机构卫生资源配置的基本情况 2012—2015年,我国基层医疗卫生增长了8 150个机构、89 572张床位、205 950名卫生技术人员,年均增长率分别为0.30%、2.21%、3.24%;每万人口拥有基层医疗卫生资源数量分别增长了-0.03个机构、0.09张床位、1.25名卫生技术人员,年均增长率分别为-2.33%、2.03%、2.67%(见表1)。2012—2015年,我国各类型基层医疗卫生机构中,村卫生室占69.57%~71.60%,乡镇/街道卫生院占4.06%~4.13%,社区卫生服务中心/站占3.68%~3.73%,其他(门诊部、医务室、护理站等)占20.59%~22.65%(见表2)。
2.2 基尼系数的公平性分析 2012—2015年,我国基层医疗卫生机构数的基尼系数分别为0.192、0.191、0.192、0.191,床位数的基尼系数分别为0.166、0.168、0.174、0.178,卫生技术人员数的基尼系数分别为0.089、0.096、0.091、0.090(见图1)。
2.3 泰尔指数的公平性分析
2.3.1 泰尔指数 2012—2015年,我国基层医疗卫生机构数的泰尔指数分别为0.066 2、0.066 6、0.066 6、0.066 2,床位数的泰尔指数分别为0.054 8、0.057 1、0.061 1、0.063 1,卫生技术人员数的泰尔指数分别为0.013 2、0.014 9、0.013 1、0.013 0(见图2)。其中,我国北部沿海基层医疗卫生机构数、床位数、卫生技术人员数的泰尔指数分别为0.056 9~0.062 2、0.102 8~0.106 2、0.018 9~0.030 7;东北地区基层医疗卫生机构数、床位数、卫生技术人员数的泰尔指数分别为0.017 1~0.019 7、0.000 2~0.001 2、0.001 8~0.004 8(见表3)。
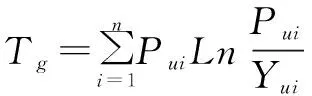
2.3.2 泰尔指数分解结果 2012—2015年,全国基层医疗卫生机构卫生技术人员数的T区域内为0.009 6~0.011 7,贡献率为 73.99%~86.20%;T区域间为0.001 8~0.003 4,贡献率分别为13.80%~26.01%(见表4、图3)。
表1 2012—2015年全国基层医疗卫生机构卫生资源配置的基本情况
Table1 General status of health resource distribution in primary healthcare institutions in China during 2012—2015
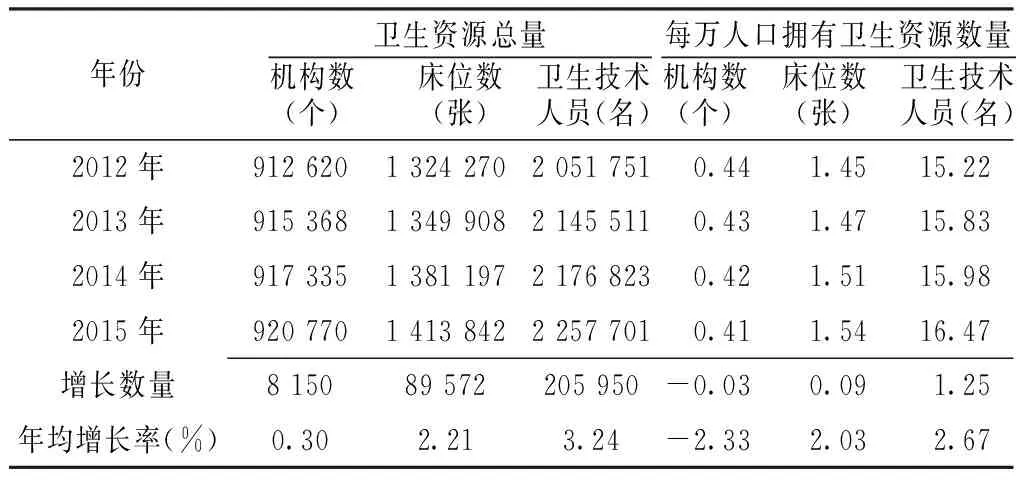
年份 卫生资源总量机构数(个) 床位数(张) 卫生技术人员(名)每万人口拥有卫生资源数量机构数(个) 床位数(张) 卫生技术人员(名)2012年912620132427020517510.441.4515.222013年915368134990821455110.431.4715.832014年917335138119721768230.421.5115.982015年920770141384222577010.411.5416.47增长数量815089572205950-0.030.091.25年均增长率(%)0.302.213.24-2.332.032.67
表2 2012—2015年各类型基层医疗卫生机构数量及构成比〔n(%)〕
Table2 Number and percentage of primary healthcare institutions in China during 2012—2015 by type
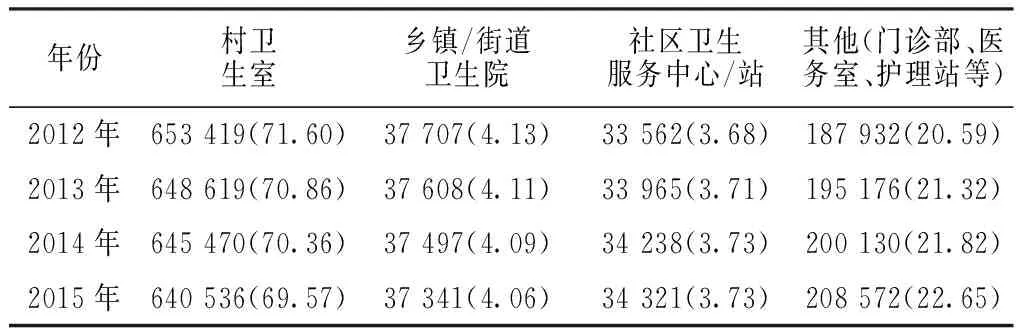
年份村卫生室乡镇/街道卫生院社区卫生服务中心/站其他(门诊部、医务室、护理站等)2012年653419(71.60)37707(4.13)33562(3.68)187932(20.59)2013年648619(70.86)37608(4.11)33965(3.71)195176(21.32)2014年645470(70.36)37497(4.09)34238(3.73)200130(21.82)2015年640536(69.57)37341(4.06)34321(3.73)208572(22.65)
注:由于数据修约(data rounding),2015年各类型基层医疗卫生机构的构成比相加为100.1%
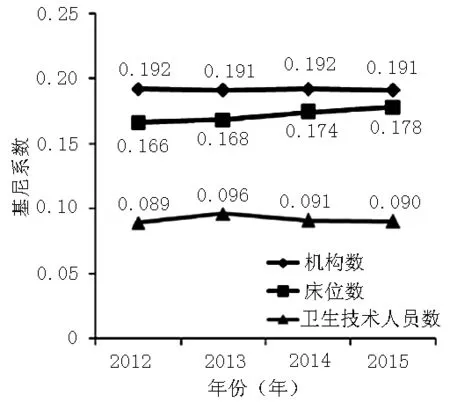
图1 2012—2015年全国基层医疗卫生机构卫生资源配置的基尼系数
Figure1 Gini coefficient for health resource distribution in primary healthcare institutions in China during 2012—2015
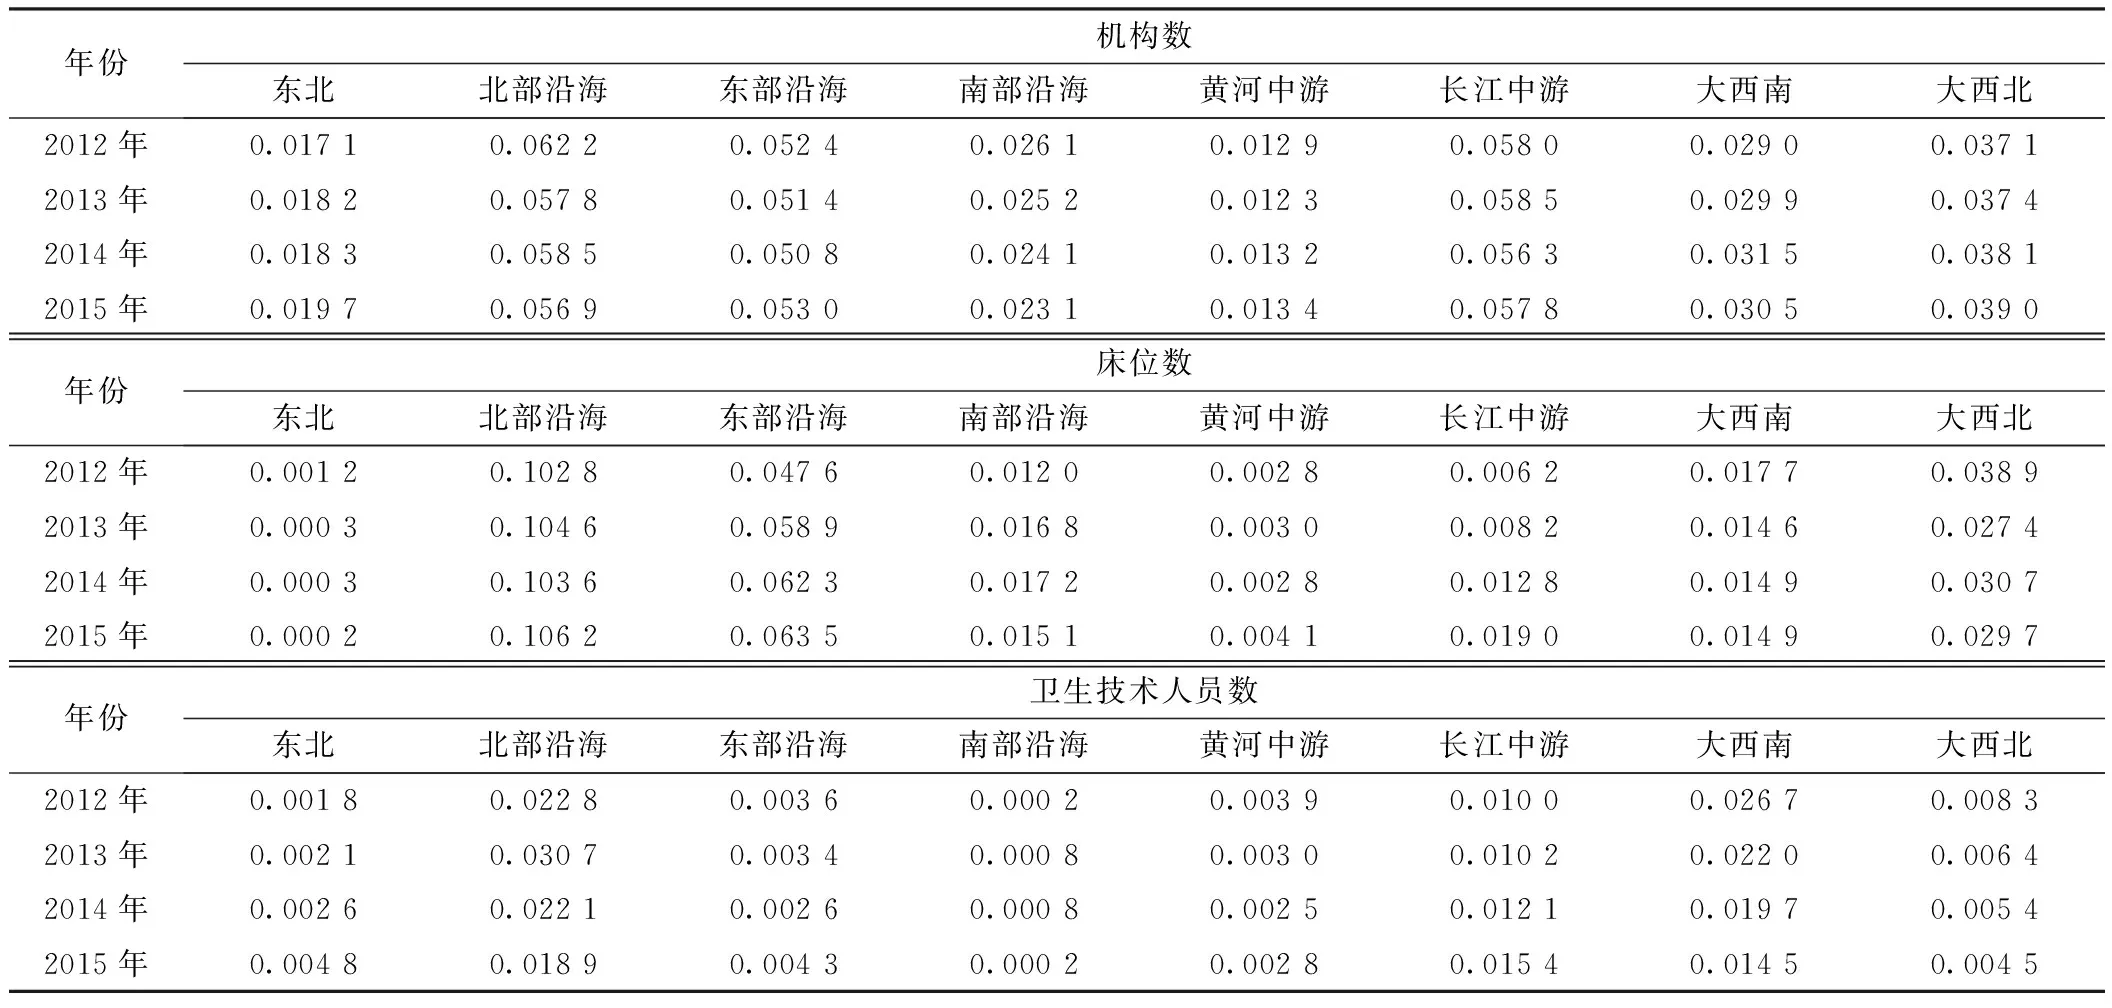
表3 2012—2015年我国各经济区基层医疗卫生机构卫生资源配置的泰尔指数
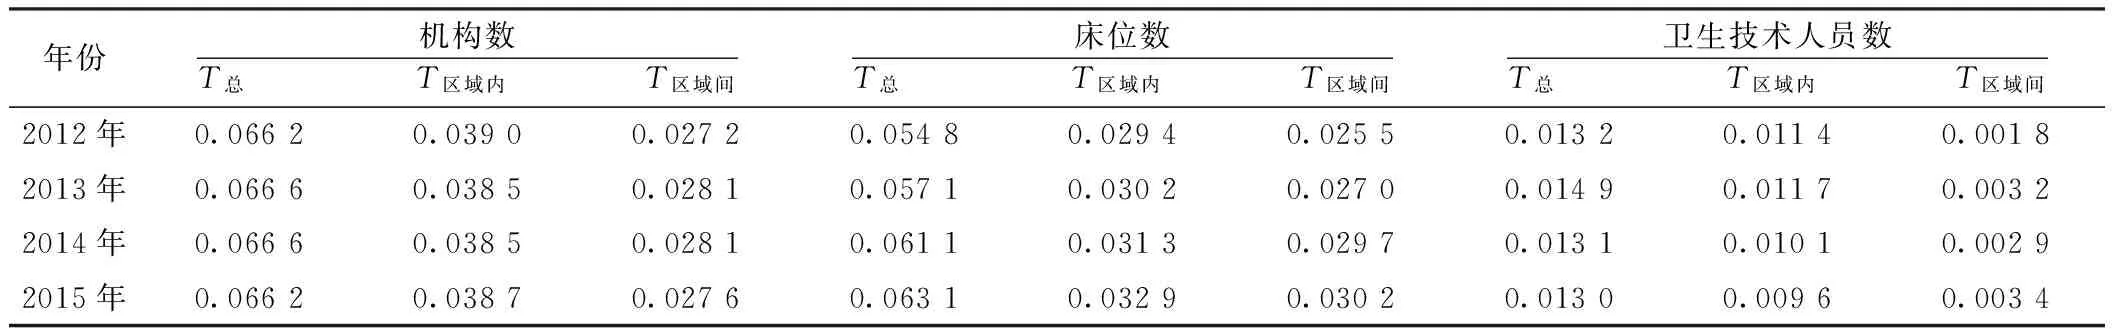
表4 2012—2015年基层医疗卫生机构卫生资源配置的泰尔指数分解
注:T总=全国总的泰尔指数,T区域内=各经济区内部卫生资源配置公平性的泰尔指数,T区域间=各经济区之间卫生资源配置公平性的泰尔指数;由于数据修约(data rounding),导致部分数据中T区域内和T区域间相加之和与T总略有出入
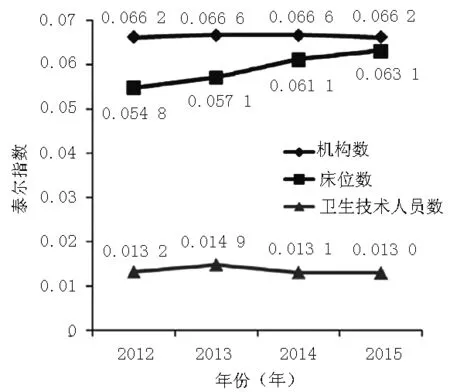
图2 2012—2015年全国基层医疗卫生机构卫生资源配置的泰尔指数
Figure2 Theil index for health resource distribution in primary healthcare institutions in China during 2012—2015
3 讨论
3.1 基层医疗卫生机构资源配置的变化情况 本研究结果显示,2012—2015年我国基层医疗卫生机构的机构数、床位数及卫生技术人员数总体呈逐年增长趋势,目前仍以传统的村卫生室为主(69.57%~71.60%),社区卫生服务中心/站、门诊部、医务室、护理站等医疗机构增长迅速,占总机构数的比例从24.27%增长至26.38%。但是,按照每万人口拥有卫生资源数量进行计算和分析时,机构数的年均增长率为-2.33%。原因可能是这些医疗机构多集中在城市地区,广大农村地区仍以传统的卫生室和卫生院为主要的基层医疗卫生服务提供主体。建议进一步加大对广大农村地区基层医疗卫生机构的建设和完善,不断满足基层群众对医疗卫生服务的需求。
3.2 基层医疗卫生机构资源配置总体公平性较好,区域内差异大于区域间差异 本研究结果显示,2012—2015年,我国基层医疗卫生机构数、床位数、卫生技术人员数的基尼系数均在0.3以下,提示我国卫生资源配置公平性总体较好。另外,卫生技术人员数的基尼系数和泰尔指数明显低于机构数和床位数,提示卫生技术人员数分布的公平性更优。
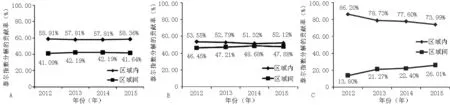
注:A:机构数,B:床位数,C:卫生技术人员数;由于数据修约(data rounding),C中数据与由表4中相关数据直接计算结果可能略有出入
图3 2012—2015年我国基层医疗卫生机构卫生资源泰尔指数的区域间及区域内贡献率
Figure3 Intra-region and inter-region contribution rates of Theil index for distribution of primary healthcare institutions,number of beds and primary healthcare providers in these institutions in China during 2012—2015
从泰尔指数分析结果来看,2012—2015年我国基层医疗卫生机构卫生资源配置的区域内差异均大于区域间差异,这提示基层医疗卫生机构的卫生资源配置不公平性主要来源于各经济区的内部差异。卫生技术人员数方面,二者之间差异最大,但随着时间推进,存在差异逐渐缩小的趋势。进一步分析各经济区的泰尔指数,我国北部沿海地区和长江中游地区在机构数、床位数、卫生技术人员数这3种卫生资源上的泰尔指数均相对较高;东北地区和黄河中游地区这3种卫生资源的泰尔指数均相对较低。这提示经济发展越快的地区,基层医疗卫生机构的卫生资源配置公平性可能就越差,这与既往卫生公平性研究结论相一致[16-17]。建议各地区在追求经济快速发展的同时,应注重基层医疗卫生机构卫生资源配置公平性的问题,以保障人民生活及健康水平的提高。
3.3 公平性指标及区域划分标准的选择 在本研究中,同时选取基尼系数和泰尔指数进行公平性评价,前者提供了分析公平与否及程度的评判标准,后者可被分解用以分析不公平性的主要来源,二者结合,各取所长[12,14]。另外,考虑到我国经济和社会的快速发展,之前所沿用的东、中、西3个区域划分方法已经不合时宜,在本研究中采取了国务院发展研究中心于2005年提出的全国八大综合经济区的划分标准,该区域划分标准综合考虑了地理、经济、文化、人口等社会发展核心指标[15],现已被各学术研究领域广泛认可并推广使用[15,18],但很少被应用于卫生及健康研究领域,本研究使用上述划分标准分析我国各经济区基层医疗卫生机构卫生资源配置及公平性问题,以期为后续相关研究提供借鉴和参考。
作者贡献:王媛媛负责资料收集、数据分析及文章撰写;刘薇薇、韩建军负责研究设计及质量控制;王媛媛、刘薇薇、韩建军负责全文审核并对文章负责。
本文无利益冲突。
[1]中华人民共和国中央人民政府.中共中央 国务院印发《“健康中国2030”规划纲要》[Z].2016.
[2]PEDRANA L,PAMPONET M,WALKER R,et al.Scoping review:national monitoring frameworks for social determinants of health and health equity[J].Global Health Action,2016,9(1):28831.DOI:10.3402/gha.v9.28831.eCollection 2016.
[3]姚萱,赵延芳,邓峰,等.分级诊疗制度下新疆三城市基层社区卫生机构资源配置公平性比较与分析[J].中国卫生经济,2016,35(7):60-63.DOI:10.7664/CHE20160716.
YAO X,ZHAO Y F,DENG F,et al.The comparison and analysis of resource distribution fairness of urban grass-roots community health institutions in three cities of Xinjiang based on classification system[J].Chinese Health Economics,2016,35(7):60-63.DOI:10.7664/CHE20160716.
[4]ZHANG T,XU Y,REN J,et al.Inequality in the distribution of health resources and health services in China:hospitals versus primary care institutions[J].Int J Equity Health,2017,16(1):42.DOI:10.1186/s12939-017-0543-9.
[5]国家卫生和计划生育委员会.2013中国卫生统计年鉴[M].北京:中国协和医科大学出版社,2013.
[6]国家卫生和计划生育委员会.2014中国卫生和计划生育统计年鉴[M].北京:中国协和医科大学出版社,2014.
[7]国家卫生和计划生育委员会.2015中国卫生和计划生育统计年鉴[M].北京:中国协和医科大学出版社,2015.
[8]国家卫生和计划生育委员会.2016中国卫生和计划生育统计年鉴[M].北京:中国协和医科大学出版社,2016.
[9]白婧,卢燕,杨非衡,等.北京市朝阳区2010—2012年社区基本公共卫生服务提供变化情况分析[J].中国全科医学,2015,18(13):1514-1517.DOI:10.3969/j.issn.1007-9572.2015.13.009.
BAI J,LU Y,YANG F H,et al.Changes of community public health services in Chaoyang District of Beijing between 2010 and 2012 [J].Chinese General Practice,2015,18(13):1514-1517.DOI:10.3969/j.issn.1007-9572.2015.13.009.
[10]胡伟萍,杨敬,徐润龙,等.中国大陆地区全科医生资源配置公平性研究[J].中国全科医学,2015,18(22):2628-2631.DOI:10.3969 /j.issn.1007-9572.2015.22.003.
HU W P,YANG J,XU R L,et al.Equity analysis of the allocation of general practitioners in mainland China [J].Chinese General Practice,2015,18(22):2628-2631.DOI:10.3969/j.issn.1007-9572.2015.22.003.
[11]臧日宏.经济学[M].北京:中国农业大学出版社,2002.
[12]舍曼·富兰德.卫生经济学[M].北京:中国人民大学出版社,2011.
[13]赵彬,杨立威,郑楠,等.基于Gini系数和Theil指数的城市社区卫生资源配置公平性研究[J].中国全科医学,2014,17(28):3301-3303.DOI:10.3969 /j.issn.1007-9572.2014.28.006.
ZHAO B,YANG L W,ZHENG N,et al.The equity analysis of urban community health resource allocation based on Gini coefficient and Theil index [J].Chinese General Practice,2014,17(28):3301-3303.DOI:10.3969/j.issn.1007-9572.2014.28.006.
[14]陈平,陈莹,杨添懿,等.基于基尼系数和泰尔指数的云南省乡镇卫生院卫生资源公平性分析[J].现代预防医学,2015,42(20):3716-3719.
CHEN P,CHEN Y,YANG T Y,et al.Gini coefficient and Theil index-based analyses of health resource equity in township health centers in Yunnan Province[J].Modern Preventive Medicine,2015,42(20):3716-3719.
[15]王梦奎.中国中长期发展的重要问题(2006—2020)[M].北京:中国发展出版社,2005.
[16]梁峥嵘,于贞杰,汤敏,等.基于泰尔指数和集中指数的我国妇幼保健资源配置公平性评价[J].现代预防医学,2015,42(16):2930-2934.
LIANG Z R,YU Z J,TANG M,et al.Evaluation on equity of maternal and child health care resources allocation in China based on Theil index and Concentration index[J].Modern Preventive Medicine,2015,42(16):2930-2934.
[17]BEIG F K,MALIK A,RIZVI M,et al.Etiology and clinico-epidemiological profile of acute viral encephalitis in children of western Uttar Pradesh,India[J].Int J Infect Dis,2010,14(2):e141-146.DOI:10.1016/j.ijid.2009.03.035.
[18]曾春媛,王锦,高楠,等.我国区域创新能力的评价及比较——基于八大经济区的实证研究[J].科技管理研究,2015,35(10):1-6.DOI:10.3969/j.issn.1000-7695.2015.10.001.
ZENG C Y,WANG J,GAO N,et al.The evaluation and comparison of regional innovation capability in China:an empirical study based on the eight economic areas [J].Science and Technology Management Research,2015,35(10):1-6.DOI:10.3969/j.issn.1000-7695.2015.10.001.
EquityofHealthResourceDistributioninPrimaryHealthcareInstitutionsinChina
WANGYuan-yuan1,LIUWei-wei1*,HANJian-jun2
1.TheSecondClinicofPekingUniversityThirdHospital,Beijing100191,China2.PublishingHouseofJournalofChineseGeneralPractive,Beijing100053,China
ObjectiveTo evaluate the trend and equity of health resource distribution in primary healthcare institutions in China during 2012 to 2015,so as to provide an evidence for further studies and the formulation and enaction of related policies.MethodsFromChina′sHealthStatisticsYearbook2013,China′sHealthAndFamilyPlanningStatisticalYearbook2014,China′sHealthAndFamilyPlanningStatisticalYearbook2015,China′sHealthAndFamilyPlanningStatisticalYearbook2016,we obtained the number of primary healthcare institutions,number of beds and number of primary healthcare providers in primary healthcare institutions in China from 2012 to 2015,and analyzed the status and trend of health resource distribution during the period,and explored its equity by using Gini coefficient and Theil index.ResultsFrom 2012 to 2015,the number of primary healthcare institutions,number of beds and primary healthcare providers in these institutions increased by 8 150,89 572 and 205 950 respectively,with an annual growth rate of 0.30%,2.21% and 3.24%,respectively. From 2012 to 2015,the Gini coefficient for the distribution of primary healthcare institutions in China were 0.192,0.191,0.192,0.191,respectively;Theil index for the distribution of them respectively were 0.066 2,0.066 6,0.066 6,and 0.066 2;Intra-region contribution rate was found to be higher than inter-region contribution rate for Theil index in each year of this period(58.91% vs 41.09% in 2012,57.81% vs 42.19% in 2013,57.81% vs 42.19% in 2014,58.36% vs 41.64% in 2015). The Gini coefficient for the distribution of beds in primary healthcare institutions in China were 0.166,0.168,0.174,0.178,respectively during 2012 to 2015;Theil index for the distribution of them respectively were 0.054 8,0.057 1,0.061 1,and 0.063 1;Intra-region contribution rate was found to be higher than inter-region contribution rate for Theil index in each year of this period(53.55% vs 46.45% in 2012,52.79% vs 47.21% in 2013,51.32% vs 48.68% in 2014,52.12% vs 47.88% in 2015). The Gini coefficient for the distribution of the primary healthcare providers in primary healthcare institutions in China from 2012 to 2015 respectively were 0.089,0.096,0.091 and 0.090;Theil index for the distribution of them respectively were 0.013 2,0.014 9,0.013 1 and 0.013 0;Intra-region contribution rate was found to be higher than inter-region contribution rate for Theil index in each year of this period(86.20% vs 13.80% in 2012,78.73% vs 21.27% in 2013,77.60% vs 22.40% in 2014,73.99% vs 26.01% in 2015).ConclusionThe equity of health resource distribution in primary healthcare institution in China during 2012—2015 was reasonable on the whole.The distribution equity of the number of primary healthcare providers was better than that of primary healthcare institutions and beds in these institutions.However,intra-region differences were greater than inter-region differences in the distribution equity of these three items.Therefore,priority should be given to the improvement of intra-region equity of health resource distribution in primary healthcare institutions.
Primary health care;Health care rationing;Gini coefficient;Theil index
*通信作者:刘薇薇,研究员,副主任医师,硕士生导师;E-mail:c_lww@126.com
R 197
A
10.3969/j.issn.1007-9572.2017.28.001
*Correspondingauthor:LIUWei-wei,Researcher,Associatechiefphysician,Mastersupervisor;E-mail:c_lww@126.com
2017-05-27;
2017-08-31)
(本文编辑:石敏杰)