Abnormal Alterations of Cortical Thickness in 16 Patients with Type 2 Diabetes Mellitus: A Pilot MRI Study△
2017-08-07ZhiyeChenXiujuanZangMengqiLiuMengyuLiuJinfengLiZhaoyanGuandLinMa
Zhiye Chen, Xiujuan Zang, Mengqi Liu, Mengyu Liu, Jinfeng Li, Zhaoyan Gu, and Lin Ma*
Abnormal Alterations of Cortical Thickness in 16 Patients with Type 2 Diabetes Mellitus: A Pilot MRI Study△
Zhiye Chen1,2, Xiujuan Zang3, Mengqi Liu1,2, Mengyu Liu1, Jinfeng Li1, Zhaoyan Gu4, and Lin Ma1*
1Department of Radiology, Chinese PLA General Hospital, Beijing 100853, China2Department of Radiology,4Department of Endocrinology, Hainan Branch of Chinese PLA General Hospital, Sanya, Hainan 572013, China3Department of Radiology, The Fifth People's Hospital, Shizuishan, Ningxia 753000, China
type 2 diabetes mellitus; brain; cerebral cortex; cortical thickness; magnetic resonance imaging
Objective The aim of this study is to investigate the cerebral cortical thickness changes in type 2 diabetes mellitus (T2DM) using a whole brain cortical thickness mapping system based on brain magnetic resonance imaging (MRI).
Methods High resolution three-dimensional T1-weighted fast spoiled gradient recalled echo MR images were obtained from 16 patients with T2DM, as well as from 16 normal controls. The whole brain cortical thickness maps were generated, and the cortical thickness of each brain region was calculated according to gyral based regions of interest (ROI) using an automated labeling system by the Freesurfer software. We compared mean cortical thickness at each brain region by the analysis of covariance with age and sex as covariates. The regional difference of the cortical thickness over the whole brain was compared by the analysis of surface-based cortical thickness.
Results Mean cortical thicknesses analysis showed bilateral cerebrum in the patients with T2DM (left: 2.52±0.07 mm; right: 2.51±0.08 mm) were significant thinner than those in the normal controls (left: 2.56±0.09 mm; right: 2.56±0.09 mm) (both<0.05). Regional cortical thinning in T2DM was demonstrated in the paracentral lobule, postcentral gyrus, lateral occipital gyrus, lingual gyrus, precuneus, superior temporal gyrus, middle temporal gyrus, inferior temporal gyrus and posterior cingulate gyrus, compared to the normal controls. The cortical thickness of left middle cingulate and right inferior temporal gyrus were negatively correlated with the disease course.
Conclusion A widespread cortical thinning was revealed in patients with T2DM by the analysis of brain cortical thickness on MR. Our finding supports the idea that T2DM could lead to subtle diabetic brain structural changes.
Chin Med Sci J 2017; 32(2):75-82. DOI:10.24920/J1001-9294.2017.010
IABETES is a common metabolic disease with progressive damage in peripheral and central nervous systems caused by chronic hyperglycaemia. Cognitive dysfunction has been observed in patients with type I diabetes mellitus1or T2DM. It has been reported that patients with diabetes mellitus have a greater risk of cognitive function decline than healthy people.2Some longitudinal studies provided compelling evidence to support the view that type 2 diabetic patients were at increased risk of developing cognitive impairment in comparison to the general population.3Therefore it is necessary to evaluate the brain structure in T2DM in order to understand the changes in diabetic brains.
In some studies, the brain atrophy was investigated through visual assessment and rating scales on conventional MR images in patients with T2DM.4-6However, it is difficult to evaluate subtle brain structural changes using these methods. Voxel-based morphometry (VBM) is an automatic technique for brain structural evaluation. A study using VBM has demonstrated the atrophy of gray and white matter in the right temporal lobe in patients with T2DM.7Although VBM can be used in detecting subtle gray matter volume changes over the whole brain, it is not an ideal technique for the delineation of cortical structure, because it is a kind of statistical method at voxel level rather than a measurement of the cortical thickness.
Cortical thickness measurement provides us with a methodological innovation for assessing subtle changes of cortical thickness in human brain. Combining the image information and geometry constraints, the surface of gray and whiter matter can be reconstructed, and then the cortical thickness can be measured based on identification of the morphometric features of cortex.8In the past few years, many novel methods have been proposed to focus on cortical thickness measurement, including coupled surface method,8,9closest point method,10Laplace method11and voxel-based cortical thickness.12Subsequent studies13,14using these techniques have shown that cortical thickness measurement could potentially provide more valuable information than volume measurement in neurodegenerative and psychological diseases. In a study15using Laplace methods to investigate the cortical thickness of diabetic brain, however, only regions of interest (ROI) statistical analysis was performed. Herein, surface-based cortical thickness analysis may provide more information of structural alteration for diabetic brains.
In this study, we used a whole brain cortical thickness mapping technique aiming at detecting possible alteration of cortical thickness over whole brain in patients with T2DM.
MATERIALS AND METHODS
Subjects
Patients from the diabetes outpatient clinic at PLA General Hospital who met one of the following inclusion criteria were eligible for the study:16fasting plasma glucose (FPG) level>7.0 mmol/L; 2-hour plasma glucose level >11.1 mmol/L during oral glucose tolerance test (OGTT); or a prior diagnosis of T2DM. The exclusion criteria were as follows: a history of dementia, macrovascular complications (definite cerebral infarction or malacia), cranium trauma, inflammatory diseases of the central nervous system, or use of psychoactive drugs or hormones. In addition, we evaluated brain atrophy and white matter lesions (WMLs) of the candidates on conventional MR images using ten-level grading scales.17Patients with brain atrophy of grade 0 (normal ventricular size) or grade 1(presumably normal ventricular size), and WMLs in grade 0 (normal white matter) or grade 1 (barely detectable white matter changes) were enrolled in this study. Finally, sixteen patients with T2DM were included.
Normal controls were recruited from our hospital staffs or their relatives with gender matched evenly. The same exclusion criteria were applied to the normal controls, and none of the controls had a history of hypertension. There were sixteen normal controls enrolled in the study. All the subjects were right-handed and underwent Mini Mental State Examinations (MMSE)18in order to exclude the possi- bility of dementia.
Written informed consents were obtained from all participants according to the approval of the ethics committee of the local institutional review board.
MRI acquisition
High resolution structural images were obtained from a 3.0 TMR system (SIGNA EXCITE, GE Healthcare, Milwaukee, WI, USA) with a conventional eight-channel phased array head coil. Conventional axial fast fluid-attenuated inversion recovery (FLAIR) images were acquired firstly, and the parameters were as follows: TR (repetition time)= 8802 ms, TE (echo time)=124.3 ms, TI (invertion time)= 2200 ms, slice thickness=4 mm, gap=1 mm, matrix= 256×256, FOV (field of view) = 24 cm×24 cm, NEX (number of acquisition)=1. The structural images were generated from the high resolution three-dimensional T1-weighted fast spoiled gradient recalled echo (3D T1-FSPGR) sequence. The parameters were as follows: TR=6.3 ms, TE=2.8 ms, flip angle=15°, FOV=24 cm×24 cm, Matrix=256×256, in-plane resolution was 0.9375 mm× 0.9375 mm, NEX=1.
Data processing
All the MR raw data was archived and retrieved using picture archiving and communication system (K-PACS V1.6.0). The whole brain cortical thickness measurements were performed using Freesurfer software (version 4.3.0) (http://surfer.nmr.mgh.harvard.edu/), which was run in Linux 2.6.15-2.5 operating system.
The main imaging process was as follows:19(1) Using N3 algorithm to correct the filed inhomogeneity, and using a hybrid watershed algorithm to remove the non-brain tissues;20(2)subcortical white matter and gray matter segmentation with automatic Talairach transformation;22-23(3) generating the gray/white matter surface and pial surface with automatic topological defect correction;24(4) morphing and registering individual reconstructed surface to the average spherical surface;25(5) labeling Desikan-Killiany brain regions to individual surface by automatic spherical transformation26(Fig.1A,1B); (6) the cortical thickness calculation defined as the shortest distance between reconstructed brain surface;24-25(7) spatial surface-based smoothing with a 10-mm full width at half height Gaussian kernel before the surface-based cortical thickness analysis.
Statistical analysis
Age and MMSE were compared using Student’stest. Body mass index (BMI) was compared using the Welch test due to unequal variances between the patients and normal controls. Bilateral mean cortical thickness and vertex cortical thickness of every brain region of each hemisphere were compared between the patient and control groups using analysis of covariance (ANCOVA) with age and BMI as covariates. Allvalues of less than 0.05 were considered statistically significant. The statistical analysis was performed using SPSS 19.0.
RESULTS
Demographic characteristic
There was no significant difference for age, BMI and MMSE between the patients with T2DM(61.2±7.8 years, 25.7± 3.9 kg/mm2and 26.0±2.0) and the normal controls (59.6±6.1 years, 25.3±1.6 kg/mm2and 28.4±1.3) (allvalues > 0.05). The mean disease duration was 13.2±5.6 years, and mean HbA1c was 8.4±1.7 mmol/L for the patients.
Changes of T2DM in Mean cortical thickness analysis over the whole brain
The results showed that bilateral cortical thicknesses in T2DM (left: 2.52±0.07 mm; right: 2.51±0.08 mm) were significantly thinner than those of the normal control group (left: 2.56±0.09 mm; right: 2.56±0.09 mm) (left,=6.18,= 0.019; right,=8.98,=0.006).
According to gyral based regions of interest (ROI) using an automated labeling system,25the brain regions with significantly decreased cortical thickness mainly located in left paracentral lobe, bilateral postcentral gyrus, lateral occipital gyrus, lingual gyrus, precuneus, temporal lobe, cingulate and insular lobe compared with normal controls (Table 1).
Changes of cerebral cortex in Surface-based cortical thickness analysis over the whole brain
For the left cerebral hemisphere, compared to normal controls, patients with T2DM showed regional thickening of cerebral cortex in the precentral gyrus (1 cluster), postcentral gyrus (2 clusters), rostral middle frontal gyrus (1 cluster) and superior frontal gyrus (1 cluster), while regional thinning of cerebral cortex in precentral gyrus (1 cluster), postcentral gyrus (1 cluster), superior temporal gyrus (3 clusters), middle temporal gyrus (1 cluster), inferior temporal gyrus (1 cluster), inferior parietal lobule (1 cluster), paracentral lobule (2 clusters), superior frontal gyrus (1 cluster), posterior cingulate gyrus (1 cluster), precuneus (2 clusters), lingual gyrus (3 clusters), and lateral occipital gyrus (1 cluster) (Fig. 2A).
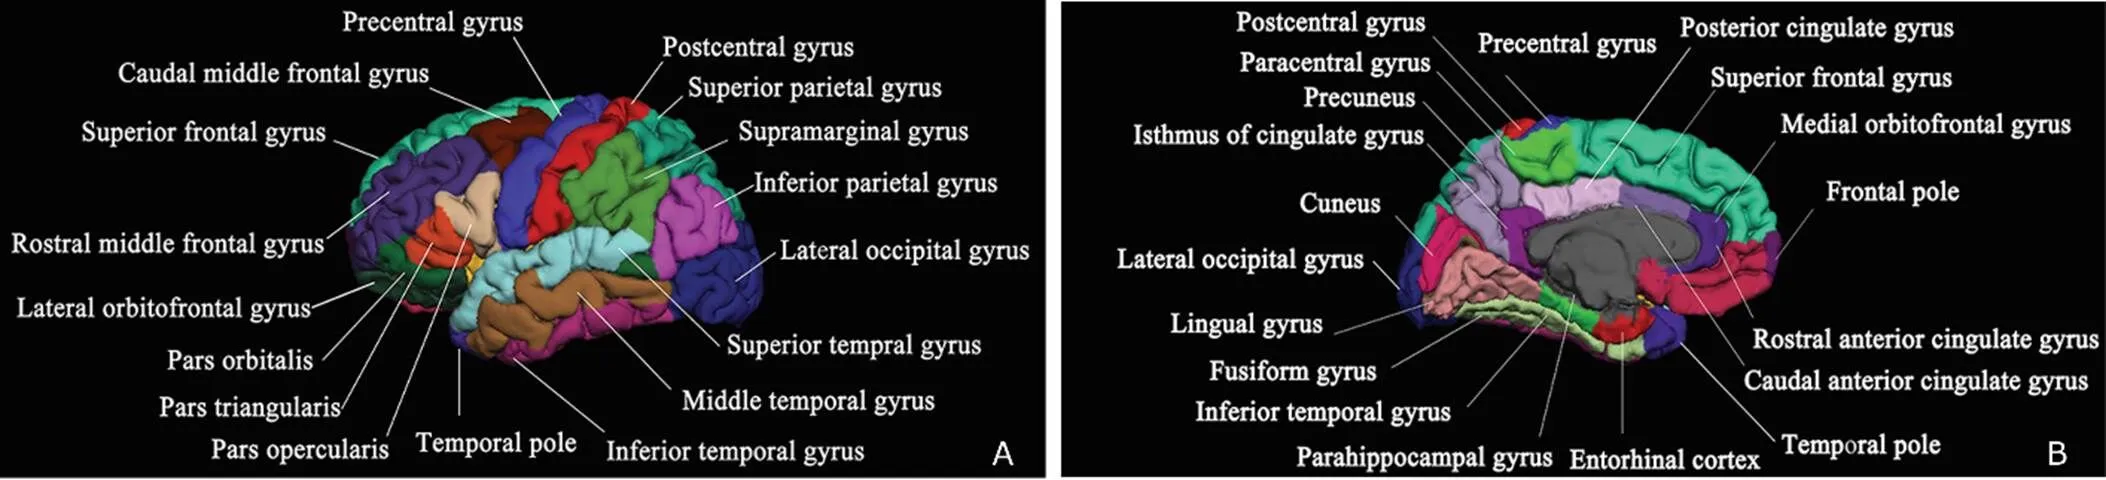
Figure 1. Thirty-three brain regions on reconstructed maps with automatic labeling. A. lateral view; B. medial view (by the Freesurfer software).

Table 1. Comparisons of mean cortical thickness of each brain region between T2DM patients and normal controls§
§: Plus-minus values are mean±standard deviation.T2DM: type 2 Diabetes Mellitus; NS: normal controls L: left; R: right.
For the right cerebral hemisphere, compared to normal controls, patients with T2DM showed regional thickening of cerebral cortex in the superior frontal gyrus (1 cluster) and rostral middle frontal gyrus (1 cluster), while regional thinning of cerebral cortex in postcentral gyrus (2 clusters), superior temporal gyrus (4 clusters), transverse temporal gyrus (1 cluster), middle temporal gyrus (2 clusters), inferior temporal gyrus (2 clusters), lateral occipital gyrus (4 clusters), precuneus (2 clusters), posterior cingulate gyrus (2 clusters), caudal anterior cingulate (1 cluster) and entorhinal cortex (1 cluster)(Fig. 2B).
Relationship between Surface-based thickness alteration in T2DM and clinical features
Covariance analysis revealed that the cortical thickness of left middle cingulate [-6,-1,40] (value=0.76,= 0.000) and right inferior temporal gyrus [52,-58, -12] (value=0.85,=0.000) were negatively correlated with the disease duration (Fig. 3).There was no significant correlation between the cortical thickness and HbA1c.
DISCUSSION
Cortical thickness analysis is one of the most important brain structure analysis techniques. In this study, the whole brain cortical thickness map was generated by combining the coupled surface method and the closest point method, and then surface-based cortical thickness analysis was applied. The cortical thickness is defined by the shortest distance between the gray/white matter surface and the pial surface based on the coupled surface method with submillimeter precision.8Unlike volume- based smoothing (commonly used in VBM analysis with 3-dimensional space), the surface-based smoothing was performed based on 2-dimensional space, and only the adjacent vertexes were averaged. Therefore, surface-based cortical thickness analysis could provide more objective and precise cortical thickness measurements over the whole brain.
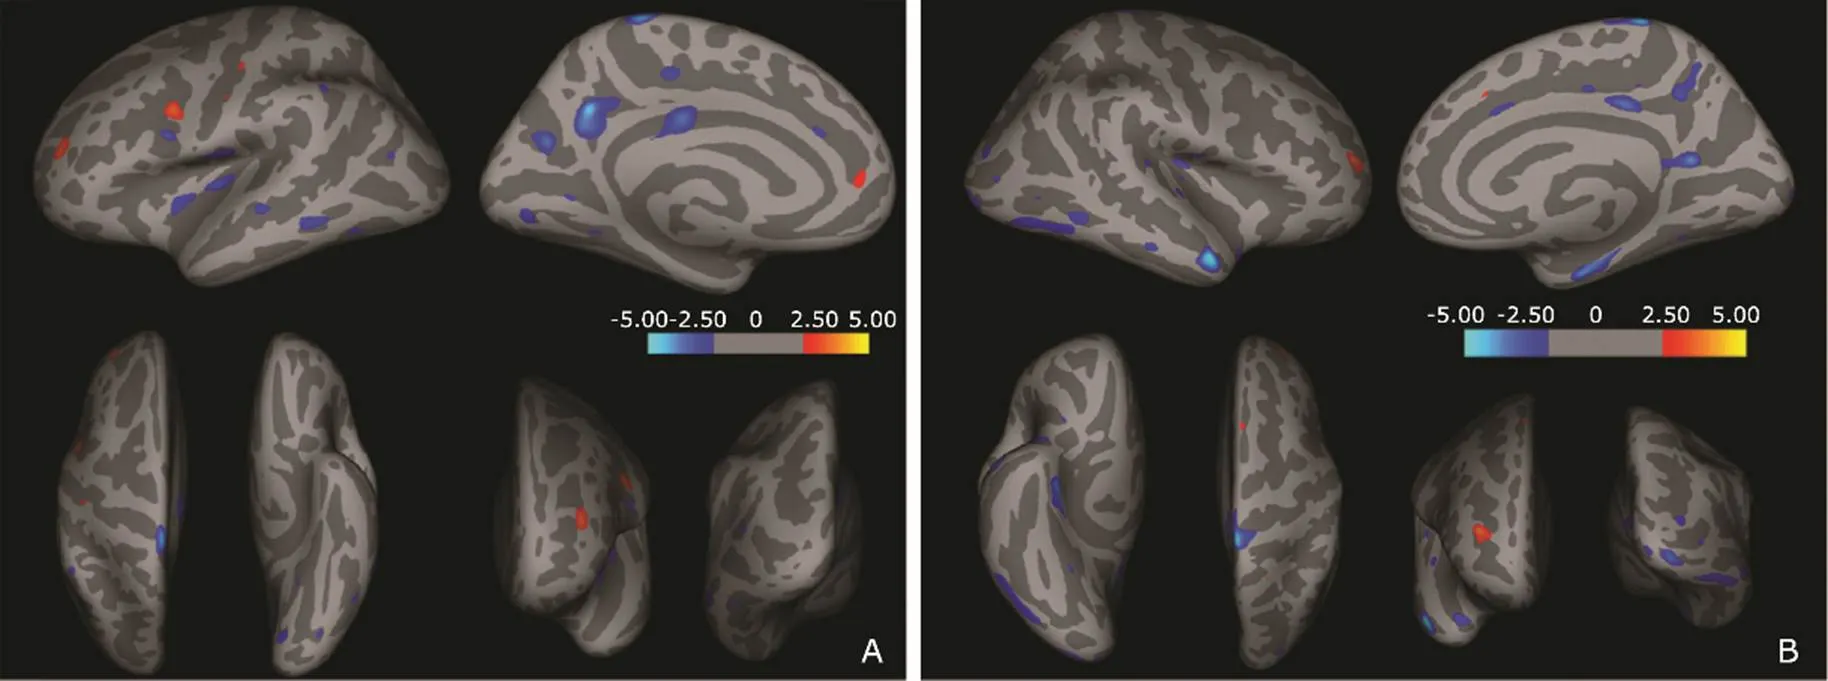
Figure 2.Regional cortical changes analyzed with surface-based cortical thickness in the brain of patients with T2DM compared with normal controls. Dark gray areas on the inflated cortical surface represent the sulci, light gray areas represent the gyri, and the color scale bar is on a –log (value). Red clusters show that cortical thickness was thicker in diabetic patients than that of the normal controls. Blue clusters show that cortical thickness was thinner in the patients than that of normal controls.A.Left hemisphere: Brain regions with regional thickening are located in precentral gyrus, postcentral gyrus, rostral middle frontal gyrus and superior frontal gyrus; brain regions with regional thinning are located in precentral gyrus, postcentral gyrus, superior temporal gyrus, middle temporal gyrus, inferior temporal gyrus, inferior parietal lobule, paracentral lobule, superior frontal gyrus, posterior cingulate gyrus, precuneus, lingual gyrus and lateral occipital gyrus. B.Right hemisphere: Brain regions with regional thickening are located in superior frontal gyrus and rostral middle frontal gyrus; brain regions with regional thinning are located in postcentral gyrus, superior temporal gyrus, transverse temporal gyrus, middle temporal gyrus, inferior temporal gyrus, lateral occipital gyrus, precuneus, posterior cingulate gyrus, caudal anterior cingulate and entorhinal.
Figure 3. Cortical thickness of brain regions that negatively correlated with disease course in T2DM patients. The color scale bar is on a –log (value).A. Middle cingulate of left hemisphere; B. Inferior temporal gyrus of right hemisphere.
The analysis of the mean cortical thickness of whole brain demonstrated that cortical thicknesses of both hemisphere in the patients with T2DM were thinner than those of the normal controls, which is consistant with the study by Brundel,27suggesting brain injury induced by the disease. However, the measurements of mean cortical thickness in diabetic patients in our study were thicker than those in Brundel’s study.27This discrepancy may result from the following reasons. Firstly, magnetic field strength of MRI scanner we used was 3.0 T, instead of 1.5 T as used in his study. Secondly, the mean age of patients in our study was 61.2±7.8 years, which was younger than that of Brundel’s study (68.1±4.3 years). Thirdly, the different mean cortical thickness of whole brain may be associated with BMI, the history of hypertension, HbA1c, and the treatment that subjects has received.
The mean cortical thickness of brain region was calculated according to gyrus-based regions of interest (ROI) using an automated labeling system. The mean cortical thickness analysis of the frontal cortex demonstrated that only left paracentral lobule showed significant thinning in the patients compared with that of normal control group. However, surface-based cortical thickness analysis indicated that multiple clusters of the frontal cortex were thicker (positive) or thinner (negative) in the patients than in normal controls. We therefore believe that the mean cortical thickness analysis reveals the thickness of the whole frontal cortical region in general, while surface-based cortical thickness analysis delineates a relatively detailed description. Thus, the cortical injury pattern of the diabetic brain could be better depicted and investigated by combining these two methods.
In patients with T2DM, multiple positive clusters in the frontal cortex may represent the heterogeneous intrinsic changes of the brain. This may be interpreted as a transient inflation in some circumstances, and the negative clusters could be considered as true cortical thinning of brain injury. The mechanism in changes of cortical thickness should be further explored, especially for the positive clusters of the thickened cortex in the patients.
The mean cortical thickness analysis revealed significant thinning in bilateral postcentral cortices in the patients. The surface-based cortical thickness analysis detected both thickened and thinning clusters in the left postcentral cortex, but merely thinning clusters in the right postcentral cortex. Therefore, attention should be paid to bilateral postcentral cortices in diabetic brain.
Early detection of occipital cortical injury is of great importance because the occipital cortex is mainly in charge of vision and sense of motion. In this study, the thinning occipital cortex, detected by both mean and surface-based cortical thickness analysis, was mainly located in bilateral lateral occipital gyri, lingual gyri and precuneus cortices. These results were different from the previous VBM study,7where no volume change in the occipital cortex was detected. Therefore, our result suggected the cortical thickness analysis could detect subtle cortical changes in T2DM.
In this study, both mean and surface-based cortical thickness analysis demonstrated cortical thinning in multiple temporal regions, and there was no thickening clusters detected. This result is consistent with the previous studies.7,27It is reasonable to consider that bilateral temporal cortices are the major targeted regions of injury in T2DM.
Additionally, mean cortical thickness analysis of the limbic system demonstrated cortical thinning in bilateral posterior cingulate gyri, right isthmus of cingulate gyrus, and right insular cortex, while surface-based cortical thickness analysis confirmed the regional cortical thinning in the bilateral posterior cingulate, right caudal anterior cingulate gyrus and right entorhinal cortex. Meanwhile, bilateral hippocampus and parahippocampus showed no significant difference between the T2MD patient and the controls. Therefore, cingulate cortex may be a special site of brain injury in patients with T2DM.
In this study, we found the cortical thickness of left cingulate and right inferior temporal gyrus were negatively correlated with disease duration, and no positive correlation was revealed. This finding indicated cortical thickness analysis could provide a valuable information for the brain impairment evaluation in a variable disease course of T2DM, and disease course could be considered as a clinical index to evaluate the brain impairment.
Our findings demonstrated the presence of cortical impairment and damage in diabetic brains. For the cortical impairment, it may manifest as a transient cortical thickening. Longitudinal observation is needed to investigate the outcome of these alterations in brain. For the cortical damage, it may present as cortical thinning, and the involved brain regions may be irreversible. Therefore, evaluation of cortical thickness over the whole brain is important for diabetic brains, and cortical thickness may be considered as an imaging biomarker for diabetic brain changes. The cortical thickness analysis could strengthen the management of diabetic patients.
This study is a cross-sectional study and the sample size is relatively small, which may limit the strength of our results. Pathological evidence is needed in future, and special attention should be paid to the thickening clusters in longitudinal study.
In summary, whole brain cortical thickness mapping demonstrated that widespread cortical thinning existed in the patients with T2DM. This finding supports the notion that T2DM could lead to subtle diabetic brain structural changes in patients who are free from dementia or macrovascular complications.
1. Brands AM, Biessels GJ, de Haan EH, et al. The effects of type 1 diabetes on cognitive performance: a meta- analysis. Diabetes Care 2005; 28:726-35. doi:10.2337/ diacare.28.3.726.
2. Cukierman T, Gerstein HC, Williamson JD. Cognitive decline and dementia in diabetes-systematic overview of prospective observational studies. Diabetologia 2005; 48:2460-9. doi:10.1007/s00125-005-0023-4.
3. Allen KV, Frier BM, Strachan MW. The relationship between type 2 diabetes and cognitive dysfunction: longitudinal studies and their methodological limitations. Eur J Pharmacol 2004; 490:169-75. doi:10.1016/j.ejphar. 2004.02.054.
4. Scheltens P, Pasquier F, Weerts JG, et al. Qualitative assessment of cerebral atrophy on MRI: inter and intra- observer reproducibility in dementia and normal aging. Eur Neurol 1997; 37:95-9. DOI:10.1159/000117417.
5. de Bresser J, Tiehuis AM, van den Berg E, et al. Progression of cerebral atrophy and white matter hyperintensities in patients with type 2 diabetes. Diabetes Care 2010; 33:1309-14. doi:10.2337/dc09-1923.
6. Gold SM, Dziobek I, Sweat V, et al. Hippocampal damage and memory impairments as possible early brain complications of type 2 diabetes. Diabetologia 2007; 50:711-9. doi:10.1007/s00125-007-0602-7.
7. Chen Z, Li L, Sun J, et al. Mapping the brain in type Ⅱ diabetes: Voxel-based morphometry using DARTEL. Eur J Radiol 2012; 81:1870-6. doi:10.1016/j.ejrad.2011. 04.025.
8. Fischl B, Dale AM. Measuring the thickness of the human cerebral cortex from magnetic resonance images. Proc Natl Acad Sci USA 2000; 97:11050-5. DOI:10.1073/pnas. 200033797.
9. MacDonald D, Kabani N, Avis D, et al. Automated 3-D extraction of inner and outer surfaces of cerebral cortex from MRI. Neuroimage 2000; 12: 340-56. DOI:10.1006/nimg. 1999.0534.
10. Miller MI, Massie AB, Ratnanather JT, et al. Bayesian construction of geometrically based cortical thickness metrics. Neuroimage 2000; 12: 676-87. doi:10.1006/ nimg.2000.0666.
11. Jones SE, Buchbinder BR, Aharon I. Three-dimensional mapping of cortical thickness using Laplace's equation. Hum Brain Mapp 2000; 11: 12-32. doi:10.1002/1097-0193 (200009)11:1%3C12:AID-HBM20%3E3.0.CO;2-K.
12. Hutton C, De Vita E, Ashburner J, et al. Voxel-based cortical thickness measurements in MRI. Neuroimage 2008; 40:1701-10. doi:10.1016/j.neuroimage.2008.01.027.
13. Lebedev AV, Westman E, Beyer MK, et al. Multivariate classification of patients with Alzheimer's and dementia with Lewy bodies using high-dimensional cortical thickness measurements: an MRI surface-based morphometric study. J Neurol 2012; 260:1104-15. doi:10.1007/ s00415- 012-6768-z.
14. Qiu A, Gan SC, Wang Y, et al. Amygdala-hippocampal shape and cortical thickness abnormalities in first-episode schizophrenia and mania. Psychol Med 2012;43:1353-63. doi:10.1017/S0033291712002218.
15. Peng B, Chen Z, Ma L, et al. Cerebral alterations of type 2 diabetes mellitus on MRI: A pilot study. Neurosci Lett 2015; 606:100-5. doi:10.1016/j.neulet.2015.08.030.
16. American Diabetes Association. Diagnosis and classification of diabetes mellitus. Diabetes Care 2009; 32 Suppl 1:S62-67. doi:10.2337/dc09-S062.
17. Manolio TA, Kronmal RA, Burke GL, et al. Magnetic resonance abnormalities and cardiovascular disease in older adults. The Cardiovascular Health Study. Stroke 1994; 25:318-27. doi:10.1161/01.STR.25.2.318.
18. Galea M, Woodward M. Mini-Mental State Examination (MMSE). Aust J Physiother 2005; 51:198. doi:10.1016/ S0004-9514(05)70034-9.
19. Chen ZY, Sun J, Yang Y, et al. Cortical thinning in type 2 diabetes mellitus and the recovering effect of insulin therapy. J Clin Neurosci; 2015; 22:275-9. doi:10.1016/j. jocn.2014. 07.014.
20. Sled JG, Zijdenbos AP, Evans AC. A nonparametric method for automatic correction of intensity nonuniformity in MRI data. IEEE Trans Med Imaging 1998; 17: 87-97. doi:10.1109/42.668698.
21. Segonne F, Dale AM, Busa E, et al. A hybrid approach to the skull stripping problem in MRI. Neuroimage 2004; 22:1060-75. doi:10.1016/j.neuroimage.2004.03.032.
22. Fischl B, Salat DH, van der Kouwe AJ, et al. Sequence- independent segmentation of magnetic resonance images. Neuroimage 2004; 23 Suppl 1:S69-84. doi:10.1016/j. neuroimage.2004.07.016.
23. Fischl B, Salat DH, Busa E, et al. Whole brain segmentation: automated labeling of neuroanatomical structures in the human brain. Neuron 2002; 33:341-55. doi:10.1016/ S0896-6273(02)00569-X.
24. Fischl B, Sereno MI, Dale AM. Cortical surface-based analysis. Ⅱ: Inflation, flattening, and a surface-based coordinate system. Neuroimage 1999; 9:195-207. doi:10. 1006/nimg.1998.0396.
25. Fischl B, Sereno MI, Tootell RB, et al. High-resolution intersubject averaging and a coordinate system for the cortical surface. Hum Brain Mapp 1999; 8: 272-84. doi:10.1002/(SICI)1097-0193(1999)8:4%3C272:AID-HBM10%3E3.0.CO;2-4.
26. Desikan RS, Segonne F, Fischl B, et al. An automated labeling system for subdividing the human cerebral cortex on MRI scans into gyral based regions of interest. Neuroimage 2006; 31: 968-80. doi:10.1016/j.neuroimage. 2006.01.021.
27. Brundel M, van den Heuvel M, de Bresser J, et al. Cerebral cortical thickness in patients with type 2 diabetes. J Neurol Sci 2010; 299: 126-30. doi:10.1016/j.jns.2010.08.048.
for publication September 9, 2016.
Tel: 86-10-66939592, E-mail: cjr.malin@vip.163.com.
△Supported by the Foundation for Medical and Health Sci & Tech innovation Project of Sanya (2016YW37) and the Special Financial Grant from China Postdoctoral Science Foundation (2014T70960).
杂志排行

Chinese Medical Sciences Journal的其它文章
- Clinical Evaluation of Color Doppler Ultrasound in Selecting the Optimal Treatment Modality for Infantile Hemangioma△
- Neuroprotective Effects of Grape Seed Procyanidin Extract on Ischemia-Reperfusion Brain Injury△
- Effects of Aging on the Proliferation and Differentiation Capacity of Human Periodontal Ligament Stem Cells△
- The Correlation of Indices in r-TEG with Intra-operative Blood Loss in Neurosurgical Patients
- Prevalence of Carbapenem-Resistant Klebsiella Pneumoniae (CRKP) and the Distribution of Class 1 Integron in Their Strains Isolated from a Hospital in Central China
- Can Fundus Fluorescein Angiography be Performed for Diabetic Patients on Oral Metformin?△