CeO2的添加对柴油车氧化催化剂Pt/SiO2-Al2O3的NO氧化性能提高的影响
2017-06-21黄于芬张海龙杨铮铮黄木兰
黄于芬 张海龙 杨铮铮 赵 明 黄木兰
梁艳丽1 王健礼1,* 陈耀强1,*
(1四川大学化学学院, 绿色化学与技术教育部重点实验室,成都 610064;2四川大学化学工程学院,成都 610064;3西华师范大学环境科学与工程学院,四川 南充 637009)
CeO2的添加对柴油车氧化催化剂Pt/SiO2-Al2O3的NO氧化性能提高的影响
黄于芬1张海龙2杨铮铮3赵 明1黄木兰1
梁艳丽1王健礼1,*陈耀强1,*
(1四川大学化学学院, 绿色化学与技术教育部重点实验室,成都 610064;2四川大学化学工程学院,成都 610064;3西华师范大学环境科学与工程学院,四川 南充 637009)
采用分步浸渍法制备不同CeO2含量改性SiO2-Al2O3载体的Pt/SiO2-Al2O3柴油车氧化催化剂Pt/SiO2-Al2O3-wCeO2(质量分数w为0%, 5%, 10%, 15%, 30%)。利用固定床反应器,在模拟柴油车行驶条件下测定催化反应活性。活性结果表明,无论CO和C3H6存在与否,适量CeO2的添加均明显提高了Pt/SiO2-Al2O3柴油车氧化催化剂的NO氧化性能。其中,Pt/SiO2-Al2O3-15% CeO2表现出了最优氧化性能,其能在较宽温度范围内维持61%的NO2产率。CO-化学吸附结果表明,适量CeO2的添加有利于提高Pt的分散度,即提高催化剂表面可利用Pt原子比例。透射电镜(TEM)结果证实了CeO2改性后高分散的Pt颗粒的存在,X射线衍射(XRD)结果也说明CeO2改性后的载体更利于抑制Pt晶粒的增长。氢气程序升温还原(H2-TPR)和TEM结果均说明CeO2的添加增强了贵金属-载体间的相互作用,从而更利于PtOx与CeO2还原。总之,本文表明CeO2改性柴油车催化剂(DOC)可以提高催化剂的分散性和还原性,从而提高NO催化氧化性能,其对工业应用中柴油车尾气净化后处理复合系统(DOC+DPF+SCR)的净化效率的提高有重要意义。
CeO2表面改性;柴油车氧化催化剂;NO氧化;表面Pt原子比例提高;Pt-Ce相互作用
1 Introduction
Diesel engines have achieved widespread applications owing to their reduced CO2emissions, higher fuel efficiency, better reliability and durability1. However, there were many hazardous pollutants emitted from diesel engines, including particulate matter (PM), NOx, CO and unburned hydrocarbons, thereby endangering human health and causing environmental pollution2-4. Due to the lean-burn oxygen rich conditions, conventional three way catalysts (TWCS) couldn’t be sufficient for the diesel exhaust systems in order to meet the increasing stringent government regulations5,6. Consequently, it called for the improvements of both intern combustion engines as well as exhaust after-treatment systems.
Diesel oxidation catalysts (DOCS) were introduced and installed in a train of catalysts for the diesel after-treatment systems that it performed a range of functions7,8. DOC was responsible for oxidizing CO, hydrocarbons and the soluble organic fraction (SOF) from diesel exhaust. Since the more stringent government regulations were carried out, the integrated emission control systems, such as the combination of a series of catalytic systems, DOC+SCR, DOC+DPF and DOC+DPF+SCR were widespread applied recently5,8,9..They were very effective in purifying hydrocarbons, CO, NOxand PM. The NO oxidation functionality would be imposed as a critical role on DOCs in the integrated systems, because the increased NO2formation was beneficial for the fast NH3-SCR reactions and promoting soot oxidation rates in the DPF, therefore many studies about the oxidation of CO, C3H6, SOF and soot particles oxidized by NO2were previously studied9-14.
Generally, the reaction that NO was oxidized into NO2was affected by numerous factors, such as the properties of supports and precious group metals (PGM). On the one hand, the supports with high surface area and excellent structural properties were preferred in view of their stabilized catalytic performance and higher availability of PGM10,11,15-17. On the other hand, the properties of PGM were responsible for NO oxidation to NO2, such as the particle size, dispersion and surface chemical states18,19. Pt0was commonly regarded as active site of diesel oxidation catalysts for CO and HC oxidation. Yang et al.10further suggested that the Pt particle size and Pt0production affected the catalytic oxidation reaction of not only CO and HCs but also NO. In addition, Damyanova and Bueno20thought that the properties of Pt could be significantly influenced by the loading of CeO2on the support and they suggested the improved catalytic activity for reforming of methane with CO2was ascribed to higher Pt dispersion.
Generally, Pt/SiO2-Al2O3was one of the widespread catalytic systems in actual applications. However, one of the disturbing problems was low dispersion of PGM, thus leading to the inferior efficiency of PGM and the relative higher costs. Therefore, numerous studies were carried out to improve the properties of supports and enhance sintering resistance of Pt and thereby higher dispersion was maintained. On the one hand, in Ferreira′ work, the support of Pt/CeO2-Al2O3catalyst was prepared by the improved sol-gel method and the loaded Pt showed higher sintering resistance and thermal stability hence a better catalytic performance was obtained21. Besides, Kaneeda et al.22found that the addition of Pd could also improve thermal stability of Pt in Pt-Pd/Al2O3catalyst for NO oxidation.
On the other hand, Kim and Ihm23investigated effects of CeO2addition and Pt precursor on the activity of Pt/Al2O3catalysts for wet oxidation of Phenol and they assigned improved performance to the differences in Pt dispersion and the Pt-Ce interaction. In addition, Hatanata et al.15demonstrated Pt-O-Ce bond formation under suitable oxidative conditions on the surface of CeO2-ZrO2-La2O3-Pr6O11, which inhibited Pt particle sintering and promoted re-dispersion of agglomerated Pt particles.
The literatures were focused on the enhanced dispersion of PGM or improved thermal stability through interactions between PGM and supports for TWCs and other catalytic systems instead of DOCs. However, reports on surface Pt atomic ratio and impacts of Pt-Ce interaction on oxidation activities were scarce for DOCs. Since most studies were carried out under single NO oxidation condition instead of simulating the industrial application. Hence, in this work, investigations of impacts of surface Pt atomic ratio and Pt-Ce interaction on the evidently improved NO oxidation performances by CeO2-loading for DOCs in simulated industrial condition were carried out.
For the sake of enhancing surface Pt atomic ratio, different amounts of CeO2were introduced into SiO2-Al2O3supports by impregnation method in this work. The NO oxidation activities of all the Pt-based catalysts were evaluated in a continuous flow fixed bed reactor. A series of characterizations such as XRD, TEM, H2-TPR, CO-chemisorption and nitrogen adsorption- desorption was conducted to explore the effects of CeO2addition on catalytic performance and on surface Pt atomic ratio as well as the Pt-Ce interaction.
2 Experimental and computational section
2.1 CeO2modified catalysts preparation
The CeO2-modified SiO2-Al2O3supports (15% SiO285% Al2O3, 15% and 85% are mass fraction), which were supplied by Sinocat Enviromental Technology Co., Ltd. (SINOCAT), were prepared through an incipient wetimpregnation method. The loading contents (mass fraction) of CeO2were 0%, 5%, 10%, 15%, 30%, respectively. The CeO2-modified supports were firstly dried at 100 °C for 2 h and subsequently calcined at 550 °C for 3 h; then the obtained powders were used to prepare the Pt-only diesel oxidation catalysts Pt/SiO2-Al2O3-wCeO2(w = 0%, 5%, 10%, 15%, 30%), which were produced via the same incipient wet-impregnation method and a Pt(NO3)2solution (A.R.) was used as the metal precursor, and the loading content (mass fraction) of Pt was 1.0% for all the catalysts. The impregnated samples were firstly dried at 120 °C for 2 h and subsequently calcined at 550 °C for 3 h. The obtained catalyst powders were introduced into deionized water and slurries with solid content of 45% were acquired, then the slurries were coated onto cylindrical cordierite monoliths (Corning, USA, 400 cells per inch2, 2.5 cm3). Eventually, the samples were dried at 120 °C for 2 h and calcinced at 550 °C for 3 h to get the final catalysts, which were denoted as 0% Ce, 5% Ce, 10% Ce, 15% Ce, and 30% Ce, respectively.
2.2 Measurement of catalytic activity
The catalytic oxidation performance measurements were performed in a continuous flow fixed bed reactor. The monolithic catalysts were placed in a quartz tube reactor with an electrical heater. Firstly, for the measurement of single NO oxidation activity in Fig.1(a), the atmosphere was mixed by 0.02% NO, 8% CO2, 10% O2, and N2balance at a gas space velocity of 60000 h-1. Then, in the catalytic oxidation performance section in Fig.1(b, c, d), the simulative diesel exhaust gases contained a mixture of 0.1% CO, 0.033% C3H6,0.02% NO, 8% CO2, 10% O2, and N2balance24at a gas space velocity of 60000 h-1.
The inlet gas temperature was measured by a K-thermocouple, another 0.5 mm K-thermocouple, in the middle of one of the centre channels inside the monolith catalyst, was used to measure the catalyst bed temperature. The outlet concentrations of CO, C3H6, NO and NO2were detected by FT-IR (Antaris IGS Analyzer, Thermo Scientific, USA).
To maintain more stable catalysts during the reaction process, all the catalysts were pre-treated in simulative diesel exhaust gases (containing .0.1% CO, 0.033% C3H6, 0.02% NO, 8% CO2, 10% O2, and N2balance at a gas space velocity of 30000 h-1) at 550 °C for 3 h, and then detected.
Moreover, NO conversion (X) was calculated in the form NO2formation, and conversion (C) of CO, C3H6,and NO conversion were calculated as follows:

2.3 Catalyst characterization
X-ray diffraction (XRD) patterns of the samples were collected by powder X-ray diffraction on a DX-1000 diffractometer using Cu Kαradiation (λ = 0.15418 nm) operated at 40 kV and 25 mA. The XRD data were recorded for 2θ values from 10° to 80° with an interval of 0.03°. The crystalline phases were identified by comparison with the reference from the International centre for Diffraction Data (ICDD).
The specific surface area, pore volume and pore size distribution were estimated by the nitrogen adsorptiondesorption isotherms on a QUADRASORB SI automated surface area and pore size analyzer (Quantachrome Instruments) at liquid nitrogen temperature (77 K). The specific surface area and pore size measurements were calculated by the Brunauer-Emmett-Teller (BET) method and Barret-Joyner-Halenda (BJH) method respectively. Before adsorption measurements, the samples were degassed at 300 °C for 3 h under vacuum.
CO-chemisorption on Pt was performed at room temperature in a quartz tubular reactor. Before CO chemisorption the samples were first heated to 550 °C in a hydrogen flow 50 mL·min-1and exposed for 0.5 h. After rapidly cooling to room temperature in the same reducing stream, helium (He, 99.999%) was flowed through the catalyst for 20 min. Then, the Pt dispersions of different catalysts were determined by CO chemisorption, and a factor of 0.8 CO/Pt was used to calculate the exposed surface Ptatoms since CO can bind linearly and bridged25,26.
The particle size of the catalysts was observed using transmission electron microscopy (TEM), the Tecnai G2F20 S-TWIN TEM (FEI Company, USA, 200 kV accelerating voltage) equipped with STEM, EDX and HAADF. Prior to the experiment, the powder specimens were suspended in ethanol and dispersed by ultrasonic, after that a droplet was deposited on a perforated carbon film supported by a copper grid.
H2-temperature programmed reduction (H2-TPR) experi- ments were performed in a quartz tubular reactor. Samples (0.1 g) were pre-treated in a flow of helium (He, 99.999%, 35 mL·min-1) at 250 °C for 1 h. After cooling to room temperature, the reduction reaction was performed in a flow of H2(5.0%)-N2mixture (20 mL·min-1) from room temperature to 1000 °C at a heating rate of 10 °C·min-1. Hydrogen consumption as a function of reduction temperature was monitored with a thermal conductivity detector (TCD) cell and recorded. The apparatus was calibrated by the reduction of pure CuO, which was used as a standard to quantify the consumption of H2.
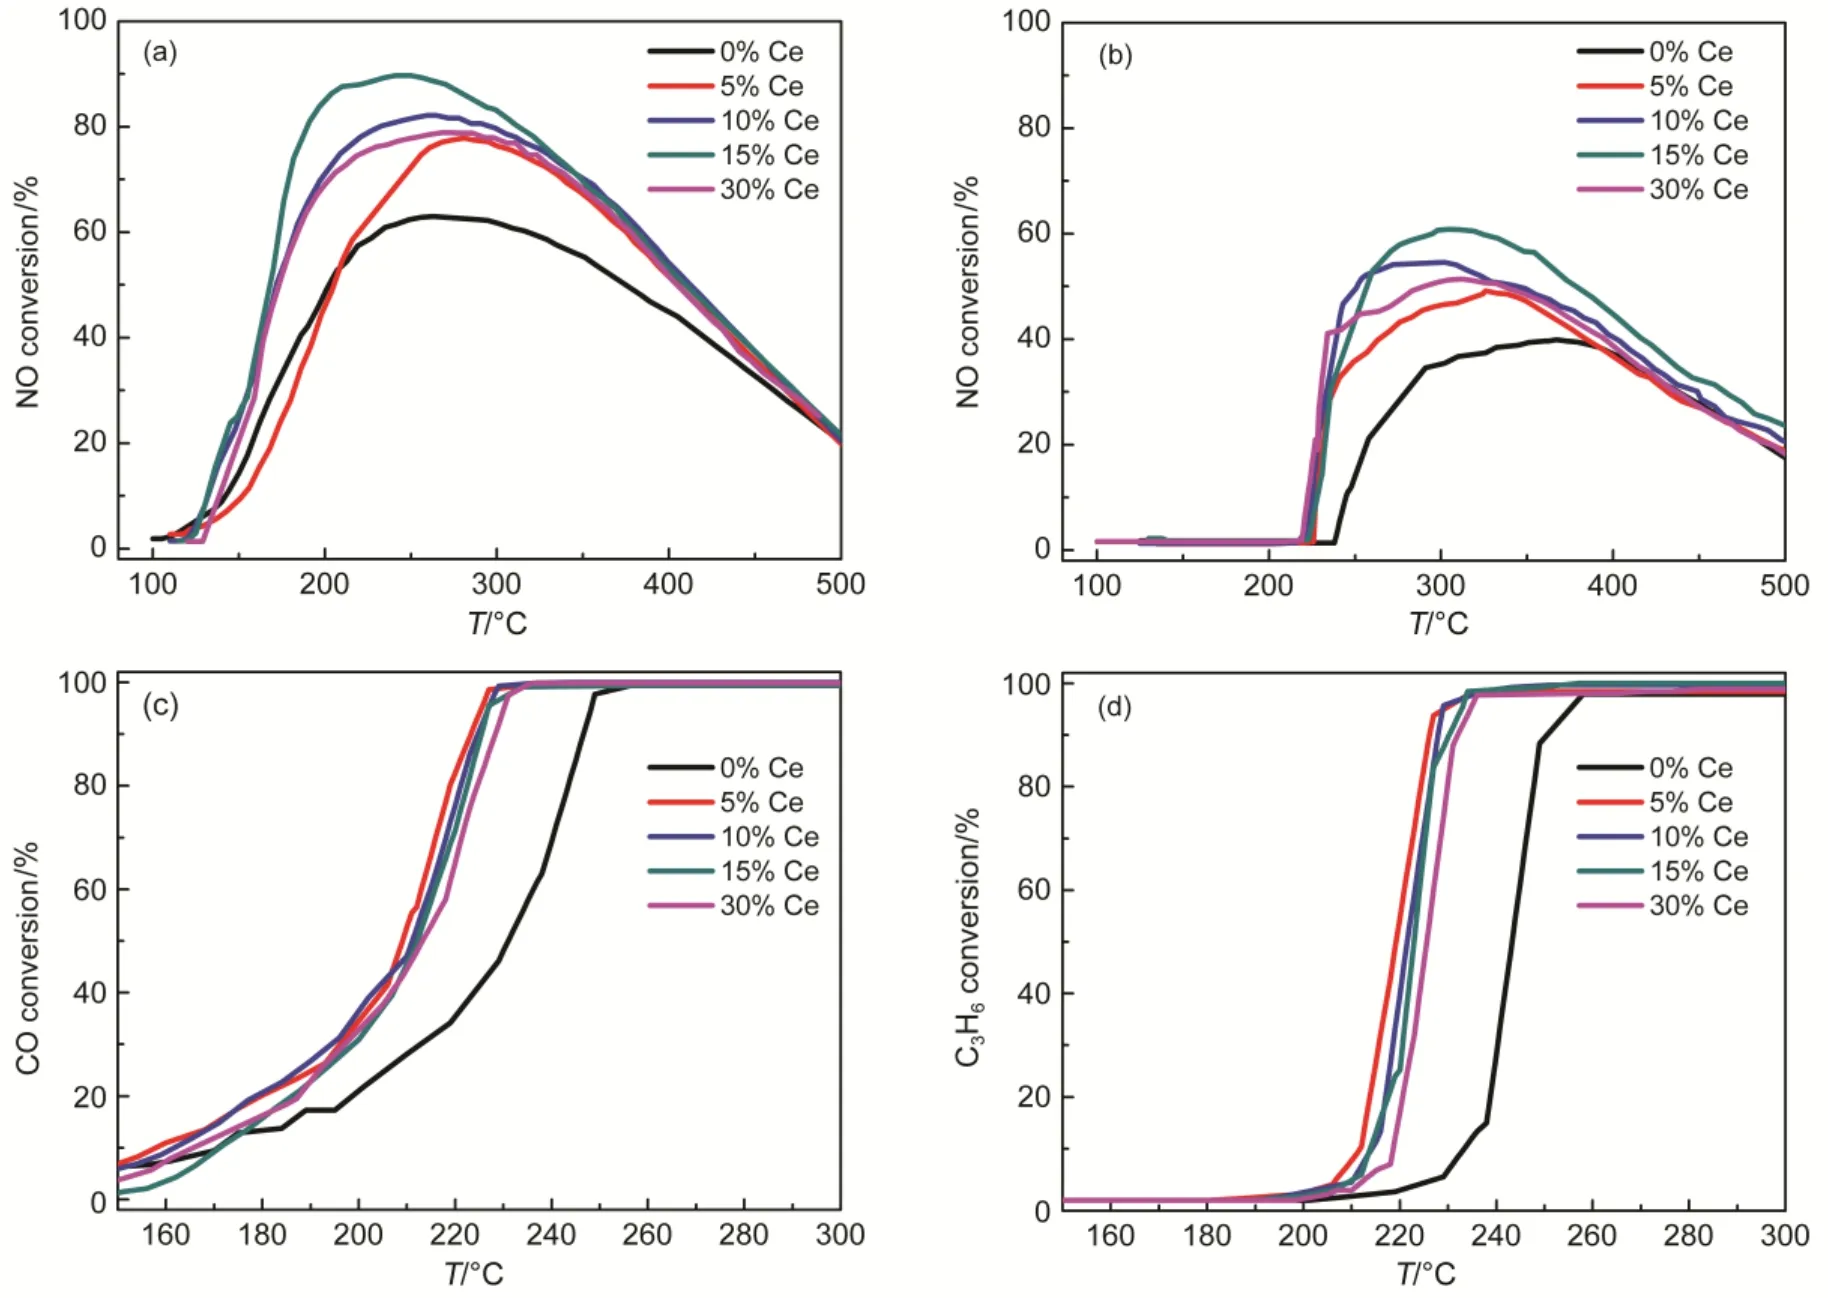
Fig.1 Comparison of single NO (a) oxidation activity and NO (b), CO (c) and C3H6(d) oxidation activity in diesel simulated atmosphere over Pt/SiO2-Al2O3-wCe (w = 0%, 5%, 10%, 15%, 30%) catalysts
3 Results and discussion
3.1 Catalytic performances of CeO2-modified catalysts
3.1.1 NO oxidation comparison and CO, C3H6oxidation performances of the catalysts
In the absence of CO and C3H6, the NO conversion over Pt/SiO2-Al2O3-wCeO2(w= 0, 5, 10, 15, 30%) catalysts were shown in Fig.1(a). On the one hand, the CeO2-modified catalysts exhibited enhanced NO oxidation performance compared to Pt/SiO2-Al2O3catalysts. For example, the maximum NO conversion of CeO2-modified catalysts was commonly higher than 63% (the NO conversion of Pt/SiO2-Al2O3catalyst). On the other hand, it is noteworthy that for the modified catalysts with different amounts of CeO2, NO conversion improved gradually with the increment amount of CeO2. Since the maximum NO oxidation (89%) was achieved at the 15% CeO2-loading, which indicated that there was an upper limit for the optimal CeO2-loading; However, 30% CeO2-loading leaded to slightly degradation of NO conversion (78%) compared to 10% and 15% CeO2-modified catalysts (89%,82% respectively). In addition, it can be observed in Fig.1(a) that for 10%, 15% and 30% CeO2-doping catalysts, the temperature range, which reaches more than 20% NO conversion was about 150 °C, which was about 20 °C lower than 5% CeO2and Pt/SiO2-Al2O3catalysts; Besides, the maximum NO conversion of more than 80% were in the temperature rangeof 185-385 °C for the 10%, 15% and 30% CeO2-doping catalysts; while the range of 215-380 °C for the 5% CeO2and Pt/SiO2-Al2O3catalysts. In short, the relative wider temperature range indicated suitable amounts of CeO2-doping were effective for the increased maximum NO oxidation conversion and the relative enlarged temperature ranges.
In addition, Fig.1(b) displayed NO oxidation performances of catalysts when situated in the diesel simulated atmosphere. All CeO2-modified catalysts achieved NO2formation of 20% at about 230 °C, roughly 30 °C lower than that of the Pt/SiO2- Al2O3catalysts; Beyond that, the maximum NO conversion was higher and the temperature range of CeO2-modified catalysts were 20-30 °C broader than the Pt/SiO2-Al2O3catalysts. It may suggest the significance of CeO2-doping in this catalytic system even in the diesel simulated atmospheres. Although the NO oxidation performance showed similar rule for diesel simulated condition to single NO oxidation atmosphere, results in Fig.1(b) showed that the maximum NO oxidation commonly decreased after implement of diesel simulated condition, in which CO and C3H6were both contained, which obviously inhibited NO conversion27. For example, the optimal NO conversion was decreased from 89% to 61% for 15% CeO2-doping catalyst. Besides, many differences existed in the diesel simulated condition; for example, there is no NO2detected below 210-220 °C, in which the maximum NO conversion was achieved for single NO oxidation condition. Moreover, the NO oxidation degradation at about 300-350 °C may be explained by thermal-equilibrium in that range27.
On the other hand, it can be observed in Fig.1(c) and Fig.1(d) that CO and C3H6oxidation activity were both obviously improved by modification of different amounts of CeO2when compared to Pt/SiO2-Al2O3catalyst. For example, the temperatures for complete conversion of CO and C3H6were both decreased about 20 °C compared to Pt/SiO2-Al2O3catalyst. The results implied CeO2-doping evidently improved the NO oxidation to NO2and meanwhile, the CO and C3H6oxidation performance weren’t compromised. Based on above-mentioned results, it could be safely concluded that CeO2-doping was effective for enhancing the conversion of NO to NO2whether in the presence or absence of CO and C3H6; Furthermore, CeO2-modified Pt/SiO2-Al2O3catalyst exhibited excellent efficiency in improving catalytic oxidation of CO and C3H6, meanwhile the optimal NO oxidation efficiency of 15% CeO2-loading catalyst was achieved. Unlike this study, however, the literatures mainly focused on theoretical studies of influential factors on C3H6, CO oxidations and single NO oxidation or mutual-influences among them. Therefore, besides in patents, the improved oxidation performances of CO, C3H6and NO simultaneously in simulated diesel conditions were rarely reported in literatures.
However, what should be pointed out were the differences of NO2formation before 200 °C in Fig.1(a) and Fig.1(b). In the single NO oxidation section, all the catalysts achieved about 60%-80% NO2formation around 200 °C, while there is no net NO2formation for catalysts exposed in the diesel simulated atmosphere. The strange phenomenon and the mutual influences of reaction atmospheres need further detail investigations, which were carried out in the following section.
3.1.2 Mutual influences between CO, C3H6and NO, NO2
For the sake of achieving further insights into the influence of addition of CO and C3H6on NO oxidation, and determining if there was interaction among NO2, CO, O2and C3H6, the experiments were carried out. Firstly, the NO2formation differences before 200 °C is displayed in Fig.1(a) and Fig.1(b), that may be explained by the result of Fig.2(a), which showed the pulse of CO and C3H6into the stable NO2formation condition inhibited NO2formation evidently. The inhibition may explain there was no net NO2formation before 200 °C in the presence of CO and C3H6in Fig.1(b). Meanwhile, the inhibition could be verified by Katare et al.24. Secondly, below 200 °C in Fig.2(a), the NO2formed could totally be conversed to NO when pulsed; but only 76% and 59% of NO2transformed to NO at 242 and 258 °C respectively, which may be ascribed to the increased CO and C3H6conversion along with the increased temperature, thus less inhibition of CO and C3H6resulted from less competition of active sites27-29. The abovementioned results might illustrate the put-off NO2formation and the sharply increment of NO2formation in the range of 220-250 °C in diesel simulated condition in Fig.1(b).
Besides impacts of CO and C3H6on NO2formation, effects of NO2on CO and C3H6conversion were also investigated for the 15% CeO2-doping catalyst; results in Fig.2(b) revealed the NO2inhibited the combustion of CO and C3H6, since the completely conversion temperature was 20 °C higher in the presence of NO2. However, it was noteworthy that CO conversion was higher below 190 °C in the presence of NO2, which may be caused by the fact that CO reduced the NO2to NO below 200 °C, which could also be verified in Fig.2(c); It illustrated there was little C3H6conversion while about 20% CO conversion in the temperature range of 150-200 °C in the absence of oxygen, the decreased CO concentration may be related to that CO is involved in the reduction of NO2to NO. On the other hand, the little to no net NO2formation before 200 °C in Fig.1(b) might be explained by the almost completely NO2transformation to NO at around 160 °C regardless of the presence of oxygen in Fig.2(d). Moreover, as can be seen from Fig.2(d), NO2could be transformed to NO completelyin the range of 160-200 °C, but NO started to be oxidized to NO2gradually with oxygen at 200 °C and the NO oxidation achieved equilibrium at around 350 °C. It might partly explain the NO2formation temperature delay in Fig2(b) compared to Fig.2(a).
Generally, it can be concluded that there was mutual inhibition between CO, C3H6and NO2, largely owing to the competition of active sites as disclosed by investigations of Auvray27and Mulla29et al. In this study, CO and C3H6obviously inhibited the NO2formation before 200 °C, but the inhibition became weaker with increasing of temperature up to 250 °C. On the contrary, NO2, the product of NO oxidation, inhibited CO and C3H6conversion as well, which might be assigned to competition of active sites and the strong oxidizing character of NO227, which leaded to easily formation of PtOxthat was less active for oxidation reactions for DOCs30,31.
According above all discussed, it could be safely concluded that appropriate CeO2-loading (the optimal was 15% CeO2) was efficient for enhancing oxidation activities for DOCs, especially the NO oxidation activity. The improved performances may be caused by the changes of physicochemical properties and reducibility of Pt resulted from the CeO2-modified supports. Therefore, the possibilities demanded further investigations and a series of characterizations were performed.
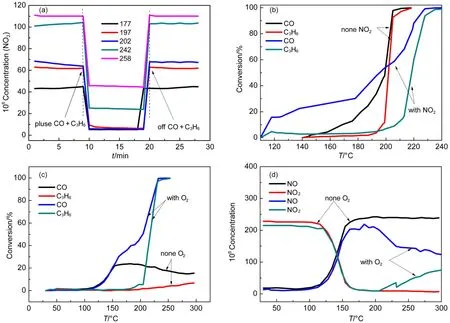
Fig.2 Catalytic performances (a, b, c, d) of Pt/SiO2-Al2O3-15% CeO2samples at different reaction conditions
3.2 Characterizations of the catalysts
3.2.1 Structural characterization of the catalysts
The XRD patterns of SiO2-Al2O3support and corresponding as-prepared catalysts were presented in Fig.3. The SiO2-Al2O3support showed characteristic peaks of alumina based on JCPDS 088-0107, but silicon oxide was not seen clearly most likely due to the amorphous state and low weight ratio. For Pt/ SiO2-Al2O3, Pt(111) peak was clearly visible indicating a large crystallite size of roughly 27 nm based on Scherrer equation, which most likely originated from the low Pt dispersion on SiO2-Al2O3support. As in the case of 3% Ce-modified catalyst, platinum particle with crystallite size of 19 nm could also be detected implying the poor dispersion of platinum species at such a low loading of CeO2. But the smaller platinum crystallite size of Pt/SiO2-Al2O3-3% CeO2compared to Pt/ SiO2-Al2O3catalyst indicated relatively enhanced dispersion of platinum hence smaller crystallites over CeO2-modified Pt-based catalysts; which could be further confirmed by the weaker or disappearance of Pt (111) peak in the case of Pt/ SiO2-Al2O3-wCeO2(w = 5%, 10%, 15%, 30%) catalysts. On the one hand, we might attribute the weaker ordisappearance of platinum diffraction peak to the Pt-Ce interaction that the metal-support interaction lead to the weakened diffraction of X-ray. Owing that Pt preferred interacted with CeO2to Al2O332. On the other hand, it may partly correspond to the oxidation of Pt by ceria at the metal/support interface. The produced Pt2+/Pt4+ions probably dissolve in the mixed oxides lattice, escaping from the detection of XRD technique23,28.
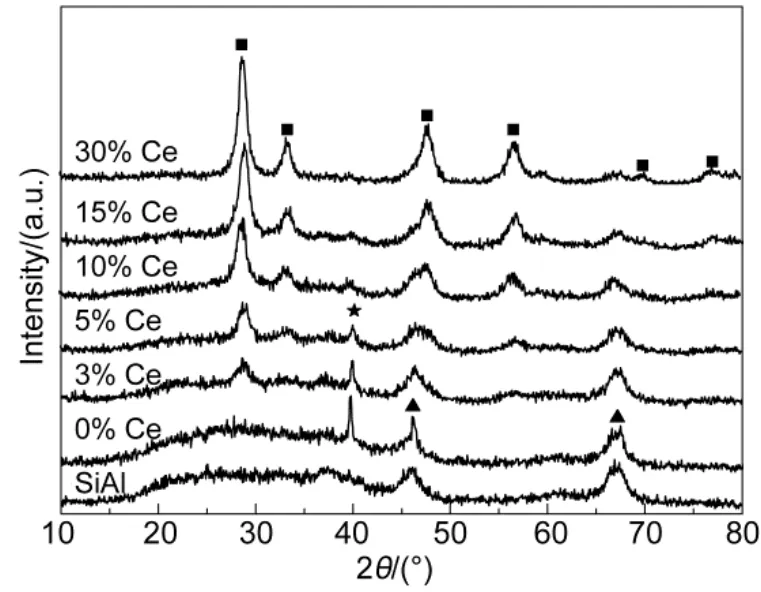
Fig.3 XRD patterns of SiO2-Al2O3supports and Pt/SiO2-Al2O3-wCeO2(w = 0%, 3%, 5%, 10%, 15%, 30%) catalysts■ cubic CeO2, ▲ γ-Al2O3, ★ Pt (111)
As in the case of these appropriate amounts of CeO2-modified Pt-based catalysts, the diffraction peaks of cubic CeO2phase merged with increasing CeO2content in the samples. According JCPDS 043-1002, ceria showed characteristic peaks of 28.55°, 33.08°, 47.48°, 56.34°, 76.71° and 79.08°. Furthermore, the XRD profiles of different CeO2contents displayed narrower and stronger intensities of diffraction peaks with increment of CeO2loading, indicating higher crystalline and larger crystallite size of CeO2. In addition, it seems that the crystalline of SiO2-Al2O3is reduced by impregnation of CeO2.
Beyond that, textural and structural properties of SiO2-Al2O3supports and the corresponding Pt-supported catalysts are summarized in Table 1. The textural properties of CeO2- modified catalysts exhibited slightly differences on the catalytic performance seen from Table 1. On the one hand, the surface areas were similar below15% CeO2-loadig. But the surface area of 30% CeO2-loading catalyst decreased from 153 to 119 m2·g-1; it was related to the blocking effects on support pores33. It was one of the reasons for NO oxidation activity degradation. However, in general, such slight variations in catalyst surface area exhibited little to no influence on the catalytic performance.
Taking the structural and textural properties into consideration, it could be safely concluded that appropriate amounts of CeO2-modified catalysts were effective in depression of Pt particle growth, hence higher efficiency of active sites. To get deeper insights into relationship between improved NO oxidation activity and surface Pt atomic ratio; characterizations were carried out, such as CO-chemisorp-tion and TEM.
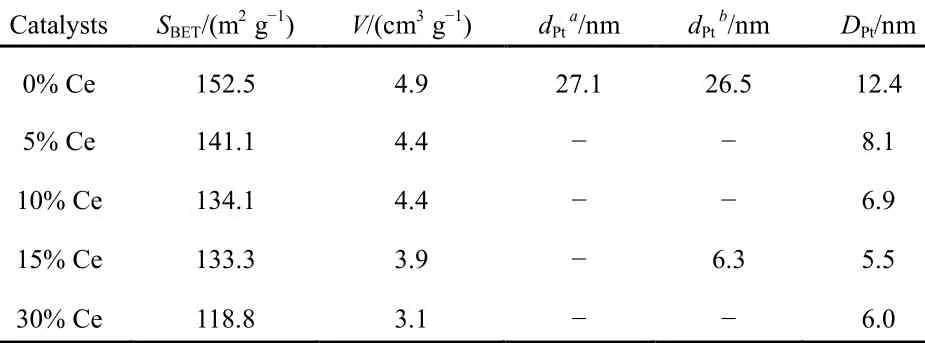
Table 1 Textural and structural properties of Pt/SiO2-Al2O3-wCeO2(w = 0%, 5%, 10%, 15%, 30%) catalysts
3.2.2 CO-chemisorption
The dispersion of platinum was measured by CO chemisorptions, and a factor of 0.8 CO/Pt was used to calculate the exposed Pt atoms since CO can bind linearly and bridged25,26. As can be observed in Fig.4, the dispersion of Pt was obviously enhanced by CeO2-doping due to the fact all CeO2-modified catalysts possessed higher dispersion compared to Pt/SiO2-Al2O3catalyst (9.99% surface atom relative to total atom, which was lowest of all samples). Regarding CeO2- modified samples, the dispersion was simply increasing with fortified CeO2-loading. For example, the dispersion was highest (22.57%) for 15% CeO2modified sample among all catalysts, which indicated the 15% CeO2-doping was the optimal level. However, increasing CeO2content further provokes a decrease of Pt dispersion, which could be assigned to the coverage of support pores with partially excessive CeO2, which could be confirmed by more sharply decreasing surface area and pore volume of 30% CeO2-loading catalysts listed in Table 1.
Furthermore, as was clearly observed in Fig.4, the highest dispersion (22.57%) was in line with the optimal NO oxidation activity (61%) even in the presence of CO and C3H6, which seemed to be reverse to the conclusion of many literatures, which implied that NO oxidation increased with the decreased dispersion34-36. The essence of literature′conclusion might be assigned to smaller Pt particles were easily to be oxidized and larger particles exhibited higher NO oxidation activity due to less Pt oxide formation, since the presence of Pt oxides prevents NO adsorption on the active sites30,31. In other words, the suppression of Pt oxide formation, instead of particle size of Pt particles or Pt dispersion, was the significant criterion for the NO oxidation performance. In addition, the result in Yang′s work implied the Pt particle size and Pt0production affected the catalytic reactivity of NO oxidation simultaneously10.
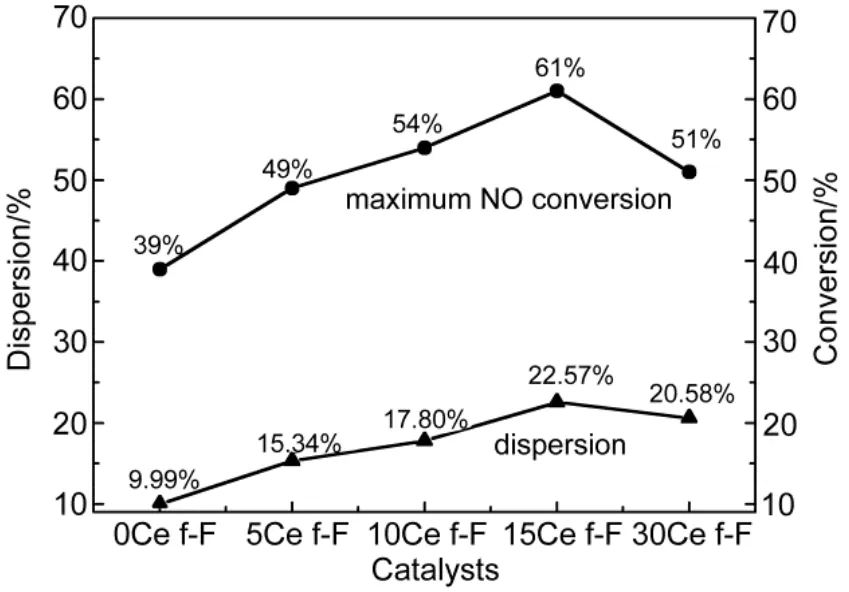
Fig.4 Relationship between dispersion and optimal NO conversion to NO2
Therefore, the diverse Pt particle size may react differently to the oxidation reaction owing to the complexity of the diesel atmosphere. Meanwhile, the intricate impacts of supports and physicochemical properties of Pt on the catalytic performances further complicated the phenomenon and the detail reasons were not easy to surmise and did need further researches. However, what could be assured was the formation of PtOx, not simply the Pt particle size, was the critical criterion for the oxidation performance.
As above mentioned, it can be concluded that appropriate CeO2-loading could improve Pt dispersion evidently; hence, smaller surface Pt particles, higher Pt surface to volume ratios and more active sites were obtained. And it could confirm depression of Pt particle size growth in XRD. The higher surface Pt atomic ratio leaded to the improved catalytic oxidation of CO, NO and C3H6, especially the NO oxidation activity; which may owe that NO oxidation performance was mainly depended on the chemical and physical properties of Pt based on literature37. On the other hand, reducibility of catalysts was another significant criterion in diesel atmosphere in industrial application. Since the catalysts possessed better reducibility could adapt to the changeable diesel atmosphere. Therefore, H2-TPR was applied to further investigate reduction properties changes of catalysts caused by Pt-Ce interaction.
3.2.3 Redox properties
The TPR profiles of SiO2-Al2O3support, SiO2-Al2O3-15% CeO2support and Pt/SiO2-Al2O3, Pt/SiO2-Al2O3-15% CeO2catalysts are shown in Fig.5. Firstly, TPR curves of SiO2-Al2O3and Pt/SiO2-Al2O3were compared, the presence of three peaks located at approximately 125, 250 and 461 °C were corresponding to a series of different Pt species. TPR signal at 125 °C can be ascribed to the reduction of PtO238, considering the samples were calcined in air for 3 h. Further, the peak located at 250 °C could be associated with the reduction of Pt oxide species weakly associated with alumina surface39. Moreover, the temperature features of high intensity at 461 °C could be connected with the reduction of clustered and isolated platinum particles39. Secondly, the TPR profiles of SiO2-Al2O3and SiO2-Al2O3-15%CeO2supports in Fig.5 were also compared, which implied that CeO2exhibited main peaks at around 552 and 880 °C with a small shoulder at about 750- 800 °C. The TPR shape of CeO2was very similar as that reported in the literature and it can be explained by the stepwise reduction process23. The shoulder at about 750 °C was related to the reduction of superficial oxygen (O2-or O-anions) of crystalline complex, causing the partially reduction of CeO2to Ce2O3. In addition, the major peaks at approximately 552 and 880 °C were assigned to the surface reduction as well as bulk reduction of CeO2by elimination of O2-anions of the lattice and formation of Ce2O323.
Beyond that, the H2-TPR profiles Pt/SiO2-Al2O3-15% CeO2and Pt/SiO2-Al2O3catalysts were also compared in Fig.5. Firstly, the peak at 118 °C was attributed to the combined reduction of Pt and ceria surface species with the main contribution from the ceria component because the peak intensity evidently increased compared to Pt/SiO2-Al2O3catalyst. Secondly, The TPR profile of Pt/SiO2-Al2O3-15%CeO2catalyst was not a direct superimposition of those for Pt/SiO2-Al2O3and SiO2-Al2O3-15%CeO2, indicating the existence of Pt-Ce interaction on the surface20. Moreover, it was another Pt-Ce interaction illustration that H2-consumption of Pt/SiO2-Al2O3-15% CeO2(7.0 mmol·g-1) was larger than plus of Pt/SiO2-Al2O3(0.4 mmol·g-1) and 15% Ce/SiO2-Al2O3(6.5 mmol·g-1). In addition, reduction peaks located at 238 and 386 °C could be assigned to reductions of bulk PtOxin intimate/loose contact with ceria and superficial ceria oxide reduction, with the main contribution of ceria component23. The lower temperature (at around 386 °C) of dispersed surface ceria compared to that of (at about 552 °C) SiO2-Al2O3-15% CeO2support further confirmed that Pt-Ce interaction advanced ceria oxide species reduction. In other words, the presence of Pt facilitated surface CeO2reduction, in line with the proposal that the presence of PGM could increase the oxygen storage capacity of CeO2because of noble metal-CeO2interactions32.
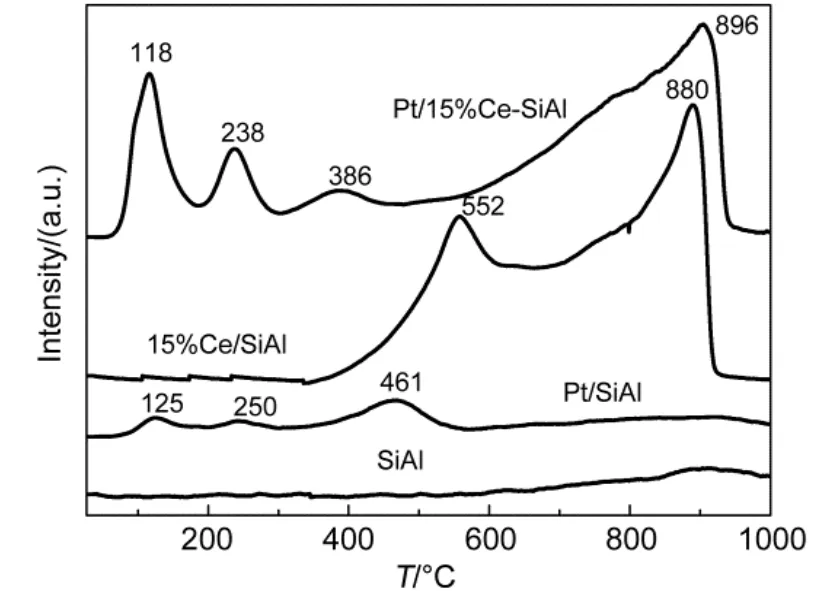
Fig.5 H2-TPR profiles of SiO2-Al2O3, SiO2-Al2O3-15% CeO2supports and Pt/SiO2-Al2O3-wCeO2(w = 0, 15%) catalysts
Beyond that, the peak at 461 °C in the profile of Pt/SiO2-Al2O3observed in Fig.5 corresponding to a maximum reduction rate of Pt oxide species was shifted to a lowertemperature at 118 °C after 15% CeO2additions, which might owe that CeO2improved platinum reducibility significantly. In summary, CeO2-doping enhanced the reduction of both CeO2and Pt through Pt-Ce interaction.
In general, the Pt-Ce interaction might partly be confirmed in the analysis of reduction properties, which could also be seen by the weaker or disappearance of Pt(111) peak with the suitable CeO2-loading in XRD. Since better oxidation performance could be achieved for catalysts with better reducibility, H2-TPR results implied that the improved NO oxidation activity partially depended on higher reducibility of 15% CeO2-modified catalyst in this paper.
In addition, there was a report demonstrated that CO and C3H6oxidation activity was superior on Pt particles of 2-3 nm, but Pt particles larger than 5 nm were preferred for NO oxidation activity40. To obtain more information about Pt particle size, surface Pt atomic ratio as well as Pt-Ce interaction, and related them to NO oxidation activity, TEM was performed.
3.2.4 Morphology and metal particle size of catalysts
The morphology and the metal particle size of the asprepared Pt/SiO2-Al2O3and Pt/SiO2-Al2O3-15% CeO2were investigated by TEM and presented in Fig.6; for the sake of confirming the presence of Pt and CeO2and distinguishing them from each other, Pt/SiO2-Al2O3-15% CeO2samples was subjected to HRTEM analysis presented in Fig.6(e) and Fig.6(f). Firstly, the presence of Pt species (Pt0and PtO) and CeO2were evidenced by d-spacing measurements [Fig.6(e), Fig.6(f)] for 15% CeO2-modified catalyst. Also, it was observed the mean Pt particle size was 6.3 nm estimated from 100 Pt particles, which was beneficial for NO oxidation activity as reported40. It can be seen from Fig.6(e) and Fig.6(f) lattice fringe with d-spacing of 0.23 nm was indexed to the (111) lattice plane of Pt, while the lattice fringes with d-spacing of 0.27 nm and 0.31nm were indexed to the (200) and (111) lattice plane of cubic CeO2, respectively. The literature reports suggested that the CeO2cubes, exposing primarily the (100) facet, cannot maintain Pt in a highly-dispersed state. The catalysts containing either the CeO2polyhedral or rods, which exposed the (111) facet, were shown to trap Pt in an atomically dispersed state41,42. The CeO2(111) facets detected in 15% CeO2-modified sample might be ascribed to CeO2(111) facets of polyhedral or rods, which were effective for enhancing dispersion. And it agreed with improved dispersion in CO-chemisorption and the improved catalytic oxidation activity.
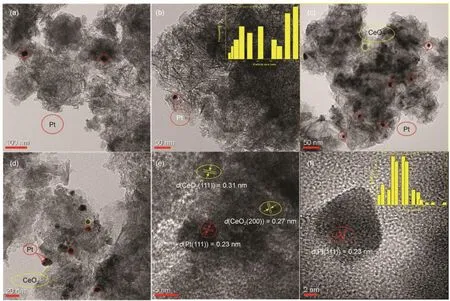
Fig.6 The morphology, the metal particle size and High-Resolution TEM (HRTEM) of catalysts
However, the improved NO oxidation activity with enhanced dispersion in this work may be ascribed to higher ratios of surface Pt atoms relative to the total Pt atoms on the same Pt loading (mass fraction of 1%), indicating higheramounts of Pt active sites was available for catalytic oxidation, the higher efficiency of Pt exhibited heavily importance on the NO oxidation reaction37. Another possibility might be the different ranges of Pt particles they lied in. The in-situ XAFS investigation of Boubnov et al.40demonstrated the CO oxidation was most efficient over edges of Pt crystallite of 2-3 nm, while NO oxidation was more efficient over planar of Pt particles larger than roughly 5 nm. More importantly, the most active sites for NO oxidation were the Pt particles least prone to surface oxidation reported by many literatures30,34-36.
No Pt particles could be distinguished from the HRTEM images of the Pt/SiO2-Al2O3sample in Fig.6(a), Fig.6(b) which may owe to the poor dispersion of platinum supported on SiO2-Al2O3at such a low Pt loading. Further, the average particle size of platinum was about 26.5 nm estimated from 40 Pt particles, which was roughly three times larger than 15% CeO2-modified catalyst. Besides, TEM images in Fig.6(c), Fig.6(d) highlighted the presence of homogeneously dispersed Pt nanoparticles with no much-pronounced agglomerations in the case of Pt/SiO2-Al2O3-15% CeO2compared to Pt/SiO2- Al2O3sample.
Further, a thin layer coating the Pt particles was seen in Fig.6(d). This layer was interpreted as ceria oxide, indicating strong metal support interaction (SMSI) and had been discussed in H2-TPR43. In addition, the HR-TEM images in Fig.6(e) showed simultaneously of Pt (111), CeO2(200) and CeO2(111) are distributed in the metal/Ceria interface implied the possible Pt-Ce interaction and similar phenomena was reported33.
In general, the fact that better dispersion of platinum supported on CeO2-modified sample confirmed by TEM and HRTEM is unanimous to the improved catalytic oxidation performance, especially the NO oxidation activity. Due to that NO oxidation activity was heavily depended on the properties of platinum according to literature37. On the other hand, the highly dispersed Pt in TEM was consistent with results of XRD and CO-chemisorptions reported in Fig.3 and Fig.4 respectively. Moreover, the possible Pt-Ce interaction might be implied by the simultaneously of Pt (111), CeO2(200) and CeO2(111) detected in the metal/Ceria interface in Fig.6(e), as discussed in H2-TPR.
4 Conclusions
Based on the above-mentioned results, it can be safely concluded that ceria addition improved NO oxidation activity evidently, with the optimal CeO2-loading of 15%. For 15% CeO2-modified catalyst, 40%-61% NO conversion could be obtained in the relative broad temperature range of 245-456 °C even in the presence of CO and C3H6. Compared to that of Pt/SiO2-Al2O3, the outstanding activities of CeO2-modified samples were attributed to the increased surface Pt atomic ratio and enhanced Pt-Ce interaction, especially related to the increased surface Pt atomic ratio. Furthermore, purifying efficiency of both CO and C3H6was not compromised regardless of the enhanced NO conversion, which was an evidently improvement for DOC application. More importantly, the increased NO2formation exhibited essential roles in fast NH3-SCR and lower soot oxidation temperature in CDPF of integrated diesel systems in industrial application.
Acknowledgment: We acknowledged the discussion with Professor YUAN Shan-Dong and GONG Mao-Chu at College of Chemistry, Sichuan University.
(1) Johnson, T. V. SAE Int. J. Engines 2014, 7, 1207. doi: 10.4271/2014-01-1491
(2) Morlang, A.; Neuhausen, U.; Klementiev, K. V.; Schütze, F. W.; Miehe, G.; Fuess, H.; Lox, E. S. Appl. Catal. B 2005, 60, 191. doi:org/10.1016/j.apcatb.2005.03.007
(3) Farrauto, R. J.; Voss, K. E. Appl. Catal. B 1996, 10, 29. doi: 10.1016/0926-3373(96)00022-7
(4) Sola, C.; Abedi, A.; Hayes, R. E.; Epling, W. S.; Votsmeier, M. Can. J. Chem. Eng. 2015, 92, 1496. doi: 10.1002/cjce.v92.9
(5) Russell, A.; Epling, W. S. Catal. Rev. 2011, 53, 337. doi: 10.1080/01614940.2011.596429
(6) Webster, D. E. Top. Catal. 2001, 16-17, 33. doi: 10.1023/A:1016618411613
(7) Yang, Z. Z.; Chen, Y. D.; Zhao, M.; Zhou, J. F.; Gong, M. C.; Chen, Y. Q. Chin. J. Catal. 2012, 33, 819. [杨铮铮, 陈永东, 赵 明, 周菊发, 龚茂初, 陈耀强. 催化学报, 2012, 33, 819.] doi: 10.3724/SP.J.1088.2012.11108
(8) Epling, W. S.; Campbell, L. E.; Yezerets, A. Catal. Rev. 2007, 46, 163. doi: org/10.1081/CR-200031932
(9) Zhou, J. F.; Zhao, M.; Peng, N.; Yang, Z. Z.; Gong, M. C.; Chen, Y. Q. Acta Phys. -Chim. Sin. 2012, 28, 1448. [周菊发, 赵 明, 彭娜, 杨铮铮, 龚茂初, 陈耀强. 物理化学学报, 2012, 28, 1448.] doi: 10.3866/PKU.WHXB201204011
(10) Yang, Z.Z.; Li, J.; Zhang, H.; Yang, Y.; Gong, M.; Chen, Y. Catal. Sci. Technol. 2015, 5, 2358. doi: 10.1039/C4CY01384K
(11) Yang, Z. Z.; Zhang, N.; Cao, Y.; Gong, M. C.; Zhao, M.; Chen, Y. Q. Catal. Sci. Technol. 2014, 4, 3032. doi: 10.1039/C4CY00424H
(12) Yang, Y.; Yang, Z. Z.; Xu, H. D.; Xu, B. Q.; Zhang, Y. H.; Gong, M. C.; Chen, Y. Q. Acta Phys. -Chim. Sin. 2015, 31, 2358. [杨 怡, 杨铮铮, 徐海迪, 徐宝强, 张艳华, 龚茂初, 陈耀强. 物理化学学报, 2015, 31, 2358.] doi: 10.3866/PKU.WHXB201510135
(13) Chen, Y. D.; Wang, L.; Guan, X. X.; Liu, Y. B.; Gong, M. C.; Chen, Y. Q. Acta Phys. -Chim. Sin. 2013, 29, 1048. [陈永东, 王 磊, 关小旭, 刘永兵, 龚茂初, 陈耀强. 物理化学学报, 2013, 29, 1048.] doi: 10.3866/PKU.WHXB201303051
(14) Yang, Z. Z.; Yang, Y.; Zhao, M.; Gong, M. C.; Chen, Y. Q. Acta Phys. -Chim. Sin. 2014, 30, 1187. [杨铮铮, 杨 怡, 赵 明, 龚茂初, 陈耀强. 物理化学学报, 2014, 30, 1187.] doi: 10.3866/PKU.WHXB201404281
(15) Hatanaka, M.; Takahashi, N.; Tanabe, T.; Nagai, Y.; Dohmae, K.; Aoki, Y.; Yoshida, T.; Shinjoh, H. Appl. Catal. B 2010, 99, 336. doi: 10.1016/j.apcatb.2010.07.003
(16) Mulla, S. S.; Chen, N.; Cumaranatunge, L.; Blau, G. E.; Zemlyanov, D. Y.; Delgass, W. N.; Epling, W. S.; Ribeiro, F. H. J. Catal. 2006, 241, 389. doi: 10.1016/j.jcat.2006.05.016
(17) Benard, S.; Retailleau, L.; Gaillard, F.; Vernoux, P.; Giroir-Fendler, A. Appl. Catal. B 2005, 55, 11. doi: 10.1016/j.apcatb.2004.07.005
(18) Kliewer, C. J.; Somorjai, G. A. Catal. Lett. 2010, 137, 118. doi: 10.1007/s10562-010-0353-9
(19) Denton, P.; Giroir-Fendler, A.; Praliaud, H.; Primet, M. J. Catal. 2000, 189, 410. doi: 10.1006/jcat.1999.2708
(20) Damyanova, S.; Bueno, J. M. C. Appl. Catal. A 2003, 253, 135. doi: 10.1016/S0926-860X(03)00500-3
(21) Ferreira, A. P.; Zanchet, D.; Rinaldi, R.; Schuchardt, U.; Damyanova, S.; Bueno, J. M. C. Appl. Catal. A 2010, 388, 45. doi: 10.1016/j.apcata.2010.08.033
(22) Kaneeda, M.; Iizuka, H.; Hiratsuka, T.; Shinotsuka, N.; Arai, M. Appl. Catal. B 2009, 90, 564. doi: 10.1016/j.apcatb.2009.04.011
(23) Kim, S. K.; Ihm, S. K. Ind. Eng. Chem. Res. 2002, 41, 1967. doi: 10.1021/ie010590p
(24) Katare, S. R.; And, J. E. P.; Laing, P. M. Ind. Eng. Chem. Res. 2007, 46, 2445. doi: 10.1021/ie0612515
(25) Auvray, X. P.; Olsson, L. Ind. Eng. Chem. Res. 2013, 52, 14556. doi: 10.1021/ie402153u
(26) Foger, K.; Anderson, J. R. Appl. Surf. Sci. 1979, 2, 335. doi: 10.1016/0378-5963(79)90067-9
(27) Auvray, X.; Pingel, T.; Olsson, E.; Olsson, L. Appl. Catal. B 2013, 129, 517. doi: 10.1016/j.apcatb.2012.10.002
(28) Wu, X.; Fan, J.; Ran, R.; Weng, D. Chem. Eng. J 2005, 109, 133. doi: 10.1016/j.apcatb.2007.11.022
(29) Mulla, S. S.; Chen, N.; Delgass, W. N.; Epling, W. S.; Ribeiro, F. H. Catal. Lett. 2005, 100, 267. doi: 10.1007/s10562-004-3466-1
(30) Weiss, B. M.; Iglesia, E. J. Phys. Chem. C 2009, 113, 13331. doi: 10.1021/jp902209f
(31) Getman, R. B.; Schneider, W. F.; Smeltz, A. D.; Delgass, W. N.; Ribeiro, F. H. Phys. Rev. Lett. 2009, 102, 076101. doi: 10.1103/PhysRevLett.102.076101
(32) Yao, H. C.; Yao, Y. F. Y. J. Catal. 1984, 86, 254. doi: /10.1016/0021-9517(84)90371-3
(33) Fan, J.; Wu, X.; Wu, X.; Liang, Q.; Ran, R.; Weng, D. Appl. Catal. B 2008, 81, 38. doi: 10.1016/j.apcatb.2007.11.022
(34) Altman, E. I.; Gorte, R. J. Surf. Sci. 1988, 195, 392. doi: 10.1016/0039-6028(88)90349-4
(35) Smeltz, A. D.; Getman, R. B.; Schneider, W. F.; Ribeiro, F. H. Catal. Today 2008, 136, 84. doi: 10.1016/0039-6028(88)90349-4
(36) Borgna, A.; Normand, F. L.; Garetto, T.; Apesteguia, C. R.; Moraweck, B. Catal. Lett. 1992, 13, 175. doi: 10.1007/BF00770989
(37) Hauff, K.; Dubbe, H.; Tuttlies, U.; Eigenberger, G.; Nieken, U. Appl. Catal. B 2013, 129, 273. doi: 10.1016/j.apcatb.2012.09.022
(38) Ammendola, P.; Barbato, P. S.; Lisi, L.; Ruoppolo, G.; Russo, G. Surf. Sci. 2011, 605, 1812. doi: 10.1016/j.susc.2011.06.018
(39) Tankov, I.; Arishtirova, K.; Bueno, J. M. C.; Damyanova, S. Appl. Catal. A 2014, 474, 135. doi: 10.1016/j.apcata.2013.08.030
(40) Boubnov, A.; Dahl, S.; Johnson, E.; Molina, A. P.; Simonsen, S. B.; Cano, F. M.; Helveg, S.; Lemus-Yegres, L. J.; Grunwaldt, J. D. Appl. Catal. B 2012, 126, 315. doi: 10.1016/j.apcatb.2012.07.029
(41) Singhania, N.; Anumol, E. A.; Ravishankar, N.; Madras, G. Dalton Trans. 2013, 42, 15343. doi: 10.1039/c3dt51364e
(42) Mai, H. X.; Sun, L. D.; Zhang, Y. W.; Si, R.; Feng, W.; Zhang, H. P.; Liu, H. C.; Yan, C. H. J. Phys. Chem. B 2016, 109, 24380. doi: 10.1021/jp055584b
(43) Nagai, Y.; Hirabayashi, T.; Dohmae, K.; Takagi, N.; Minami, T.; Shinjoh, H.; Matsumoto, S. I. J. Catal. 2006, 242, 103. doi: 10.1016/j.jcat.2006.06.002
Effects of CeO2Addition on Improved NO Oxidation Activities of Pt/SiO2-Al2O3Diesel Oxidation Catalysts
HUANG Yu-Fen1ZHANG Hai-Long2YANG Zheng-Zheng3ZHAO Ming1HUANG Mu-Lan1LIANG Yan-Li1WANG Jian-Li1,*CHEN Yao-Qiang1,*
(1Key Laboratory of Green Chemistry & Technology of the Ministry of Education, College of Chemistry, Sichuan University, Chengdu 610064, P. R. China;2College of Chemical Engineering, Sichuan University, Chengdu 610064, P. R. China;3College of Environmental Science and Engineering, China West Normal University, Nanchong 637009, Sichuan Province, P. R. China)
The catalytic activities for NO oxidation achieved by different amounts of CeO2-modified Pt/SiO2-Al2O3catalysts Pt/SiO2-Al2O3-wCeO2(the mass fraction w being 0%, 5%, 10%, 15%, 30%), prepared using step-wise impregnation, were investigated in the presence and absence of CO and C3H6. The results showed that the NO oxidation activity could be efficiently improved by modification of CeO2,wherein the 15%-CeO2-modified catalyst exhibited the maximum NO conversion of 61% even in the presence of CO and C3H6, which were proved to inhibit NO2formation in this study. A series of characterization methods were performed over the as-prepared samples to correlate their surface and structural characteristics with their enhanced NO oxidation activities. CO-chemisorption illustrated that appropriate CeO2-loading was effective for enhancing Pt dispersion, thus enhancing Pt surface-to-volume ratio, confirmed by transmission electron microscope (TEM) images. X-Ray Diffraction (XRD) further suggested that ceria addition could suppress the growth of the Pt crystal, resulting in higher surface Pt atomic ratio. Further, H2temperature-programmed reduction (H2-TPR), together with TEM results, implied that the presence of ceria could enhance the interaction between metal and supports, thus facilitating reducibility of both active platinum and ceria. Hence, this study displays that ceria could act as a dispersion promoter and a reducibility booster, both of which are beneficial to NO oxidation activity. The improved NO oxidation activity is significant for the efficient purification of diesel integrated catalytic system.
CeO2-modified catalysts; Diesel oxidation catalysts; NO oxidation; Increased surface Pt atomic ratio; Pt-Ce interaction
December 12, 2016; Revised: March 13, 2017; Published online: March 29, 2017.
O643
10.3866/PKU.WHXB201703292
*Corresponding authors. CHEN Yao-Qiang, Email: nic7501@scu.edu.cn; Tel/Fax: +86-28-85418451. WANG Jian-Li, Email: wangjianli@scu.edu.cn; Tel/Fax: +86-28-85418451
The project was supported by the National Natural Science Foundation of China (21173153) and National Hi-Tech Research and Development Program of China (863) (2015AA034603).
国家自然科学基金(21173153)和国家高技术研究发展计划项目(863) (2015AA034603)资助
© Editorial office of Acta Physico-Chimica Sinica
