基于线粒体CO Ⅰ基因和控制区序列的辽宁沿海弯棘斜棘群体遗传多样性和遗传结构分析
2017-05-16李玉龙刘修泽于旭光李轶平
李玉龙 刘修泽 于旭光 李轶平 付 杰 董 婧
(辽宁省海洋水产科学研究院, 辽宁省海洋生物资源与生态学重点实验室, 大连 116023)
基于线粒体CO Ⅰ基因和控制区序列的辽宁沿海弯棘斜棘群体遗传多样性和遗传结构分析
李玉龙 刘修泽 于旭光 李轶平 付 杰 董 婧
(辽宁省海洋水产科学研究院, 辽宁省海洋生物资源与生态学重点实验室, 大连 116023)
为研究辽宁沿海弯棘斜棘(Repomucenus curvicornis)自然群体的遗传多样性及遗传结构, 采用PCR扩增获得辽宁沿海弯棘斜棘辽东湾群体(n=22)及黄海北部群体(n=18)线粒体的COⅠ及控制区(CR)部分DNA序列片段, 进行序列比较及遗传多样性分析。获得弯棘斜棘COⅠ基因片段624 bp, 其A、T、C、G平均含量分别为24.09%、31.04%、25.28%和19.59%; CR片段460 bp, 其A、T、C、G平均含量分别为32.96%、32.80%、14.86%和19.38%。基于COⅠ基因和CR序列得到的两群体变异位点数、平均核苷酸差异数、单倍型多样性指数以及核苷酸多样性指数分别为: 38、4.67、0.96±0.02和0.0075±0.0042; 26、3.35、0.97±0.02和0.0073±0.0043。序列分析结果均显示, 辽东湾群体的遗传多样性低于黄海北部群体。分子方差(AMOVA)分析结果显示, 基于COⅠ基因片段辽东湾与黄海北部群体间无明显遗传分化(Fst=0.0091, P=0.25) 而基于CR序列两群体间具有较小但接近显著的遗传分化(Fst=0.0264, P=0.09)。研究表明, 线粒体CR序列与COⅠ基因均可作为检测弯棘斜棘群体遗传多样性的有效分子标记, 但CR序列遗传分化的敏感度要高于COⅠ基因, 更适合作为弯棘斜棘群体遗传研究的分子标记。
弯棘斜棘; 线粒体DNA; COⅠ基因; 控制区序列; 遗传多样性; 遗传分化
1 材料与方法
1.1 样品采集及种类鉴定
1.2 DNA提取、扩增和测序
采用CTAB法提取基因组DNA后, 分别利用引物COⅠ a: 5′-CCTGCAGGAGGAGGAGAYCC-3′和COⅠb: 5′-ATGCATATCTATCTGCCATTTTAG-3′[21]和DL-F: 5′-CCCACCACTAACTCCCAAAGC-3′; DL-R: 5′-CTGGAAAGAACGCCCGGCATG-3′[22]对40个样品进行扩增, 反应体系25 μL, 包括: 0.2 mmol/L每种dNTPs, 0.2 μmol/L每种引物, 1 μL DNA模板, 1U Taq, 2.0 mmol/L MgCl2, 2.5 μL 10×缓冲液, 灭菌超纯水补足剩余体系。PCR扩增在Bio-Rad C1000型PCR仪上进行, 反应程序: 95℃预变性3min后, 95℃变性30s, 55—60℃退火35s, 72℃延伸50s, 运行35个循环, 最后72℃下延伸5min。扩增后进行双向测序[生工生物工程(上海)股份有限公司]。
1.3 数据分析
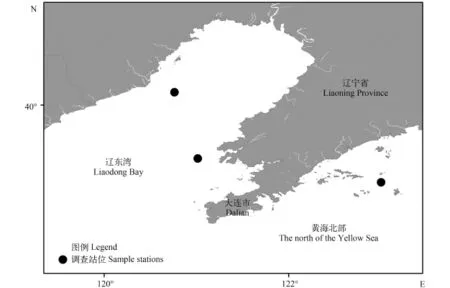
测序所得线粒体COⅠ基因和CR序列片段利用Bioedit软件[23]进行拼接并辅以人工校对, 通过BLAST (http://www.ncbi.nlm.gov/BLAST/)检索确定为目的片段。应用CLUSTAL X 1.83软件对序列进行比对分析。根据样品的地理来源, 将渤海辽东湾海域采集的22个样品作为辽东湾群体(LD), 黄海北部附近海域采集的18个样品归为黄海北部群体(HB)。DnaSP v5软件确定单倍型, Mega5.0软件[24]统计碱基含量、变异位点, 采用Kimura双参数模型计算单倍型间遗传距离。Arlequin3.5[25]软件计算单倍型数、多态位点数、单倍型多态度 (H)、核苷酸多态度(π)等分子多样性指数以及两两群体之间的Fst统计值, 其显著性通过参数重抽样法进行检验。使用Arlequin3.5软件中的分子变异分析(AMOVA)来评估群体间遗传变异, 其显著性通过1000次重抽样来检验, 群体间的遗传距离采用Kimura 2 parameter模型计算。此外, 为探讨弯棘斜棘单倍型的谱系结构, 采用中介网络法[26]构建单倍型网络关系图。

图 1 研究区域弯棘斜棘䲗样品取样图Fig. 1 The sampling sites of Repomucenus curvicornis
2 结果
2.1 遗传多样性
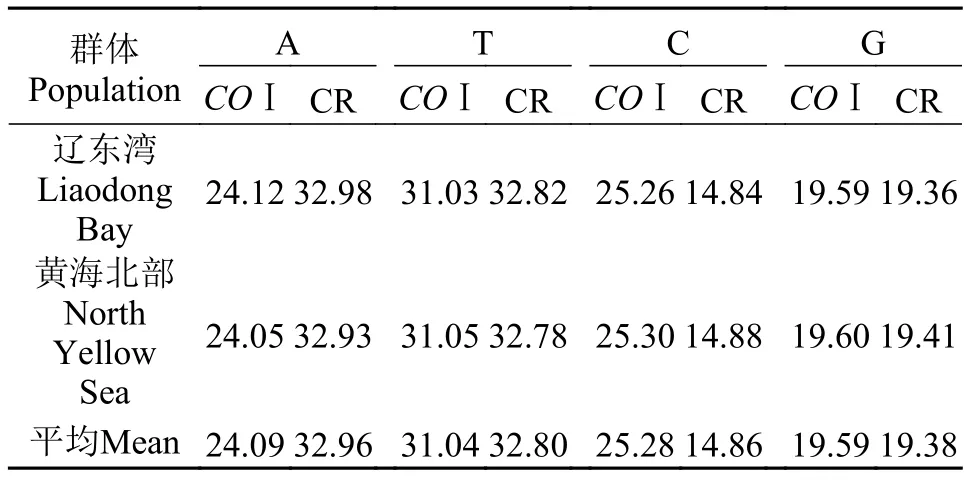
PCR扩增共得到39条COⅠ基因同源序列, 经比对后得到624 bp序列用于分析, 定义了28种单倍型(Hap1—28)。在28个单倍型中, Hap8、Hap12、Hap 20为两群体共享单倍型, 其中Hap12、Hap 20为主体单倍型, 其所占频率分别为12.8%和17.9%,剩余25个单倍型(89%)为群体特有单倍型且只在一个个体中检测到 (表 1)。在研究的COⅠ序列中, A、T、C、G碱基的平均含量分别为24.09%、31.04%、25.28%和19.59%, A+T (55.13%)含量高于G+C (44.87%)含量(表 2)。共检测到38个多态位点,包括16个简约信息位点和22个单态核苷酸变异位点, 其中3个突变发生在第一密码子, 其余都发生在第三密码子, 仅1个突变位点导致编码氨基酸的改变(M-V)。种内个体间COⅠ序列遗传距离为0—2.1%, 平均遗传距离0.8%。
表 1 弯棘斜棘不同单倍型COⅠ序列的变异位点分布Tab. 1 Variable sites of COⅠfragments of different haplotypes of Repomucenus curvicornis
单倍型Haplotype 00000001111112223333333333444445555556 群体Population 11345670036882690022344459246790135770 29027925892092770617628970615421675060 LD HB Hap1 CACGGCTGCTCCTAAATACTTGTCAATAGACCCCTTAG 1 Hap2 .G.................................... 1 Hap3 .G......................T .....T....C.. 1 Hap4 .G ......T..TC ........AC .....A ..TGA .... 1 Hap5 .G..A ..A...TCG ..............A ..TGA .... 1 Hap6 .G.A .......TC......C........A ..T.A .... 1 Hap7 .G .A ........................A ..TGA .... 1 Hap8 .G....C .....................A ..TGA .... 1 1 Hap9 .G....CA....................A ..TGA .... 1 Hap10 TG ........................C .A ..TGA .... 1 Hap11 TG ....C .........C .A .........A ..TGA .... 1 Hap12 .G .........................GA ..TGA .C .. 4 1 Hap13 .G.........................GAG.TGA .C .. 1 Hap14 .G ......T ..................GA ..TGA .C .. 1 Hap15 TG .........................GA ..TGA .C .. 1 Hap16 TG .............G ............A ..TGA .C .. 1 Hap17 .G..........................A ..TGA .C .. 1 Hap18 .G ..........................A ..TGAG ... 1 Hap19 .G..........................A ..TGAA... 1 Hap20 .G ..........................A ..TGA .... 5 2 Hap21 .G ..........................A ..TGA ..G . 1 Hap22 .G...........G ........T........TG ..... 1 Hap23 .G.......C..........C ....T.....TG ..... 1 Hap24 .G ...............G ...A .........T ...... 1 Hap25 T ............G .......A .........T ...... 1 Hap26 ........T......................T ...... 1 Hap27 ...............................T .....A 1 Hap28 .T ...G....T...G ................T ....G . 1合计Total 2217
表 2 弯棘斜棘线粒体COⅠ与CR片段的序列组成Tab. 2 Nucleotide compositions of COⅠmitochondrial fragment and CR gene in Repomucenus curvicornis (%)

表 2 弯棘斜棘线粒体COⅠ与CR片段的序列组成Tab. 2 Nucleotide compositions of COⅠmitochondrial fragment and CR gene in Repomucenus curvicornis (%)
群体Population A T C G COⅠ CR COⅠCR COⅠCR COⅠCR辽东湾Liaodong Bay 24.1232.9831.0332.82 25.2614.8419.5919.36黄海北部North Yellow Sea 24.0532.93 31.0532.78 25.3014.88 19.6019.41平均Mean24.0932.9631.0432.8025.2814.8619.5919.38
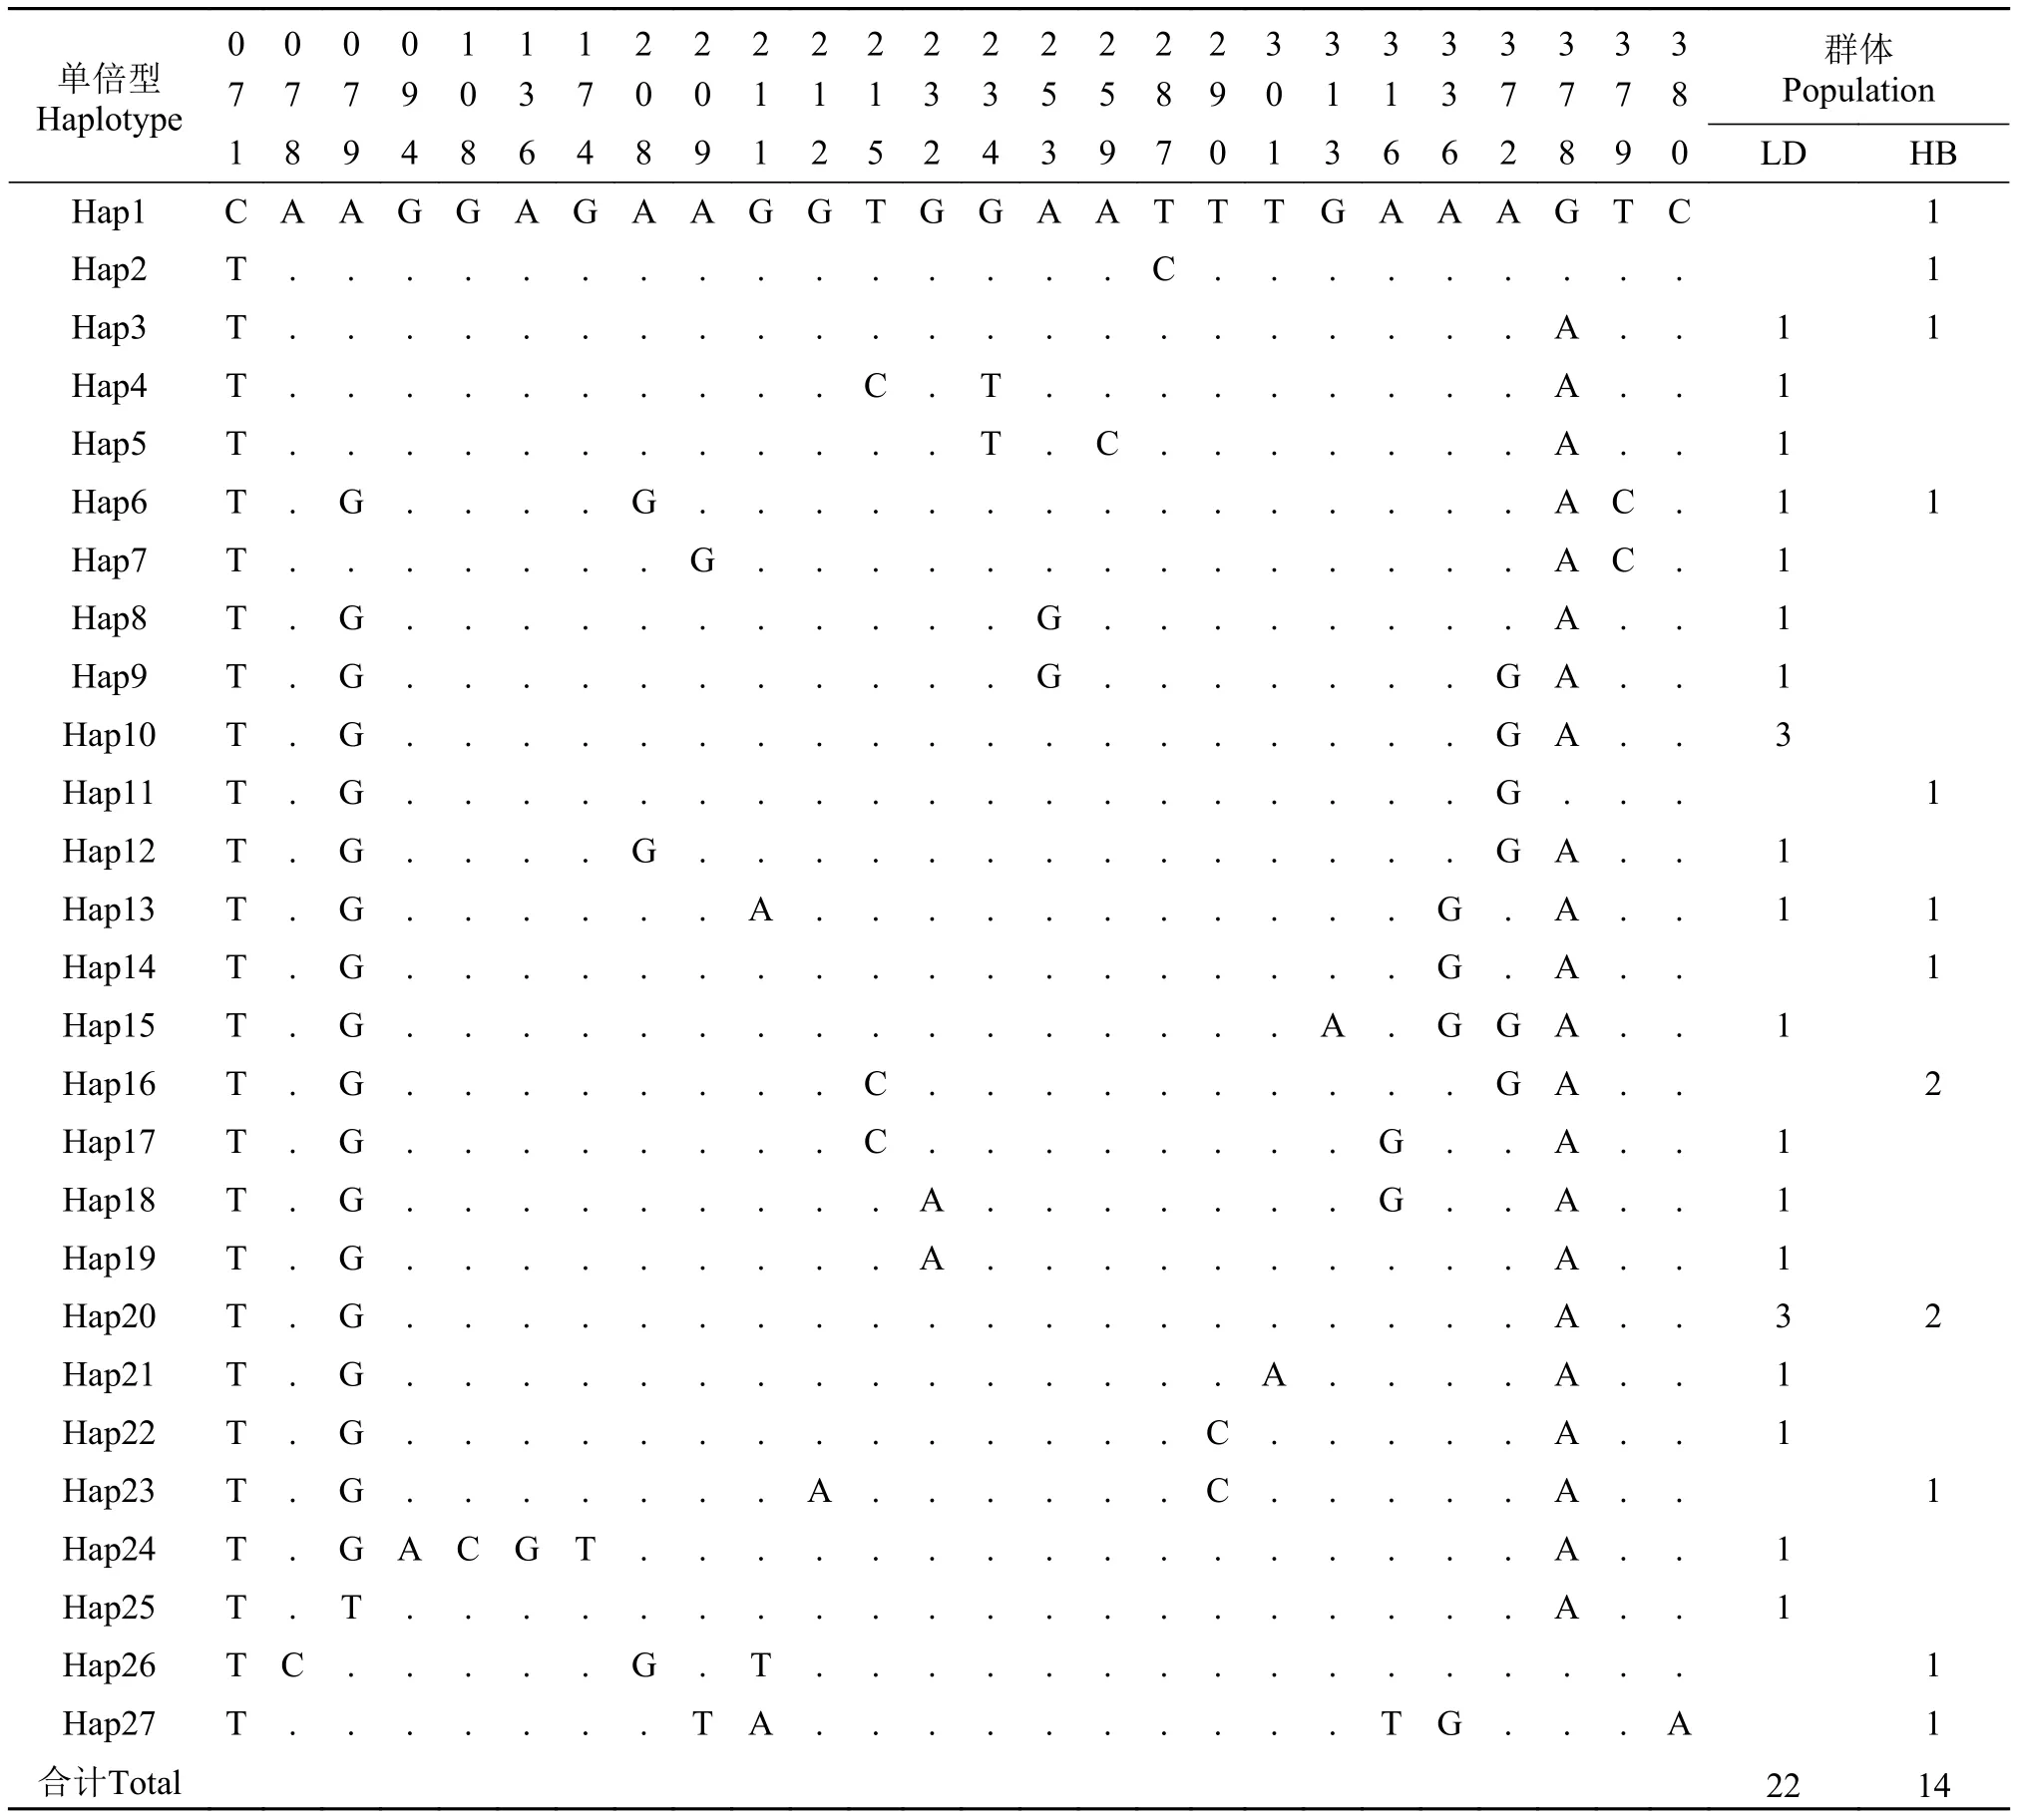
经测序得到36条CR同源序列, 比对后得到460 bp序列用于分析, 定义了27种单倍型(Hap1—27)。在27个单倍型中, Hap3、Hap6、Hap13、Hap 20为两群体共享单倍型, 其中Hap20为主体单倍型,其所占频率为14%, 21个单倍型(81%)为群体特有单倍型且只在一个个体中检测到, 余下的2个单倍型不止在一个个体中被发现, 且这些个体仅分布于一个群体中(表 4)。在所分析CR序列中, A、T、C、G的平均含量分别为32.96%、32.80%、14.86%和19.38%, A+T (65.76%)含量明显高于G+C (34.24%)含量(表 2), 符合海水鱼类线粒体控制区序列特征。共发现多态位点26个, 包括13个简约信息位点和13个单态核苷酸变异位点。种内个体间CR序列遗传距离为0—2.4%, 平均遗传距离0.7%。
2.2 群体遗传分化
而基于线粒体CR序列计算的分子方差分析(AMOVA)的结果则显示, 97.36%的差异属于群体内变异, 群体间差异为2.64%, Fst值为0.0264但差异接近显著(P=0.09), 表明本研究中辽宁沿海两个弯棘斜棘群体可能存在较小的遗传分化(表 6)。
3 讨论
表 3 基于线粒体COⅠ基因和CR序列的弯棘斜棘遗传多样性参数Tab. 3 The genetic diversity of Repomucenus curvicornis based on COⅠ and CR sequence

表 3 基于线粒体COⅠ基因和CR序列的弯棘斜棘遗传多样性参数Tab. 3 The genetic diversity of Repomucenus curvicornis based on COⅠ and CR sequence
群体Sample单倍型数No. of haplotypes样本数n 变异位点Variable sites平均核苷酸差异数k单倍型多样性h核苷酸多样性π COⅠ CR COⅠ CR COⅠ CR COⅠ CR COⅠ CR COⅠ CR辽东湾Liaodong Bay 22 22 22 20 15 18 4.06 2.95 0.93±0.040.97±0.02 0.0065±0.00380.0064±0.0039黄海北部North Yellow Sea 17 14 29 16 16 12 5.50 3.95 0.99±0.020.98±0.03 0.0088±0.00500.0086±0.0051合计Total 39 36 38 26 28 27 4.67 3.35 0.96±0.020.97±0.02 0.0075±0.00420.0073±0.0043
表 4 弯棘斜棘不同单倍型控制区序列的变异位点分布Tab. 4 Variable sites of CR fragment of different haplotypes of Repomucenus curvicornis

表 4 弯棘斜棘不同单倍型控制区序列的变异位点分布Tab. 4 Variable sites of CR fragment of different haplotypes of Repomucenus curvicornis
单倍型Haplotype 00001112222222222233333333 群体Population 77790370011133558901137778 18948648912524397013662890 LD HB Hap1 CAAGGAGAAGGTGGAATTTGAAAGTC 1 Hap2 T...............C......... 1 Hap3 T......................A.. 1 1 Hap4 T ..........C .T .........A .. 1 Hap5 T ............T .C .......A .. 1 Hap6 T.G....G ...............AC. 1 1 Hap7 T .......G ..............AC . 1 Hap8 T .G ...........G ........A .. 1 Hap9 T .G ...........G .......GA .. 1 Hap10 T .G ...................GA .. 3 Hap11 T.G...................G... 1 Hap12 T .G ....G ..............GA .. 1 Hap13 T.G ......A ...........G .A.. 1 1 Hap14 T.G..................G .A.. 1 Hap15 T .G ................A .GGA .. 1 Hap16 T.G........C..........GA.. 2 Hap17 T .G ........C ........G ..A .. 1 Hap18 T .G .........A .......G ..A .. 1 Hap19 T .G .........A ..........A .. 1 Hap20 T.G ....................A.. 3 2 Hap21 T .G ...............A ....A .. 1 Hap22 T .G ..............C .....A .. 1 Hap23 T.G.......A......C.....A.. 1 Hap24 T .GACGT ................A .. 1 Hap25 T .T ....................A .. 1 Hap26 TC.....G.T................ 1 Hap27 T.......TA..........TG ...A 1合计Total 2214
表 5 基于COⅠ序列的辽宁沿海两个弯棘斜棘群体的AMOVA分析Tab. 5 COⅠsequence-based analysis of molecular variation for populations of Repomucenus curvicornis

表 5 基于COⅠ序列的辽宁沿海两个弯棘斜棘群体的AMOVA分析Tab. 5 COⅠsequence-based analysis of molecular variation for populations of Repomucenus curvicornis
变异来源Source of variation自由度df方差总和Sum of squares变异组分Variance components变异贡献率Percentage of variation FstP群体间Among population 1 2.756 0.02155 0.91 0.0091 0.25群体内Within population 37 86.665 2.34230 99.09总数Total 38 89.421 2.36385 100.00
表 6 基于CR序列的辽宁沿海两个弯棘斜棘群体的AMOVA分析Tab. 6 CR sequence-based analysis of molecular variation for populations of Repomucenus curvicornis

表 6 基于CR序列的辽宁沿海两个弯棘斜棘群体的AMOVA分析Tab. 6 CR sequence-based analysis of molecular variation for populations of Repomucenus curvicornis
变异来源Source of variation自由度df方差总和Sum of squares变异组分variance components变异贡献率Percentage of variation FstP群体间Among population 1 2.439 0.04518 2.64 0.0264 0.09群体内Within population 34 56.645 1.66603 97.36总数Total 35 59.084 1.71121 100.00
海洋鱼类在整个生活史中会受到多种因素的影响, 一般而言, 底栖生活海洋鱼类由于移动能力较差阻碍了不同地理群体间的基因交流易于产生遗传分化; 而开放的海洋环境中产浮性卵鱼类由于其生活史早期易受海域内洋流的作用而具有较强的扩散潜力导致遗传分化不明显。本研究基于两个分子标记计算的分子方差分析(AMOVA)的结果并不一致, 基于COⅠ基因序列的结果显示弯棘斜棘辽东湾群体和黄海北部群体几乎无遗传分化(Fst=0.0091, P=0.25); 而基于CR序列的结果则表明两者间存在较小但接近显著的遗传分化(Fst=0.0264, P=0.09), 提示弯棘斜棘不同群体间可能存在复杂的遗传结构。弯棘斜棘复杂遗传结构的形成可能与晚更新世末-全新世初黄渤海海域发生的多次大范围的海侵和洋面的回升以及弯棘斜棘自身的生态习性有关。弯棘斜棘为暖水性底栖小型鱼类, 其游泳能力较差, 但产浮性卵, 在其整个生活史阶段可以营短暂的浮游生活。由于多次大范围的海侵, 在不同海域进化的弯棘斜棘群体可能在黄海发生过重新混合的现象, 后来随着海侵过程或者沿岸流一部分个体由黄海迁入渤海, 但由于分化的时间较短两个群体间尚未形成明显的遗传分化。由于受采样范围及数量限制, 有关中国近海弯棘斜棘不同地理种群间遗传结构及遗传多样性的研究仍有待继续深入。
3.3 两种分子标记在海水鱼类群体遗传研究中的适用性
鱼类线粒体控制区序列受选择压力较小、进化速率快, 而COⅠ基因作为线粒体编码基因, 其进化速度相对较慢。不同硬骨鱼类的线粒体CR序列进化速率并不一致, 在大多物种中, 其进化速率快于蛋白编码基因, 而在另一些种类中两者的进化速率差异不大[19,20]。在本研究中, 弯棘斜棘线粒体控制区序列的遗传变异水平与COⅠ基因相当(表 3),这种现象在银鲳[10]、澳洲彩虹鱼[11]以及东非洲慈鲷属(Haplochromis)[12]等鱼类中都曾被发现。而在一些无脊椎动物如荨麻蛱蝶(Aglais urticae), 其CR序列的遗传变异甚至要低于COⅠ基因[36]。
[1]Liu R Y. Checklist of Marine Biota of China Seas [M]. Beijing: Science Press. 2008, 887—1066 [刘瑞玉. 海洋生物名录. 北京: 科学出版社. 2008, 887—1066]
[2]Liu J, Cheng Y X, Ma L. Fishes of the Bohai Sea and Yellow Sea [M]. Beijing: Science Press. 2015, 219—224 [刘静, 陈咏霞, 马琳. 黄渤海鱼类图志. 北京: 科学出版社. 2015, 219—224]
[3]Liu C X, Qin K J, Ding G W, et al. Fauna in Liaoning Province (Fish) [M]. Shenyang: Liaoning Science and Technology Press. 1987, 1—229 [刘蝉馨, 秦克静, 丁耕芜, 等. 辽宁省动物志•鱼类. 沈阳: 辽宁科学技术出版社. 1987, 1—229]
[4]Jin X S, Tang Q. Changes in fish species diversity and dominant species composition in the Yellow Sea [J]. Fisheries Research, 1996, 26(3—4): 337—352
[5]Liu X Z, Dong J, Yu X G, et al. Fishery resources structure in coastal waters of Liaoning Province [J]. Marine Fisheries, 2014, 36(4): 289—299 [刘修泽, 董婧, 于旭光,等. 辽宁省近岸海域的渔业资源结构. 海洋渔业, 2014, 36(4): 289—299]
[6]Song H Y, Satoh T P, Mabuchi K. Complete mitochondrial genome sequence of the dragonet Callionymus curvicornis (Perciformes: Callionymoidei: Callionymidae) [J]. Mitochondrial DNA, 2012, 23(4): 290—292
[7]Awata S, Kimura M R, Sato N, et al. Breeding season, spawning time, and description of spawning behaviour in the Japanese ornate dragonet, Callionymus ornatipinnis: a preliminary field study at the northern limit of its range [J]. Ichthyological Research, 2010, 57(1): 16—23
[8]Zhao J. Information system of the common fish eggs in Bohai and Yellow sea and the preliminarily biological and ecological study of fish eggs and larvae [D]. Thesis for Master of Science. Ocean University of China, Qingdao. 2011 [赵静. 黄渤海常见种鱼卵归纳检索系统设计与鱼卵、仔稚鱼生物生态学初步研究. 硕士学位论文,中国海洋大学, 青岛. 2011]
[9]Gonzales J B, Seki S, Taniguchi N. Genetic relationships among thirteen species of dragonets (Gobiesociformes: Callionymidae) inferred from allozyme markers [J]. Bulletin of Marine Sciences & Fisheries Kochi University, 1997, 17: 97—107
[10]Peng S M, Shi Z H, Hou J L. Comparative analysis on the genetic diversity of cultured and wild silver pomfret populations based on mtD-loop and COⅠgene [J]. Journal of Fisheries of China, 2010, 34(1): 19—25 [彭士明, 施兆鸿, 侯俊利. 基于线粒体D-loop区与COⅠ基因序列比较分析养殖与野生银鲳群体遗传多样性. 水产学报, 2010, 34(1): 19—25]
[11]Zhu D, Jamieson B G M, Hugall A, et al. Sequence evolution and phylogenetic signal in control-region and cytochrome b sequences of rainbow fishes (Melanotaeniidae) [J]. Molecular Biology and Evolution, 1994, 11(4): 672—683
[12]Sato A, Takezaki N, Tichy H, et al. Origin and speciation of Haplochromine fishes in East African crater lakes investigated by the analysis of their mtDNA, Mhc genes, and SINEs [J]. Molecular Biology and Evolution, 2003, 20(9): 1448—1462
[13]Zhao L L, Bi X X, Song L, et al. Analysis of the structure of mitochondrial DNA control region and the genetic diversity of Trachidermus fasciatus in different populations [J]. Acta Hydrobiologica Sinica, 2016, 40(1): 34—41 [赵林林, 毕潇潇, 宋林, 等. 松江鲈线粒体DNA控制区结构和遗传多样性分析. 水生生物学报, 2016, 40(1): 34—41]
[14]Zhao M, Song W, Ma C Y, et al. Population genetic structure of Collichthys lucidus based on the mitochondrial cytochrome oxidase subunit I sequence [J]. Journal of Fishery Sciences of China, 2015, 22(2): 233—242 [赵明,宋伟, 马春艳, 等. 基于线粒体COⅠ基因序列的棘头梅童鱼7个野生群体遗传结构分析. 中国水产科学, 2015, 22(2): 233—242]
[15]Yang F, He L J, Lei G C, et al. Genetic diversity and DNA barcoding of mudskipper common species along Southeast Coasts of China [J]. Chinese Journal of Ecology, 2012, 31(3): 676—683 [杨帆, 何立军, 雷光春, 等.中国东南沿海弹涂鱼科常见鱼类的遗传多样性和DNA条形码. 生态学杂志, 2012, 31(3): 676—683]
[16]Zhou X D, Yang J Q, Tang W Q, et al. Species validities analyses of Chinese Coilia fishes based on mtDNA COⅠbarcoding [J]. Acta Zootaxonomica Sinica, 2010, 35(4): 819—826 [周晓犊, 杨金权, 唐文乔, 等. 基于线粒体COⅠ基因DNA条形码的中国鲚属物种有效性分析.动物分类学报, 2010, 35(4): 819—826]
[17]Wu R X, Liu S F, Zhuang Z M, et al. Population genetic structure of Larimichthys polyactis in the Yellow and East China Seas based on Cyt b sequences [J]. Progress in Natural Science, 2009, 19(9): 924—930
[18]Han Z Q, Gao T X, Yanagimoto T, et al. Genetic population structure of Nibea albiflora in the Yellow and East China seas [J]. Fisheries Science, 2008, 74(3): 544—552
[19]Liu J X, Gao T X, Wu S F, et al. Pleistocene isolation in the marginal ocean basins and limited dispersal in a marine fish, Liza haematocheila (Temminck & Schlegel, 1845) [J]. Molecular Ecology, 2007, 16(2): 275—288
[20]Liu J X, Gao T X, Zhuang Z M, et al. Late Pleistocene divergence and subsequent population expansion of two closely related fish species, Japanese anchovy (Engraulis japonicus) and Australian anchovy (Engraulis australis) [J]. Molecular Phylogenetics and Evolution, 2006, 40(3): 712—723
[21]Peng S M, Shi Z H, Hou J L, et al. Genetic diversity of three wild silver pomfret (Pampus argenteus) populations based on COⅠ gene sequences [J]. Journal of Shanghai Ocean University, 2009, 18(4): 398—402 [彭士明, 施兆鸿, 侯俊利, 等. 银鲳3个野生群体线粒体COⅠ基因的序列差异分析. 上海海洋大学学报, 2009, 18(4): 398—402]
[22]Kocher T D, Thomas W K, Meyer A, et al. Dynamics of mitochondrial DNA evolution in animals: amplification and sequencing with conserved primers [J]. Proceedings of the National Academy of Sciences of the United States of America, 1989, 86(16): 6196—6200
[23]Kelly M E. Analysis of deoxyribonucleotide acid (DNA) sequence data using BioEdit [J]. Forensic DNA Biology, 2013, 129—132
[24]Tamumra K, Peterson D, Peterson N, et al. MEGA5:molecular evolutionary genetics analysis using maximum likelihood, evolutionary distance, and maximum parsimony methods [J]. Molecular Biology and Evolution, 2011, 28(10): 2731—2739
[25]Excoffier L, Lischer H E L. Arlequin suite ver 3.5: a new series of programs to perform population genetics analyses under Linux and Windows [J]. Molecular Ecology Resources, 2010, 10(3): 564—567
[26]Bandelt H, Forster P, Rohl A. Median joining networks for inferring intraspecific phylogenics [J]. Molecular Biology Evolution, 1999, 16(1): 37—48
[27]Li Y L, Liu X Z, Dong J, et al. Genetic diversity analysis of silver pomfret (Pampus echinaster) inhabiting Liaodong Bay based on COⅠ gene sequence [J]. Transactions of Oceanology and Limnology, 2015, 2015(2): 29—35 [李玉龙, 刘修泽, 董婧, 等. 基于线粒体COⅠ基因序列分析辽东湾镰鲳(Pampus echinogaster)群体遗传多样性. 海洋湖沼通报, 2015, 2015(2): 29—35]
[28]Li Y L, Liu X Z, Li Y P, et al. Genetic diversity analysis of snailfish Liparis tanakae in the Liaoning coast based on COⅠ gene sequences [J]. Fisheries Science, 2016, 38(2):120—129. [李玉龙, 刘修泽, 李轶平, 等. 基于mtDNA COⅠ基因序列的辽宁沿海细纹狮子鱼群体遗传多样性分析. 海洋渔业, 2016, 38(2):120—129]
[29]Li L. Study on population genetic structure of Callionymus beniteguri and phylogenetic development of three Callionymus species [D]. Thesis for Master of Science. Ocean University of China, Qingdao. 2014 [李龙.绯[鱼衔]种群遗传结构及三种[鱼衔]属鱼类系统发育关系研究. 硕士学位论文, 中国海洋大学, 青岛. 2014]
[30]Grant W S, Bowen B W. Shallow population histories in deep evolutionary lineages of marine fishes: insights from sardines and anchovies and lessons for conservation [J]. Journal of Heredity, 1998, 89: 415—426
[31]Liu H L, Zhang Q, Tang Y L, et al. Structure and genetic diversity of mtDNA D-Loop sequences among Trachidermus fasciatus stocks in Yellow Sea and Bohai Sea of China [J]. Marine Science Bulletin, 2010, 29(3): 283—288. [刘海林, 章群, 唐优良, 等. 黄渤海松江鲈鱼线粒体控制区结构与序列多态性分析. 海洋通报, 2010, 29(3): 283—288]
[32]Gao T X, Bi X X, Zhao L L, et al. Population genetic structure of roughskin sculpin trachidermus fasciatus based on the mitochondrial Cytb sequence [J]. Acta Hydrobiologica Sinica, 2013, 37(2): 199—207 [高天翔, 毕潇潇, 赵林林, 等. 基于线粒体Cytb基因全序列的松江鲈群体遗传结构分析. 水生生物学报, 2013, 37(2): 199—207]
[33]Cai S S, Xu S Y, Song N, et al. Mitochondrial dna control region structure and length polymorphism analysis of Setipinna tenuifilis [J]. Acta Hydrobiologica Sinica, 2014, 38(5): 980—986 [蔡珊珊, 徐胜勇, 宋娜, 等. 黄鲫线粒体DNA控制区结构及长度多态性分析. 水生生物学报, 2014, 38(5): 980—986]
[34]Nei M. Molecular Evolutionary Genetics [M]. New York: Columbia University Press. 1987
[35]Kong X Y, Li Y L, Shi W, et al. Genetic variation and evolutionary demography of Fenneropenaeus chinensis populations, as revealed by the analysis of mitochondrial control region sequences [J]. Genetics and Molecular Biology, 2010, 33(2): 379—389
[36]Vandewoestijne S, Baguette M, Brakefield P M, et al. Phylogeography of Aglais urticae (Lepidoptera) based on DNA sequences of the mitochondrial COⅠgene and control region [J]. Molecular Phylogenetics and Evolution, 2004, 31(2): 630—646
POPULATION GENETIC STRUCTURE AND DIVERSITY ANALYSIS OF REPOMUCENUS CURVICORNIS IN THE LIAONING COAST BASED ON DNA SEQUENCES OF THE MITOCHONDRIAL COⅠ GENE AND CONTROL REGION
LI Yu-Long, LIU Xiu-Ze, YU Xu-Guang, LI Yi-Ping, FU Jie and DONG Jing
(Liaoning Key Laboratory of Marine Biological Resources and Ecology, Liaoning Ocean and Fishery Science Research Institute, Dalian 116023, China)
To analyze the genetic diversity and genetic structure of Repomucenus curvicornis from the Liaodong Bay (n=22) and the North Yellow Sea (n=18), the mitochondrial DNA cytochrome oxidase I (COⅠ) gene and control region fragments were obtained by PCR amplification. The average contents of A, T, C and G of 624 bp COⅠgene fragments were 24.09%, 31.04%, 25.28%, and 19.59%, respectively. The average contents of A, T, C and G of CR fragments (460 bp) were 32.96%, 32.80%, 14.86% and 19.38%, respectively. The total variable sites, mean pairwise nucleotide differences (k), haplotype diversity (H) and nucleotide diversity (π) based on COⅠgene fragments were 38, 4.67, 0.96±0.02 and 0.0075±0.0042, respectively. The same parameters based on CR fragments were 26, 3.35, 0.97±0.02 and 0.0073±0.0043, respectively. Based on mitochondrial COⅠgene and control region, the genetic diversity of Liaodong Bay population was lower than that of North Yellow Sea population. The AMOVA analysis based on CR fragments revealed almost significant genetic divergence between the Liaodong Bay and North Yellow Sea populations, while there was no significant genetic divergence based on COⅠgene. The results showed that CR and COⅠgene were effective molecular markers for detecting the genetic diversity of Repomucenus curvicornis population, while CR was more reliable than COⅠgene in detecting the genetic structure. In conclusion, CR is a appropriate marker for marine fish population genetic analysis.
Repomucenus curvicornis; mtDNA; COⅠgene; Control region; Genetic diversity; Genetic differentiation
Q346+.5
A
1000-3207(2017)03-0581-08
10.7541/2017.75
2016-06-06;
2016-09-10
海洋公益性行业科研专项(201405010); 辽宁省海洋与渔业科研项目(201401)资助 [Supported by the Public Science and Technology Research Funds Project of Ocean (201405010); the Research Project of Marine and Fishery of Liaoning Province (201401)]
李玉龙(1981—), 男, 山东临沂人; 副研究员; 主要从事渔业资源增殖放流及海洋生物分子生物学研究。E-mail: liyudragon@ 126.com
董婧(1966—), 女, 辽宁沈阳人; 研究员; 主要从事渔业资源调查及大型水母生物学研究。E-mail: 1024470248@qq.com
