A User Participation Behavior Prediction Model of Social Hotspots Based on Influence and Markov Random Field
2017-05-09
Chongqing Engineering Laboratory of Network and Information Security, Chongqing University of Posts and Telecommunications,Chongqing 400065, China
I. INTRODUCTION
Due to its freedom and openness, online social network has become the main platform for information dissemination. Studying the trend of hotspot development on these networks can deepen our understanding of network structure and properties. The result has been applied to many fields, such as marketing, information recommendation, and social media monitoring. These applications can improve management efficiency and transparency for social benefits, as well as optimize the allocation of resources and promotion of products for economic benefit.
Current research on user participation in hotspots mainly focuses on hotspot propagation and group behavior. Analysis of topic propagation aims to study social network information dissemination, which could provide further understanding of network structure and properties from an information dissemination perspective [1][2]. Propagation models based on network structure focus mainly on information dissemination structure and interactions between neighboring nodes [3][4].To infer the probability of retweeting, Guille et al. [5] proposed the T-BaSIC model, which uses bayesian logistic regression involving measures on topic semantics, network structure and timeliness. Group state propagation models are mostly modeled after the epidemic model, which first divides nodes into different states, and then models the information dis-semination process as a change from one state to another [6][7]. A dynamic equation model,based on susceptible-infected-recovered (SIR)model, is proposed in Twitter [8] to illustrate the propagation trend of hot topics. However,because of the rapid development of social networks, existing studies are challenged by the dynamics of information dissemination and complexity of propagation paths.
In this paper, based on user behavior and relationship data, a hotspot user participation behavior prediction model was proposed.
Group behavior analysis often focuses on the following three aspects. 1) Social influence: Rogers [9] defined “influential individuals” as those who can change the ideas of others in some way. Researchers analyzed the conditions and related factors of influence in social activities [10][11]. Yang et al. [12]presented a linear influence model based on a large amount of empirical research on social network user behaviors. The model assumes that the information diffusion process is controlled by the influence of specific nodes, and predicts hotspot propagation trends by evaluating the influence of individuals. Tang et al.[13] proposed the conformity influence model using historical behavior. This model shows how conformity influence plays an important role in changing user behavior. In addition, it can predict both user participation behavior and the development of hotspot topic trend. 2)Social network structure: this mainly focuses on users’ out/in-degree and triadic theory to predict the spread of hotspots topic and user behavior [14][15]. Dong et al. [16] proposed a similar approach based on using graphical models to predict the age and gender of users.This approach was performed with 1 billion phone SMS data and seven million user profiles. Xu et al. [17] analyzed user travel behavior patterns using a bipartite graph model. 3)Information dissemination and evolution: this analyzes the pattern of social network information dissemination [18][19][20] and could provide further improvements in personalized recommendation and the understanding of dynamic behavior. The relationship between edge structure and information dissemination has been researched [21][22] by studying the properties of edges in potential networks. The results produced information transmission path in news, blogs, and other entertainment media.
However, previous research mainly focuses only on a single aspect, when additional factors such as dynamic network topology characteristics, user influence, external factors, and others [23][24] need to be considered. In this paper, a prediction method of user participation in hotspots is proposed. First, because of the cascading of topics by network structure,fans of participating users are regarded as target objects. Second, we extract three attributes related to social influence: individual, peer,and community influence. In addition, the timeliness factor is also considered. Third, we consider the Markov property of the information diffusion process, i.e., an individual behavior is influenced by itself and its neighboring nodes. Therefore, for a factor graph [25],a user participation behavior prediction model is constructed based on the method of Markov random field theory.
The contributions of this paper can be summarized as follows:
● Using relation network for a hotspot topic, we determine the causes of user behavior.To address the problem of the influence expression of participating in hotspot topic, three influence factor functions are defined: individual, peer, and community influence. These functions take timeliness into account with a time discretization method.
● Because of the Markov property of information diffusion process, i.e., an individual behavior is mainly influenced by itself and its neighboring nodes, a user participation behavior prediction model is proposed based on the method of Markov random field theory. The model can be used to predict individual behavior.
● The model proposed in this paper can not only predict individual user behavior according to the relation network of a hotspot topic,it can also forecast group behavior and the development trends of this topic. It can provide a basis for the management and control of public opinion and discovery of network influ-ences.
The rest of the paper is organized as follows. Section 2 formulates the problem.Section 3 explains the proposed model and corresponding learning algorithm. Section 4 presents the experimental data and analyzes the experimental results. Finally, section 5 concludes this work.
II. PROBLEM FORMULATION
2.1 Related definition
The problem to be solved in this paper as follows: dynamically predict the participation behavior of a specific user and the development trends of a topic in future through a systematic analysis of the current participants and their fans, as shown in Figure 1. First, a few basic concepts and related definitions are presented.Definition 1:Network of participant users

Definition 2:Network of candidate

Definition 3:Network of a topic

To formally describe the scientific problems in this paper, we assume thatis the network of a hotspot at timetandis the past behavior of all users. We also identify candidates and candidate networkfrom networkFinally, we forecastwheredenotes whether candidatewill participate in the hotspot topic in the next timeThe problem is clearly defined as:

2.2 Input
Based on the above definitions, the inputs are:

Fig. 1 Problem overview
1. Network of topic:

2. Historical behavior of all users:

2.3 Influence extraction
User participation is mainly influenced by three aspects: individual, peer, and community. Therefore, three aspects of the influence factor are illustrated in Figure 2:
(1) Individual influence
Considering that candidates’ behaviors are related to their activity and interest on the topic, we define individual influence, as shown in Table 1.


whereujis a participant user followed byviandAttributes aboutujare involved here because instead of participant users, the candidate network only contains candidate users. Moreover,represents the topic driving force of participant useruj. A precise definition is as follows:

For convenience, four kinds of attributes are described in the unified form xikto represent thek-thindividual attribute the vicandidate.
(2) Peer influence
A candidate user is more likely to participate in a topic when his/her participant follower is an opinion leader or certificated user.Considering that user participation behavior is influenced by friends, the attribute definitions of peer influence among users are shown in Table 2.
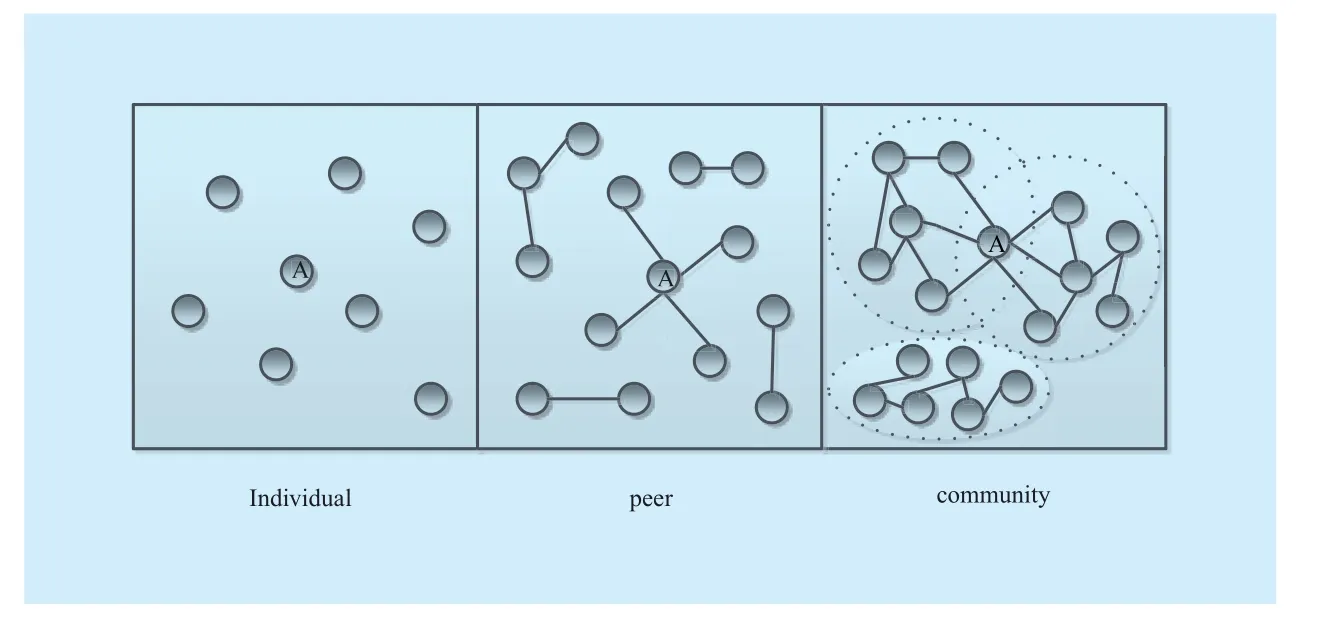
Fig. 2 Expression form of users participating in topic
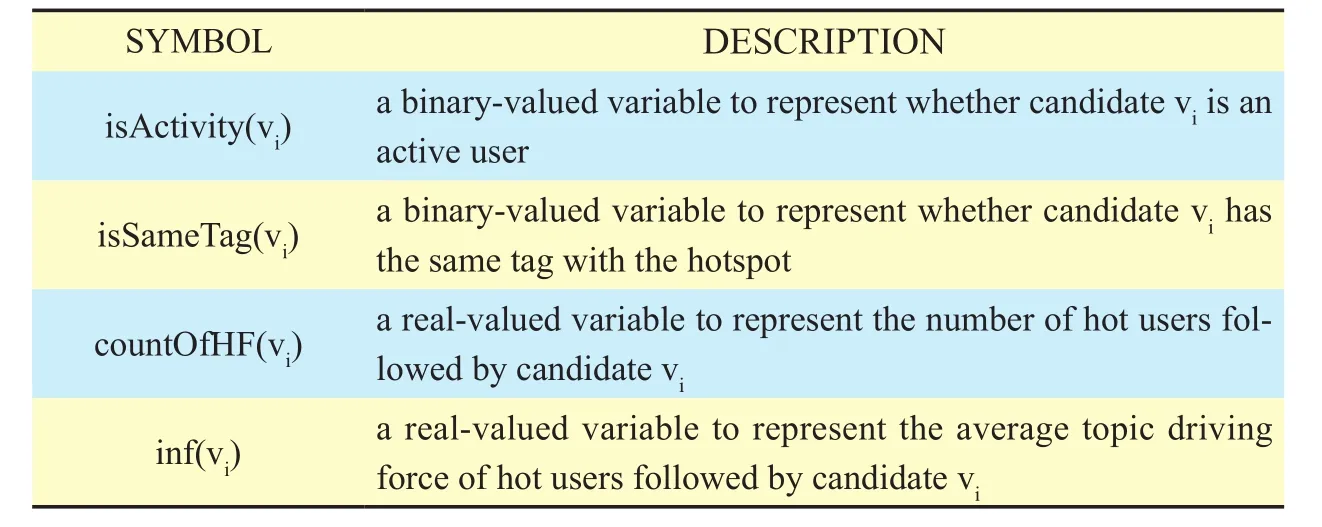
Table I Description and notations for individual influence
In Table 2, vjis a candidate user followed by candidate user vi, andIn addition,represents whether vjis an opinion leader, i.e,

(3) Community influence
The behavior of a candidate user is influenced by his/her community. For example,a candidate user is more likely to participate in a topic if there are many of his/her friends already involved with it. Based on this, we define community attributes in Table 3.
Where, a τ-community is a community with a percentage of participating, users that is above a threshold value. In this paper,represents whether the community of viis aτ-community. This is defined as follows:


Table II Description and notations for peer influence

Table III Description and notations for community influence
These attributes are based on experimental data in this paper. They can be revised appropriately by real data. Moreover, for ease of description,, andare used to represent the set of individual, peer, and community attributes.
2.4 Formulation
Problem:Given a network of topicand the historical behavior of all usersour goal is to solve the following problems:


III. MODEL
3.1 Framework
To solve the above problems, interaction data and relationship data are sliced to discretize the entry life cycle. Then, for the influence expression form that includes individual, peer,and community, we defined the dynamic influence factor functions. Finally, we propose a user participation behavior prediction factor graph model. This model uses the Hammersley–Clifford theory and Markov random field methods, to predict individual participation behavior and perceive topic development trends. Figure 3 shows the model framework.
3.2 Dynamic Influence Factor Functions

(1) The individual candidate dynamic influence factor function is

(2) The peer candidate dynamic influence factor function is calculated as follows:


Fig. 3 Model Framework
(3) The community candidate dynamic influence factor function is

3.3 Participation behavior prediction model
According to the Hamersley–Clifford theory and Markov random field theory [27][28], the logarithmic likelihood objective function is defined as (4) shown in the bottom at this page, whereis a normalization factor to ensure a normalized distribution, so that the sum of the probabilities equals to one.Functionsrespectively represent the individual candidate, peer candidates, and community candidates dynamic influence factor functions defined above, andis an indicator function to indicates whether candidateand candidatehave a relationship. For example,if candidateand candidatehave a relationship; otherwiseLikewise,indicates whether candidatebelongs to the communityFinally,is a parameter configuration indicating the weight of different dynamic influence factor functions.

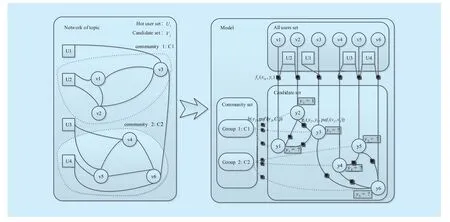
Fig. 4 Model Detail
Thus, predicting whether candidates will participate in the hotspot topic can be converted into the calculation of a set of parameter values to maximize the objective function.
First, we compute the marginal probability of each candidate, i.e., the value ofAs shown in Figure 4, a semi-supervised learning algorithm is leveraged to solve this by offering some known labels for candidates, like labelsandThe network structure can be loopy, so a loopy belief propagation algorithm (LBP) [29][30] is leveraged to calculate the marginal probabilities. The algorithm evaluates the probability by exchanging information between each node and its neighbors. This method decreases the computational complexity from exponential (for the traditional method) to approximately linear growth. The calculation of the marginal probabilities is as follows:

whereσis a normalization factor,represents the sum of belief from the neighboring nodes ofis the sum of belief delivered to the neighboring nodes. Here,andare calculated as follows:


Subsequently, the values of each parameter are updated using a gradient descent algorithm. The formula is calculated as follows,i.e., for

Lastly, we determine whether the model learning algorithm converges. The convergence condition is the difference between the contiguous parameters being less than threshold. The model is convergent when it meets these convergence conditions and output the result. Otherwise, it continues to update the parameters until convergence.

For problem 2, using the network structure and related attributes in the next time step, a probability table is computed using the objective function with the optimal parameters.Furthermore, the marginal probability of each node is calculated using LBP and the participation behavior of every candidate is judged.

Table IV model learning algorithm

Table V Statistics of the three topics
3.4 Model learning algorithm
The learning parameters and learning factors are initialized for the model learning algorithm so that it can calculate the marginal probabilities of each node. Then parameters are updated using the gradient descent algorithm until convergence. According to the network structure and related attributes in the next time, the probability table is computed by the objective function with the optimal parameters. Furthermore, the marginal probability of each node is calculated again and the participation behavior of each candidate is judged. The complexity of the model learning algorithm is relevant to the repeated phase of the LBP algorithm and updating phase of the learning parameters. The repeating phase of LBP algorithm costsand the updating phase of the learning parameters coststhe forecast phase castsBased on this analysis,the total time complexity of the model learning algorithm is
IV. EXPERIMENTAL RESULTS
4.1 Experimental setup
Data Sets:the data sets in this paper are collected from Tencent Microblog, which is one of the most popular online social network platforms in China. To evaluate the performance of the user participation behavior prediction model, we demonstrated it on three different hotspot topics:personal tailoras topic A,Dad, where are we going? Season2as topic B,andrare blood typeas topic C. Table 5 shows the statistic of the three topics.
Topic A:The first hotspot is personal tailor,which started on December 19,2013, and ended on January 4, 2014. The hotspot had 3,504 participant users and 847,500 candidates.There were 1,365,106 relationships among all the users. In addition, the histrionic behavior of all the users consists of 19,574,742 behaviors for this topic.
Topic B:The second hotspot isDad, where are we going? Season 2,which started on May 14, 2014, and ended on September 4, 2014.The hotspot had 7,022 participant users and 879,780 candidates. There were 1,075,703 relationships among all the users. In addition,the histrionic behavior of all the users consists of 22,356,033 behaviors for this topic.
Topic C:The third hotspot is aboutrare blood type,from February 25, 2013, to September 7, 2014. The hotspot had 9,626 participant users and 534,459 candidates. There were 582,815 relationships among all the users. In addition, the histrionic behavior of all the users consists of 11,215,295 behaviors for this topic.
Evaluation metrics:The model’s prediction result is checked using three metrics:precision, recall, and F1-Measure. In addition,the traditional machine learning classification algorithms of logistic regression and decision tree are used for comparison with the prediction model to evaluate its performance and analyze the results.
4.2 Prediction performance analysis
We leveraged the data set, including the historic behavior and relationships among participant users and candidates to predict the participation behavior of candidates at the next time step, i.e., we predict whether the fans of hot users will participate in the discussion of this topic in future.
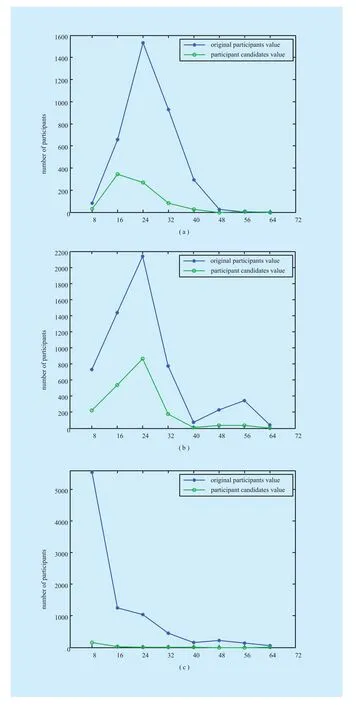
Fig. 5 Distribution of the participation in each topic. (a) Distribution of the participation in topic A. (b) Distribution of the participation in topic B. (c) Distribution of the participation in topic C

Fig. 6 Average topic driving force for each topic. (a) Topic A’s average topic driving force. (b) Topic B’s average topic driving force. (c) Topic C’s average topic driving force
First, the users who are possible participants in the hotspot in the next time step are selected as candidates. Figure 5 shows the distribution of the participation in Topics A,B, and C. The x-axis is time (in hours) and the y-axis represents the number of participants.The original value is the actual value of participant users at this time step. The candidate value is the number of candidates who participate in topic during at this time step, and the C. Thex-axis stands for the attributes type,and they-axis indicates the probability that a candidate participates in the topic. To better illustrate this,is set. For the community attribute, communities are detected using the clique-percolation-method (CPM)algorithm [31]. There are 132 communities in Topic A, 266 communities in Topic B, and 90 communities in Topic C. The above attributes are observed and analyzed in this paper. Furthermore, we select the attributes using a large amount of information.
Meanwhile, the parameters in Topics A, B and C are updated by Eqs.11-12. The process of updating parameters in Topic A is shown in Figure8.
In Figure 8, the three figures in the top row are comparison charts of the real expected value and expected value calculated using Eq.11. Thex-axis represents number of iteration, and they-axis indicates the expectation value. Lines represent the real expectations value with the real dynamic influence factor function; and the curve indicates the expectation value calculated according to the model.Figures 8(a), 8(b), and 8(c) clearly show that the calculated expectations of the dynamic influence factor function slowly converge to the real expectations as the iterations increase.candidates are fans of the participant users.From Figure 5, it is easy to observe that the number of participant candidates is close to actual values for Topics A, B, and C. Hence, it is practical significance that fans of participant users are candidates
Second, considering the individual attributes, four attributes are analyzed, as shown Figure 6. Figure 6 shows the average topic driving force for some participant users for Topics A, B, and C. Thex-axis stands for the users ID of the hotspot topic, and they-axis represents the average topic driving force value. We observe that few users stay at larger value. It is easy to distinguish that some users that have a strong topic driving force.
With respect to peer attributes, there is detailed information presented in Figure 7.regarding the attributes in Topics A, B, and In addition,the three figures of the second row show how the parameters change over the iterations. The x-axis represents the number of iterations, and the y-axis stand for the value of the updated parameters. Figure 8(d) shows the change of individual parameters, Figure 8(e)indicates the change of peer parameters, and Figure 8(f) represents the change of community parameters. As the iterations increase, the update parameters gradually stabilize. Some parameters are negative values in Figure 8(d).This is because of the mutual influence between those attributes or the fact that the attributes have the opposite effect on participation result. At the same time, perhaps the data of this attribute is not appropriate.
Finally, the performance of the classifier was evaluated using three standard indicators:precision, recall and F1-Measure. In this paper, we selected logistic regression and the random forest algorithm for comparison with the user participation behavior prediction model, as shown in Tables 6-8.
In Table 6-8, it can be observed that the three indicators of the user participation behavior prediction model are better than those of the logistic regression and random forest.Moreover, the group development trend of hotspot is estimated by predicting individual participant user. Therefore, the user participation behavior prediction model can not only predict the participation behavior at the micro-level, but also forecast the development trends of a hotspot in the next time step.
V. CONCLUSION
In this paper, based on user behavior and relationship data, a hotspot user participation behavior prediction model was proposed. User participation behavior and a topic development trend can be predicted by this model. First,the fans of participant users in the current topic are considered as candidates. Second,according to the influence expression form of participating in topic, three dynamic influence factor functions are defined: individual, peer,and community influence. Finally, a hotspot user participation behavior prediction model is given based on the basic concepts of random field theory. In addition to individual participation behavior, the model dynamically estimates group development trends for a hotspot.Moreover, the performance of the model was analyzed by three real-world hotspot topics from Tencent microblog, which is a wellknown social networking site in China.

Fig. 7 Attribute analysis and observation. (a) Individual attribute analysis and observation. (b) Peer attribute analysis and observation

Table VI Indicator Comparison for Topic A

Table VII Indicator Comparison for Topic B

Table VIII Indicator Comparison for Topic C
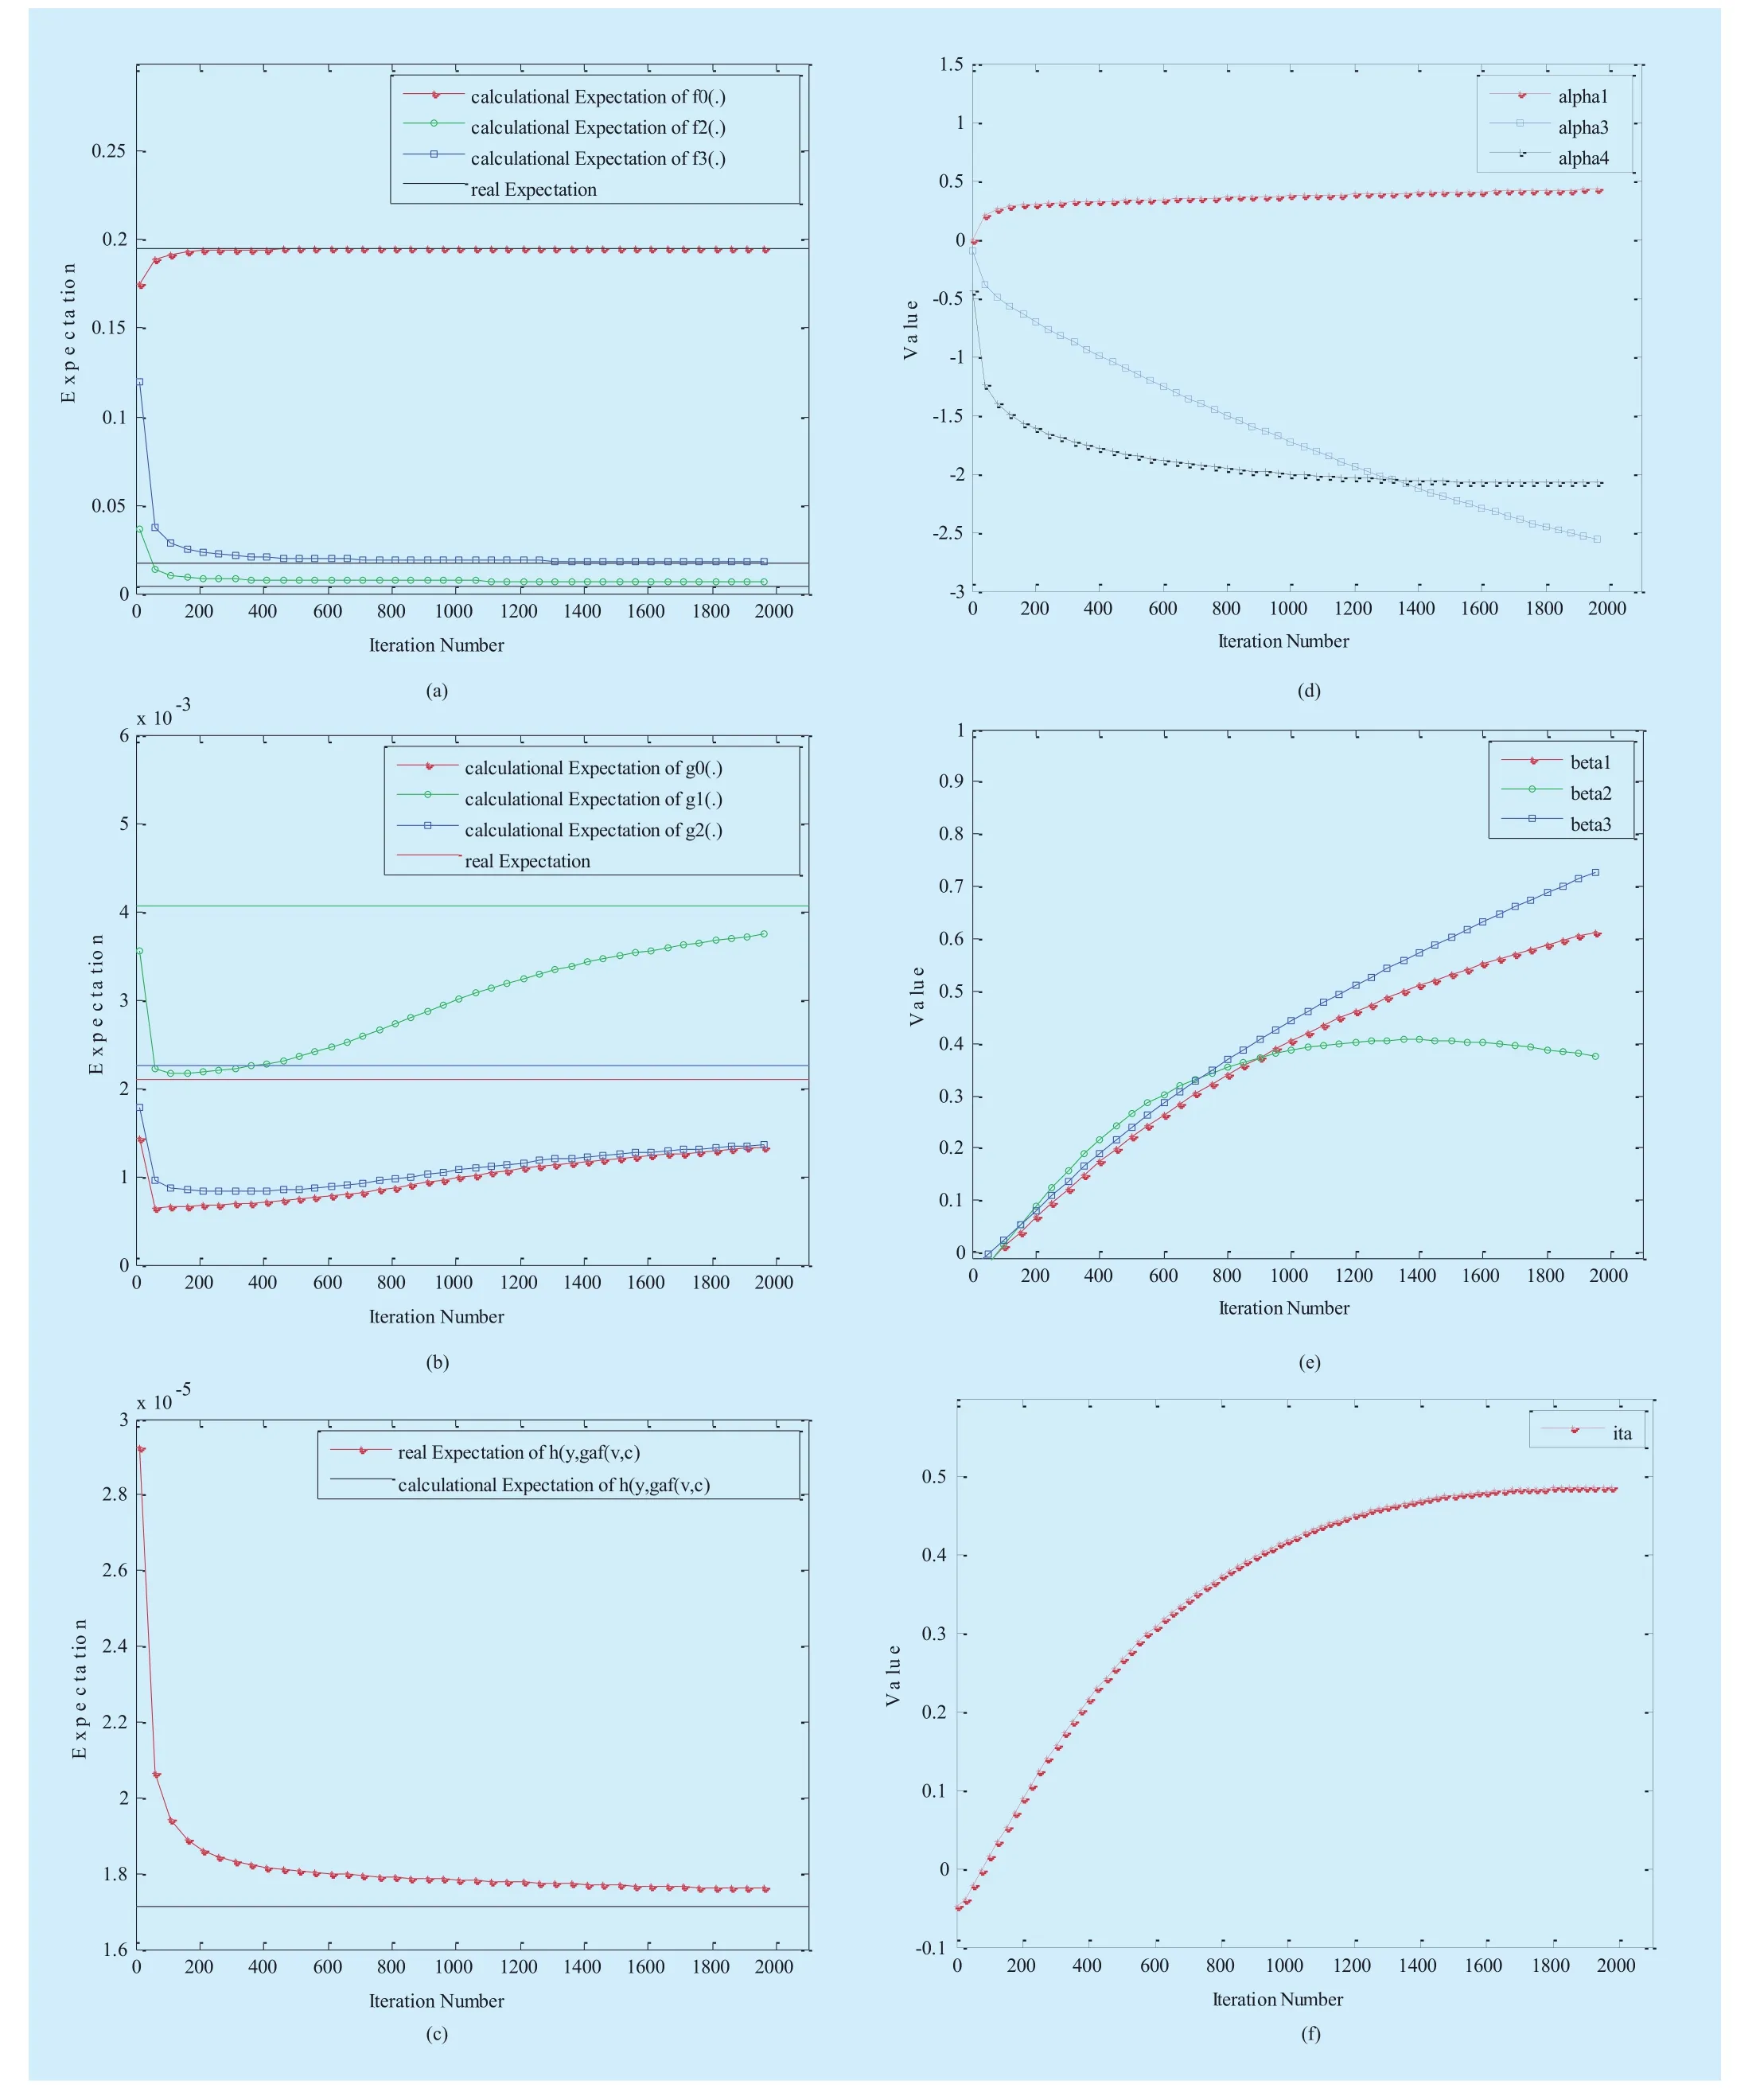
Fig. 8 Process parameter learning. (a) Comparison of partial expected value f(.). (b) Comparison of partial expected value g(.). (c) Comparison of partial expected value h(.). (d) Process of individual parameter optimization. (e) Process of peer parameter optimization. (f) Process of community parameter optimization
The experimental results show that the model can improve the accuracy rate, recall rate, and F1-Measure for user behavior prediction. Furthermore, optimizing the network structure of the factor graph model and adding more relevant attributes for information dissemination further enhance the performance of participation behavior prediction and the development of hotspots in the future.
ACKNOWLEDGEMENTS
This work is supported by the National Key Basic Research Program (973 program) of China (No.2013CB329606), National Science Foundation of China (Grant No.61272400),Science and Technology Research Program of the Chongqing Municipal Education Committee (No.KJ1500425), WenFeng Foundation of CQUPT(No.WF201403) and Chongqing Graduate Research And Innovation Project(-No.CYS14146).
[1] Kim I J, Barthel B P, Park Y, et al. “Network analysis for active and passive propagation models”,Networks, vol. 63, no. 2, pp 160–169, March,2014.
[2] Li J, Peng W, Li T, et al. “Social network user influence sense-making and dynamics prediction”,Expert Systems with Applications, vol. 41,no. 11, pp 5115-5124, February, 2014.
[3] Barbieri N, Bonchi F, Manco G. “Topic-aware social influence propagation models”,Knowledge and information systems, vol. 37, no. 3, pp 555-584, April, 2013.
[4] Gao L, Alibart F, Strukov D B. “Programmable CMOS/memristor threshold logic”,IEEE Transactions on Nanotechnology, vol. 12, no. 2, pp 115-119, January, 2013.
[5] Guille A, Hacid H. “A predictive model for the temporal dynamics of information diffusion in online social networks”,Proceedings of the 21stinternational conference companion on World Wide Web. ACM, pp 1145-1152, April, 2012.
[6] Zang W, Zhang P, Zhou C, et al. “Locating multiple sources in social networks under the SIR model: A divide-and-conquer approach”,Journal of Computational Science, vol. 10, pp 278-287, May , 2015.
[7] Wang J, Zhao L, Huang R. “SIRaRu rumor spreading model in complex networks”,Physica A Statistical Mechanics & Its Applications, vol.398, no. 1, pp 43–55, March, 2014.
[8] Abdullah S, Wu X. “An epidemic model for news spreading on twitter”,Tools with Artificial Intelligence (ICTAI), 23rd IEEE International Conference on. IEEE, pp 163-169, Nov. 2011.
[9] Rogers E M. “Diffusion of innovations”,Simon and Schuster, 2010.
[10] Liu L, Liang H. “Influence Analysis for Celebrities via Public Cloud and Social Platform”,China Communications, vol. 13, no. 8, pp 53-62, September, 2016.
[11] Kwon K H, Stefanone M A, Barnett G A. “Social network influence on online behavioral choices exploring group formation on social network sites”,American Behavioral Scientist, vol. 58, no.10, pp 1345-1360, March, 2014.
[12] Yang J, Leskovec J. “Modeling Information Diffusion in Implicit Networks”,2010 IEEE International Conference on Data Mining. IEEE Computer Society, pp 599-608, Dec. 2014.
[13] Tang J, Wu S, Sun J. “Confluence: Conformity influence in large social networks”,Proceedings of the 19th ACM SIGKDD international conference on Knowledge discovery and data mining. ACM,pp 347-355, August, 2014.
[14] Myers S A, Sharma A, Gupta P, et al. “Information network or social network?: The structure of the twitter follow graph”,Proceedings of the companion publication of the 23rd international conference on World wide web companion, pp 493-498, April, 2014.
[15] Bakshy E, Rosenn I, Marlow C, et al. “The role of social networks in information diffusion”,ACM,April, 2012.
[16] Dong Y, Yang Y, Tang J, et al. “Inferring user demographics and social strategies in mobile social networks”,Proceedings of the 20th ACM SIGKDD international conference on Knowledge discovery and data mining. ACM, pp 15-24, August, 2014.
[17] Xu M, Wu J, Du Y, et al. “Discovery of important crossroads in road network using massive taxi trajectories”,arXiv preprint arXiv, August, July,2014.
[18] Guy I, Geyer W. “Social recommender system tutorial”,Proceedings of the 8th ACM Conference on Recommender systems. ACM, pp 403-404,October, 2014.
[19] Chaney A J B, Blei D M, “Eliassi-Rad T. A probabilistic model for using social networks in per-sonalized item recommendation”,Proceedings of the 9th ACM Conference on Recommender Systems. ACM, pp 43-50, September, 2015.
[ 20] Christakis N A, Fowler J H. “Social contagion theory: examining dynamic social networks and human behavior”,Statistics in medicine, vol. 32,no. 4,pp 556-577, June, 2013.
[ 21] Gomez Rodriguez M, Leskovec J, Schölkopf B.“Structure and dynamics of information pathways in online media”,Proceedings of the sixth ACM international conference on Web search and data mining. ACM, pp 23-32, February,2013.
[2 2] Gomez Rodriguez M, Leskovec J, Krause A.“Inferring networks of diff usion and influence”,Proceedings of the 16th ACM SIGKDD international conference on Knowledge discovery and data mining. ACM, pp 1019-1028, July, 2010.
[23] Benevenuto F, Rodrigues T, Cha M, et al. “Characterizing user behavior in online social networks”,Proceedings of the 9th ACM SIGCOMM conference on Internet measurement conference.ACM, pp 49-62, November, 2009.
[24] Wilson C, Boe B, Sala A, et al. “User interactions in social networks and their implications”,Proceedings of the 4th ACM European conference on Computer systems. ACM, pp 205-218, April,2009.
[25] Pedroche F, Moreno F, González A, et al. “Leadership groups on social network sites based on personalized pagerank”,Mathematical and Computer Modelling, vol. 57, no. 7, pp 1891-1896, April, 2013.
[26] Kschischang F R, Frey B J, Loeliger H A. “Factor graphs and the sum-product algorithm”,Information Theory, vol. 47, no. 2, pp 498-519, August, 2001.
[27] Lafferty J, McCallum A, Pereira F. “Conditional random fields: Probabilistic models for segmenting and labeling sequence data”,Proceedings of the eighteenth international conference on machine learning, ICML.vol.1, pp 282-289,2001.
[28] Finkel J R, Grenager T, Manning C. “Incorporating non-local information into information extraction systems by gibbs sampling”,Proceedings of the 43rd Annual Meeting on Association for Computational Linguistics. Association for Computational Linguistics, pp 363-370, June,2005.
[29] Murphy K, Weiss Y, Jordan M. “Loopy-belief propagation for approximate inference”,Uncertainty in Artificial Intelligence, August, 1999.
[30] McEliece, Robert J., David J. C. “Turbo decoding as an instance of Pearl’s” belief propagation” algorithm.”,IEEE Journal on selected areas in communications, vol. 16, no. 2, pp 140-152, August,2002.
[31] Palla G, Derényi I, Farkas I, et al. “Uncovering the overlapping community structure of complex networks in nature and society”,Nature,vol. 435, no. 7043, pp 814-818, June, 2005.
杂志排行
China Communications的其它文章
- A Reliable Routing Algorithm with Network Coding in Internet of Vehicles
- Achievable Uplink Rate Analysis for Distributed Massive MIMO Systems with Interference from Adjacent Cells
- Multi-Owner Keyword Search over Shared Data without Secure Channels in the Cloud
- Microblog User Recommendation Based on Particle Swarm Optimization
- Ethics Aware Object Oriented Smart City Architecture
- Walsh Hadamard Transform Based Transceiver Design for SC-FDMA with Discrete Wavelet Transform
