分时段修正双源模型在西北干旱区玉米蒸散量模拟中的应用*
2017-05-09闵雷雷沈彦俊周晓旭刘峰贵
吴 林, 闵雷雷, 沈彦俊**, 周晓旭, 刘峰贵
分时段修正双源模型在西北干旱区玉米蒸散量模拟中的应用*
吴 林1, 2, 闵雷雷2, 沈彦俊2**, 周晓旭2, 刘峰贵1
(1. 青海师范大学生命与地理科学学院 西宁 810000; 2. 中国科学院遗传与发育生物学研究所农业资源研究中心/中国科学院农业水资源重点实验室 石家庄 050022)
蒸散发(ET)是陆地水循环过程的重要组成部分, 同时也是区域能量平衡以及水量平衡的关键环节, 精确估算ET, 对于提高水分利用效率以及优化区域用水结构具有重要意义。本文利用黑河重大计划观测数据, 对比了考虑CO2浓度和不考虑CO2浓度对玉米冠层影响的冠层阻力模型, 分别将其耦合到双源的Shuttleworth-Wallace(S-W)模型中, 并利用这两种模型分时段对玉米整个生育期内半小时尺度上的ET进行模拟, 利用涡度相关实测数据对模型进行验证, 最后分别对影响玉米冠层阻力的气象要素和影响ET的阻力参数进行敏感性分析, 探寻大气CO2浓度改变条件下黑河中游绿洲区玉米不同生长阶段的农田耗水规律。结果表明: 本文所修正的考虑CO2浓度对玉米冠层影响的冠层阻力模型耦合到S-W模型后, 能够较精准地模拟玉米整个生育期不同生长阶段半小时尺度上农田耗水过程。敏感性分析表明: 各生长阶段冠层阻力()和冠层面高度到参考面高度间的空气动力阻力()对ET的影响最为强烈, 其他阻力参数对ET的影响不明显, ET的变化程度随着和的增大而减小。本文所修正的考虑CO2浓度影响的分时段双源模型能够精准地模拟玉米整个生育期各生长阶段的ET, 可为种植结构调整和土地利用方式改变以及CO2浓度变化环境下的农田蒸散研究提供参考。
Shuttleworth-Wallace模型; 蒸散发; 大气CO2浓度; 阻力参数; 玉米
植被蒸腾(T)和土壤蒸发(E)所构成的蒸散发(ET)是水循环过程的重要组成部分, 同时也是区域能量平衡以及水量平衡的关键环节[1-2], 精确估算蒸散发, 对于提高水分利用效率以及优化区域用水结构具有重要意义[3-4]。气孔作为蒸散发过程中植物与大气进行水碳交换的通道, 其开闭程度受到植物生理和诸多环境要素的共同控制, 因此利用模型模拟蒸散变化规律及其特征成为蒸散研究的有效手段。目前蒸散模型主要分为单源模型、双源模型和多源模型, 这些模型分别引入各种阻力参数来描述土壤蒸发和植被蒸腾, 其中描述了水分通过作物冠层所需要克服的阻力——冠层阻力, 其模拟精度决定蒸散的模拟精度[5]。
基于能量平衡的单源Penman-Monteith (P-M)模型将作物冠层和地表作为一个整体, 利用部分气象要素和作物属性就可以估算作物蒸散量[5]。众多研究表明基于“大叶”假设的P-M模型对作物冠层下表面性质具有较强的敏感性[6-9], 对作物完全覆盖地表时具有较高的精度, 而在作物初始阶段会产生较大误差[4,7,10-13]。1985年Shuttleworth和Wallace对稀疏覆盖表面下的蒸散进行研究, 引入了冠层阻力参数和土壤阻力参数, 建立了由作物冠层以及冠层下表面两部分组成的双源蒸散模型, 该模型由于考虑了土壤蒸发, 机理更加明确, 因而得到了广泛应用[4,14-16]。但目前的蒸散模型并未考虑大气CO2浓度的影响, 而大气CO2浓度变化直接影响到作物与外界的水气通量交换[17-18]。研究表明CO2浓度增加会使气孔导度下降, 作物蒸腾作用减弱, 而高浓度CO2则能诱使气孔关闭, 进而对作物蒸散以及水分利用效率产生较大影响[19-24]。Wand等[25]研究发现CO2浓度加倍时, C4作物的气孔导度降低29%; Morison等[26]对CO2浓度升高情境下植物的响应规律进行了研究, 结果表明CO2浓度加倍会使大田作物的气孔导度降低40%。
在以气温上升和大气CO2浓度升高为主要特征的全球变化背景下, 大气CO2浓度升高和水资源短缺已经对区域农业的可持续发展产生了严重影响[27]。而目前气候变化环境下的农田蒸散研究并未考虑到大气CO2浓度与其他环境因子所产生的协同效应, 因此考虑大气CO2浓度对作物蒸散的影响, 对于揭示作物耗水规律和提高水分利用效率具有重要意义, 尤其是在水分限制区域。现有蒸散模型中的冠层阻力参数并未考虑大气CO2浓度的影响, 但从模型长期预测的角度考虑, 尤其是在未来气候和生态系统水碳平衡变化的模拟预测中[28], 考虑大气CO2浓度变化对冠层阻力和蒸散的影响显得尤为重要。此外, 作物在不同生育阶段具有不同的蒸散规律, 利用模型估算整个生育期的蒸散量, 使用一套相应的参数, 不尽合理, 因此有必要结合作物不同生育期耗水规律, 分阶段估算作物蒸散量, 进而提高模拟精度。
本研究基于Morison等[26]和Easterling等[29]关于CO2浓度变化对气孔导度的影响规律研究, 利用“黑河流域生态-水文过程集成研究”重大计划已有观测数据, 以Shuttleworth和Wallace所构建的双源模型(S-W)为基础, 将玉米()生育期分为3个主要生长阶段, 对比分析了考虑和未考虑CO2浓度对黑河中游绿洲区玉米冠层阻力的影响, 并将其耦合到双源的S-W模型中, 分阶段估算玉米蒸腾和土壤蒸发, 改进部分阻力参数, 利用涡度相关实测数据对模型进行验证, 筛选出能够反映大气CO2浓度变化情境下的冠层阻力模型, 并将其耦合到S-W模型中, 探寻大气CO2浓度改变条件下黑河中游绿洲区玉米不同生长阶段的农田耗水规律。
1 研究区概况与研究方法
1.1 研究区概况
黑河中游绿洲区位于河西走廊中部(图1), 介于98°57′~100°51′E, 38°32′~39°53′N, 海拔为 1 131~2 891 m, 主要包括黑河干流出山口莺落峡以下至正义峡之间的地势平坦区域。本研究区为典型的温带大陆性气候, 流域气候干燥, 降水稀少, 年降水量116.8 mm, 年蒸发量2 365.6 mm, 区内水资源分配严重不均。地带性土壤为灰棕荒漠土和灰漠土, 非地带性土壤主要包括盐土、潮土、风沙土等。玉米是该地区最主要的农作物之一, 其生长主要依赖于地下水以及黑河水灌溉。
1.2 数据来源及处理
本研究所使用的实测数据包括: 自动气象站资料、通量数据、作物株高等, 该数据均来自黑河计划数据管理中心(http://heihedata.org/)。自动气象站观测气象要素包括风速、风向、气温、降水量、湿度等。叶面积指数(LAI)来源于美国国家航天局(NASA)发布的MCD15A3H叶面积指数(LAI)产品(https://search.earthdata.nasa.gov/), 该数据为4 d合成的500 m分辨率L4级叶面积指数产品, 采用3次样条插值将其均匀内插到日尺度, 并假设一天内玉米的叶面积指数不发生变化。本研究使用通量观测矩阵中Site 8(100°22′35′′E, 38°52′21′′N; 1 550.06 m)的数据率定模型参数, Site 11(100°20′31′′E, 38°52′12′′N; 1 575.65 m)、大满站(100°22′20′′E, 38°51′20′′N; 1 556.06 m)的数据用于模型的验证(图1)。3个站点观测时间序列为整个玉米生长季(2012年5月初到9月下旬), 观测时间为9:00—18:30。3站点的通量观测系统主要由三维超声风温仪(CSAT3, Campbell Scientific, USA)和开路CO2/H2O红外气体分析仪(Li-7500A, Li-Cor Inc., USA)组成, 原始数据采样频率为10 Hz, 每30 min输出1组平均通量值[30]。通量站点下垫面作物均为玉米, 垄距为50.8 cm, 行距为43.3 cm, 株距为22 cm, 玉米株高由实测数据采用3次样条插值均匀内插到半小时尺度。原始涡度相关仪器信息及数据处理参考文献[30], 原始数据经过了野点值剔除、延迟时间校正、坐标旋转、角度订正以及严格的质量控制等步骤, 但还需要对部分数据进行再处理: 1)能量闭合度检查, 将能量闭合度超出0.5~1.5的数据剔除, 能量未闭合的数据采用文献[31]中的方法进行强制闭合; 2)剔除空值数据和异常数据, 如实测的潜热通量(LE)<0 W·m-2,cob>2 000 s·m-1或cob<0 s·m-1(cob为利用Penman-Monteith公式反推的冠层阻力值, 本文定义为实测值)。
本研究将玉米整个生育期分为3个生长阶段: 生育前期(2012年6月6日—7月20日, 播种期—出苗期—五叶期—拔节期—抽穗期—吐丝期), 该阶段玉米快速生长, LAI逐渐增大, 地表覆盖经历从稀疏到稠密, 从土壤蒸发大于蒸腾向蒸腾逐渐占主导地位过渡; 生育中期(2012年7月21日—8月31日, 吐丝期—成熟期), 该阶段地表逐渐全部覆盖, 玉米蒸腾逐渐占主导地位, 土壤蒸发逐渐减弱; 生育后期(2012年9月1—20日, 成熟期—收获期), 此阶段玉米基本成熟, 叶片逐渐衰老, 叶片气孔导度减弱, 群体冠层阻力增大, 作物蒸腾明显减弱, 土壤蒸发较上一阶段有所增强。
1.3 模型及参数确定
1.3.1 S-W模型
Shuttleworth和Wallace[8]在1985年以P-M模型为基础, 对稀疏覆盖表面下的蒸散进行研究, 引入冠层阻力和土壤阻力参数, 建立了由作物冠层以及冠层下部所组成的双源蒸散模型。模型形式如下:

(2)
(3)

(5)
(6)

(8)
(9)

(11)
1.3.2 各阻力参数的确定

(13)

(15)
(16)
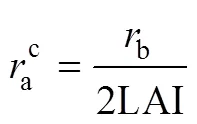
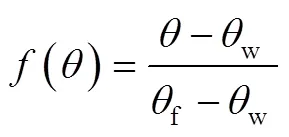
式中:b为边界层平均阻力, s·m-1, 本文取50 s·m-1[35]; LAI为叶面积指数, m2·m-2;为土壤表面最小阻力, s·m-1, 本文取100 s·m-1[34,37];为0~100 cm深度内平均土壤含水量, cm3·cm-3[37],为0~100 cm深度内平均田间持水量, cm3·cm-3。
考虑叶面积指数LAI、净辐射n、土壤有效含水量、饱和水汽压差VPD、气温a以及大气CO2浓度等要素对冠层阻力的影响, 构建了考虑CO2浓度影响()和未考虑CO2浓度()影响的冠层阻力模型, 具体如下[38-39]:

(18)
(19)

(21)
(22)

1.4 模型评价
本文采用决定系数(2), 均值偏移误差(mean bias error, MBE)以及均方根误差(root mean square error, RMSE)来评价模型模拟值(m)与实测值(ob)之间的差异, 检验模型模拟精度。

(25)
(26)
式中:m为模拟值,ob为实测值,为实测值的平均值,为样本容量。本研究中实测值(ETob)为涡度相关所观测的潜热通量值, 模拟值为利用模型模拟的ET值(ETm)。
2 模型验证与分析
2.1 模型参数率定及验证
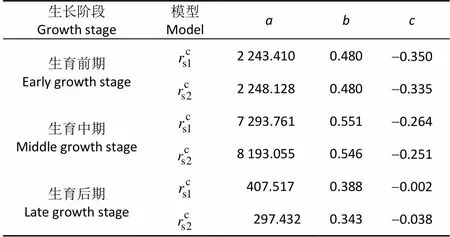
参数率定采用Site 8的通量数据(2012年6月6日—9月20日), 利用最小二乘法对生育前期(6月6日—7月20日)、生育中期(7月21日—8月31日)、生育后期(9月1—20日)进行非线性回归, 率定模型参数, 模型参数优选值见表1, 模型对比结果见图2和图3, 采用Site 11和大满站的数据检验模型模拟精度。
表1 考虑大气CO2浓度()和未考虑CO2浓度()影响的玉米不同生长阶段冠层阻力模型参数最优值
Table 1 Optimum parameters of the two canopy resistance models considering () and non-considering () CO2 concentration in three growing stages of maize

表1 考虑大气CO2浓度()和未考虑CO2浓度()影响的玉米不同生长阶段冠层阻力模型参数最优值
生长阶段 Growth stage模型Modelabc 生育前期Early growth stage 2 243.4100.480-0.350 2 248.1280.480-0.335 生育中期Middle growth stage 7 293.7610.551-0.264 8 193.0550.546-0.251 生育后期Late growth stage 407.5170.388-0.002 297.4320.343-0.038
由图2和图3可知, 在参数率定期, 将考虑了CO2浓度和未考虑CO2浓度影响的冠层阻力模型耦合到双源的S-W模型中, 二者均能够较为准确地反映玉米在不同生长阶段的蒸散变化规律。但考虑了CO2浓度对玉米冠层阻力影响的S-W模型(图2e)模拟精度更高, 各生长阶段蒸散变化规律均得到了更为真实的反映; 而未考虑CO2浓度对玉米冠层阻力影响的S-W模型(图3e), 所模拟的生育中期蒸散量偏高, 进而降低了整个生育期的模拟效果。
在生育前期(图2a和图3a), 玉米快速生长, LAI逐渐增大, 其呼吸作用较为强烈, 地表覆盖度从稀疏到稠密, 该阶段由土壤蒸发大于蒸腾向蒸腾逐渐占主导地位过渡, 此时农田蒸散最为复杂, 这也降低了许多模型在此阶段的模拟效果, 但考虑了CO2浓度对玉米冠层阻力影响的S-W模型(图2a)能够从最大程度上反映该阶段玉米蒸散量对环境变量的响应过程。在玉米生育中期(图2b), 光照、热量和水分充足, 玉米光合作用最为强烈, 对CO2需求较大, 此阶段地表逐渐全部覆盖, 冠层获得的能量主要用于干物质积累, 该阶段玉米蒸腾逐渐占主导地位, 土壤蒸发进一步减弱, 相对于前一阶段蒸散较为稳定, 对比图2b和图3b可以看出, 考虑了CO2浓度对玉米冠层影响的S-W模型能够很好地反映这一过程, 而未考虑CO2浓度对玉米冠层影响的S-W模型模拟效果较低。在生育后期(图2c), 玉米基本成熟, 叶片快速衰老, 叶片气孔导度减弱, 群体冠层阻力增大, 加之母体去除过程对剩余植株叶片的损害, 作物蒸腾明显减弱, 土壤蒸发较上一阶段有所增强, 相比之下考虑了CO2浓度对玉米冠层阻力影响的S-W模型(图2c)仍具有较高的模拟精度。
ETob:蒸散量观测值; ETm: 蒸散量模拟值。ETob: observed evapotranspiration; ETm: model simulated evapotranspiration.
从图2d、图2e和图3d图3e可以看出, 对于Site 8整个生育期内玉米蒸散量的模拟, 考虑了CO2浓度对玉米冠层阻力影响的S-W模型(图2d)比未考虑CO2浓度对玉米冠层阻力影响的S-W模型(图3d)模拟效果更好, 二者模拟值与实测值之间的2分别为0.96、0.93, 但是前者的RMSE和MBE要比后者小。对整个生育期而言, 前者仅在生育后期(图2e)存在小部分高估现象, 而后者在整个生育期(图3e)均存在高估现象, 因此将考虑了CO2浓度影响的冠层阻力模型耦合到S-W模型中后, 能够更为准确地用于估算玉米整个生育期内不同生长阶段的蒸散量。
2.2 模型进一步验证
将考虑了CO2浓度影响和未考虑CO2浓度影响的冠层阻力模型耦合到双源的S-W模型中, 分别对Site 11和大满站玉米的蒸散量进行模拟, 模拟效果见图4-图7。由图4、图5可知: 对于Site 11, 考虑了CO2浓度对玉米冠层阻力影响的S-W模型(图4)和未考虑CO2浓度影响的S-W模型(图5), 均能够较好地模拟整个生育期内不同生长阶段玉米的蒸散量。相比之下, 考虑了CO2浓度对玉米冠层阻力影响的模型, 能够更好地模拟玉米3个生长阶段蒸散量变化, 3个阶段模拟值与实测值之间的决定系数分别达0.96、0.98和0.88, 整个生育期(图4d)的决定系数达0.96, 各生长阶段模拟值与实测值基本吻合, 误差很小。而未考虑CO2浓度对玉米冠层阻力影响的S-W模型, 对于生育前期(图5a)和后期(图5c)模拟效果较差, 误差较大, 3个阶段模拟值与实测值之间的决定系数分别为0.95、0.97和0.64。对于整个生育期(图5e)玉米蒸散量的模拟值均存在低估现象, 尤其是在中后期, 这主要是因为该阶段光照和气温降低, 不同时刻的作物蒸腾和土壤蒸发呈现出较大的变异性, 而未考虑CO2浓度对玉米冠层阻力影响的S-W模型对这种变化不能快速响应, 使得部分模拟值偏低。
ETob:蒸散量观测值; ETm: 蒸散量模拟值。ETob: observed evapotranspiration; ETm: model simulated evapotranspiration.
同样利用两种模型对大满站玉米蒸散量进行模拟, 模拟效果见图6和图7。对比图6和图7可知, 考虑了CO2浓度对玉米冠层阻力影响的S-W模型(图6), 能够更好地模拟大满站玉米3个生长阶段的蒸散量, 模拟值与实测值具有较高的一致性, 3个阶段模拟值与实测值之间的决定系数分别达0.98、0.98和0.94, 整个生育期(图6d)的决定系数达0.97, 各阶段的RMSE和MBE都很小。而未考虑CO2浓度对玉米冠层阻力影响的S-W模型(图7)中, 对大满站玉米生育前期(图7a)存在低估现象, 且不能很好地反映各生长阶段玉米蒸散量的峰值。由于后期土壤蒸发和玉米蒸腾具有较大的变异性, 使得后期的模拟误差较大, 3个阶段模拟值与实测值之间的决定系数分别为0.97、0.97和0.80, 整个生育期(图7d)的决定系数达0.95, 模拟精度较低。
综合图4、图5、图6和图7可知, 将考虑了CO2浓度对玉米冠层阻力影响的模型耦合到双源的S-W模型后, 能够更好地模拟玉米在生理结构、气象条件发生变化情况下蒸散量的变化, 能够较为准确地区分土壤蒸发和作物蒸腾, 模拟值与实测值具有较高的一致性, 尤其是在玉米生育前期和中期, 并且模型参数容易获取且具有较好的适应性, 这表明该模型能够用于估算干旱区覆盖度较低情况下玉米的蒸散量, 可以解决利用P-M模型在模拟稀疏覆盖条件下的蒸散所产生的较大误差问题。
ETob:蒸散量观测值; ETm: 蒸散量模拟值。ETob: observed evapotranspiration; ETm: model simulated evapotranspiration.
2.3 敏感性分析
由于作物自身因素以及外部要素的改变, 模型对外部要素的响应存在较大差异, 因此首先分析CO2浓度等要素变化对冠层阻力模型的敏感性, 其次分析各阻力参数变化对耦合后双源S-W模型的敏感性。引入模型结果关于变量的敏感性系数, 如下式所示:

首先计算不同生长阶段各要素变化±10%和±30%时对冠层阻力的影响。由图8可知, 在玉米生育前期(图8a)和中期(图8b)对影响最大的气象要素是净辐射n、土壤有效含水量和叶面积指数LAI, 其次是饱和水汽压差VPD, 最后是气温a和CO2浓度, 并且随着要素变幅的增加而增大; 在生育后期(图8c), 玉米冠层阻力对土壤有效含水量和叶面积指数LAI最为敏感, 其次是净辐射n。在生育中期(图8b)和后期(图8c), 当CO2浓度分别增加10%和30%时对的影响程度已经超过了气温a对的影响。
其次计算玉米不同生长阶段各阻力参数变化±10%和±30%时对蒸散发ET的影响, 结果见图9。由图9可以看出, 在整个生育期对ET影响最大的阻力参数是冠层阻力, 其次是冠层面高度到参考面高度间的空气动力阻力, ET对其他阻力参数敏感性程度很小, 这种影响在生育前期(图9a)和后期(图9b)最为强烈。ET的变化量随着和的增大而减小, 但这种影响作用随着和变动幅度的增大而逐步降低。分析可知,代表了通过玉米气孔和所有叶表面的水气流所需要克服的阻力,的增加意味着气流通过玉米叶片所需要克服的阻力增大,的增加使得玉米冠层导度减小, 从而抑制了水分流失, 反之的减小增大了冠层导度, 使得玉米蒸腾更为旺盛, 从而带走了更多的水分。因此, 将考虑了CO2浓度影响的冠层阻力模型耦合到双源S-W模型中分阶段计算农田蒸散量时, 需要特别注意不同生育阶段对蒸散量计算结果影响较大的阻力参数和的合理确定。
ETob:蒸散量观测值; ETm: 蒸散量模拟值。ETob: observed evapotranspiration; ETm: model simulated evapotranspiration.
ETob:蒸散量观测值; ETm: 蒸散量模拟值。ETob: observed evapotranspiration; ETm: model simulated evapotranspiration.
ETob:蒸散量观测值; ETm: 蒸散量模拟值。ETob: observed evapotranspiration; ETm: model simulated evapotranspiration.
n: 冠层上方太阳净辐射;: 0~100 cm深度内平均土壤含水量; VPD: 饱和水汽压差;a: 气温; CO2: 大气CO2浓度; LAI: 叶面积指数。n: net solar radiation above canopy;: average soil water content of 0-100 cm layer; VPD: vapor pressure deficit;a: air temperature; CO2: air CO2concentration;LAI: leaf area index.

3 结论与讨论
本研究利用黑河重大计划已有观测数据, 对比了考虑及未考虑CO2浓度对玉米冠层影响的冠层阻力模型, 以双源S-W模型为基础, 分别将冠层阻力模型耦合到双源S-W模型中, 分时段率定模型参数, 进而估算了各阶段玉米蒸腾和土壤蒸发, 并利用涡度相关实测数据对模型进行验证, 得到以下结论:
1)将考虑了大气CO2浓度对玉米冠层影响的冠层阻力模型耦合到双源的S-W模型中, 能够更为精准地模拟玉米整个生育期不同生长阶段半小时时间尺度上玉米农田耗水过程, 模型参数容易获取且具有较好的适应性。
2)敏感性分析表明: 玉米冠层阻抗对n、和LAI最为敏感, 对其他气要素敏感程度较低。玉米整个生育期不同生长阶段的阻力参数对蒸散发的影响程度不同, 蒸散发对和最为敏感, 对其他阻力参数不敏感, 因此将考虑了CO2浓度影响的冠层阻力模型耦合到双源的S-W模型分阶段计算农田蒸散量时, 需要特别注意阻力参数和的合理确定。
与此同时, 本文中考虑了大气CO2浓度对玉米冠层影响的冠层阻力模型耦合到双源的S-W模型中能够对玉米不同生长阶段的蒸散量进行精准模拟, 但仅采用了3个站点的数据, 受短期观测数据的限制, 需要在后续工作中采用更多及更长时间序列的实验数据对CO2浓度对冠层阻力的影响做进一步修正。其次, 本研究参考了前人的研究, 仅考虑了CO2浓度变化对冠层阻力的影响, 缺少CO2浓度变化对叶面积指数的影响, 这将在后续工作中进行完善。
[1] Burba G G, Verma S B. Seasonal and interannual variability in evapotranspiration of native tallgrass prairie and cultivated wheat ecosystems[J]. Agricultural and Forest Meteorology, 2005, 135(1/4): 190–201
[2] Zhang X Y, Chen S Y, Sun H Y, et al. Changes in evapotranspiration over irrigated winter wheat and maize in North China Plain over three decades[J]. Agricultural Water Management, 2011, 98(6): 1097–1104
[3] Ding R S, Kang S Z, Zhang Y Q, et al. Partitioning evapotranspiration into soil evaporation and transpiration using a modified dual crop coefficient model in irrigated maize field with ground-mulching[J]. Agricultural Water Management, 2013, 127: 85–96
[4] Zhang B Z, Kang S Z, Li F S, et al. Comparison of three evapotranspiration models to Bowen ratio-energy balance method for a vineyard in an arid desert region of northwest China[J]. Agricultural and Forest Meteorology, 2008, 148(10): 1629–1640
[5] Allen R G, Pereira L S, Raes D, et al. Crop Evapotranspiration-Guidelines for Computing Crop Water Requirements. FAO Irrigation and Drainage Paper No. 56[M]. Rome: FAO-Food and Agriculture Organization Press, 1998: 5–20
[6] Shuttleworth W J, Gurney R J. The theoretical relationship between foliage temperature and canopy resistance in sparse crops[J]. Quarterly Journal of the Royal Meteorological Society, 1990, 116(492): 497–519
[7] Lagos L O, Martin D L, Verma S B, et al. Surface energy balance model of transpiration from variable canopy cover and evaporation from residue-covered or bare-soil systems[J]. Irrigation Science, 2009, 28(1): 51–64
[8] Shuttleworth W J, Wallace J S. Evaporation from sparse crops — An energy combination theory[J]. Quarterly Journal of the Royal Meteorological Society, 1985, 111(469): 839–855
[9] Rana G, Katerji N. A measurement based sensitivity analysis of the Penman-Monteith actual evapotranspiration model for crops of different height and in contrasting water status[J]. Theoretical and Applied Climatology, 1998, 60(1/4): 141–149
[10] Sumner D M, Jacobs J M. Utility of Penman-Monteith, Priestley-Taylor, reference evapotranspiration, and pan evaporation methods to estimate pasture evapotranspiration[J]. Journal of Hydrology, 2005, 308(1/4): 81–104
[11] Katerji N, Rana G, Fahed S. Parameterizing canopy resistance using mechanistic and semi-empirical estimates of hourly evapotranspiration: Critical evaluation for irrigated crops in the Mediterranean[J]. Hydrological Processes, 2011, 25(1): 117–129
[12] Rana G, Katerji N. Measurement and estimation of actual evapotranspiration in the field under Mediterranean climate: A review[J]. European Journal of Agronomy, 2000, 13(2/3): 125–153
[13] Farahani H J, Howell T A, Shuttleworth W J, et al. Evapotranspiration: Progress in measurement and modeling in agriculture[J]. Transactions of the ASABE, 2007, 50(5): 1627–1638
[14] Zhou M C, Ishidaira H, Hapuarachchi H P, et al. Estimating potential evapotranspiration using Shuttleworth-Wallace model and NOAA-AVHRR NDVI data to feed a distributed hydrological model over the Mekong River basin[J]. Journal of Hydrology, 2006, 327(1/2): 151–173
[15] Wallace J S. Calculating evaporation: Resistance to factors[J]. Agricultural and Forest Meteorology, 1995, 73(3/4): 353–366
[16] Li S E, Zhang L, Kang S Z, et al. Comparison of several surface resistance models for estimating crop evapotranspiration over the entire growing season in arid regions[J]. Agricultural and Forest Meteorology, 2015, 208: 1–15
[17] Ficklin D L, Luedeling E, Zhang M. Sensitivity of groundwater recharge under irrigated agriculture to changes in climate, CO2concentrations and canopy structure[J]. Agricultural Water Management, 2010, 97(7): 1039–1050
[18] Ficklin D L, Zhou L Y, Luedeling E, et al. Climate change sensitivity assessment of a highly agricultural watershed using SWAT[J]. Journal of Hydrology, 2009, 374(1/2): 16–29
[19] Mo X G, Liu S X, Lin Z H, et al. Regional crop yield, water consumption and water use efficiency and their responses to climate change in the North China Plain[J]. Agriculture, Ecosystems & Environment, 2009, 134(1/2): 67–78
[20] Lammertsma E I, Boer H J D, Dekker S C, et al. Global CO2rise leads to reduced maximum stomatal conductance in Florida vegetation[J]. Proceedings of the National Academy of Sciences of the United States of America, 2011, 108(10): 4035–4040
[21] Gagen M, Finsinger W, Wagner-Cremer F, et al. Evidence of changing intrinsic water-use efficiency under rising atmospheric CO2concentrations in Boreal Fennoscandia from subfossil leaves and tree ring13C ratios[J]. Global Change Biology, 2011, 17(2): 1064–1072
[22] Boer H J D, Lammertsma E I, Wagner-Cremer F, et al. Climate forcing due to optimization of maximal leaf conductance in subtropical vegetation under rising CO2[J]. Proceedings of the National Academy of Sciences of the United States of America, 2011, 108(10): 4041–4046
[23] Yang X Q, Chen C, Luo Q Y, et al. Climate change effects on wheat yield and water use in oasis cropland[J]. International Journal of Plant Production, 2011, 5(1): 83–94
[24] 房世波, 沈斌, 谭凯炎, 等. 大气[CO2]和温度升高对农作物生理及生产的影响[J]. 中国生态农业学报, 2010, 18(5): 1116–1124 Fang S B, Shen B, Tan K Y, et al. Effect of elevated CO2concentration and increased temperature on physiology and production of crops[J]. Chinese Journal of Eco-Agriculture, 2010, 18(5): 1116–1124
[25] Wand S J E, Midgley G F, Jones M H, et al. Responses of wild C4and C3grass (Poaceae) species to elevated atmospheric CO2concentration: a meta-analytic test of current theories and perceptions[J]. Global Change Biology, 1999, 5(6): 723–741
[26] Morison J I L, Gifford R M. Plant growth and water use with limited water supply in high CO2concentrations. Ⅰ. Leaf area, water use and transpiration[J]. Australian Journal of Plant Physiology, 1984, 11(5): 361–374
[27] Kang S Z, Zhang F C, Hu X T, et al. Benefits of CO2enrichment on crop plants are modified by soil water status[J]. Plant and Soil, 2002, 238(1): 69–77
[28] 于贵瑞, 王秋凤. 植物光合、蒸腾与水分利用的生理生态学[M].北京: 科学出版社, 2010: 112–113 Yu G R, Wang Q F. Ecophysiology of Plant Photosynthesis, Transpiration, and Water Use[M]. Beijing: Science Press, 2010: 112–113
[29] Easterling W E, Rosenberg N J, McKenney M S, et al. Preparing the erosion productivity impact calculator (EPIC) model to simulate crop response to climate change and the direct effects of CO2[J]. Agricultural and Forest Meteorology, 1992, 59(1/2): 17–34
[30] Xu Z W, Liu S M, Li X, et al. Intercomparison of surface energy flux measurement systems used during the HiWATER-MUSOEXE[J]. Journal of Geophysical Research, 2013, 118(23): 13140–13157
[31] Twine T E, Kustas W P, Norman J M, et al. Correcting eddy-covariance flux underestimates over a grassland[J]. Agricultural and Forest Meteorology, 2000, 103(3): 279–300
[32] Brutsaert W. Evaporation into the Atmosphere-Theory, History and Applications[M]. Netherlands: Springer, 1982: 84–86
[33] Brenner A J, Incoll L D. The effect of clumping and stomatal response on evaporation from sparsely vegetated shrublands[J]. Agricultural and Forest Meteorology, 1997, 84(3/4): 187–205
[34] Camillo P J, Gurney R J. A resistance parameter for bare-soil evaporation models[J]. Soil Science, 1986, 141(2): 95–105
[35] Brisson N, Itier B, L’Hotel J C, et al. Parameterisation of the Shuttleworth-Wallace model to estimate daily maximum transpiration for use in crop models[J]. Ecological Modelling, 1998, 107(2/3): 159–169
[36] Anadranistakis M, Liakatas A, Kerkides P, et al. Crop water requirements model tested for crops grown in Greece[J]. Agricultural Water Management, 2000, 45(3): 297–316
[37] Field M. The meteorological office rainfall and evaporation calculation system — MORECS[J]. Agricultural Water Management, 1983, 6(2/3): 297–306
[38] Stewart J B. Modelling surface conductance of pine forest[J]. Agricultural and Forest Meteorology, 1988, 43(1): 19–35
[39] Jarvis P G. The interpretation of the variations in leaf water potential and stomatal conductance found in canopies in the field[J]. Philosophical Transactions of the Royal Society B: Biological Sciences, 1976, 273(927): 593–610
[40] Li S E, Hao X M, Du T S, et al. A coupled surface resistance model to estimate crop evapotranspiration in arid region of northwest China[J]. Hydrological Processes, 2014, 28(4): 2312–2323
[41] Gardiol J M, Serio L A, Della Maggiora A I. Modelling evapotranspiration of corn () under different plant densities[J]. Journal of Hydrology, 2003, 271(1/4): 188–196
Simulation of maize evapotranspiration at different growth stages using revised dual-layered model in arid Northwest China*
WU Lin1,2, MIN Leilei2, SHEN Yanjun2**, ZHOU Xiaoxu2, LIU Fenggui1
(1. College of Biological and Geographical Sciences, Qinghai Normal University, Xining 810000, China; 2. Key Laboratory of Agricultural Water Resources, Center for Agricultural Resources Research, Institute of Genetics and Developmental Biology, Chinese Academy of Sciences, Shijiazhuang 050022, China)
Evapotranspiration (ET) is composed of two separate processes — water loss to the atmosphere from soil surface by evaporation () and water loss to the atmosphere from plant canopy via transpiration (). ET plays a key role in energy and water balance in agricultural system and is also a critical process in terrestrial hydrological cycle. Accurate estimation of ET is significant for improving water use efficiency and optimizing regional water use, particularly in arid and semi-arid regions. Although ET models have been an important tool in understanding the regulation of ET in ecological, agricultural and environmental sciences, the accuracy of the models is limited by aerodynamic and canopy resistance. Numerous models have been developed to integrate aerodynamic and canopy resistances [e.g., Penman-Monteith (P-M) model] in simulating the processes of response of ET, but many studies have suggested that the P-M model could produce large errors under partial or sparse canopy conditions because it treated plant canopy and soil surface as a single entity. Next, the dual-layered Shuttleworth-Wallace (S-W) model was developed to estimate ET under different conditions. In this model, the crop ET is divided into two components — latent heat flux from crop and that from soil. It has been tested by various surface conditions and widely used because of its good performance. In this study (which used maize data of three eddy covariance observations for the period from May through September 2012 in Heihe River Basin, an arid area in Northwestern China), two canopy resistance models coupled for maize. Two S-W models were coupled with canopy resistance models of maize taking or non-taking into account the effect of atmospheric CO2. Then the whole maize growth period was divided into three stages, early, middle and late growth stages. Then maize ET on half hour scale was simulated using the two S-W models. The performances of the two S-W models were validated for three different growth stages using eddy covariance field-measured data. The results showed that simulated maize ET by the S-W model (which took into account the effect of atmospheric CO2at every growth stage of three different places) best agreed with field-measured eddy covariance data. Sensitivity analysis of the revised S-W model (taking into account the effect of atmospheric CO2) showed that maize ET was more sensitive to canopy resistance () and aerodynamic resistance from canopy to reference surface height () at different growth stages. Therefore, it is very necessary to determine resistance parameters at different growth stages taking into account the effect of atmospheric CO2when calculating maize ET using the revised S-W model.
Shuttleworth-Wallace (S-W) model; Evapotranspiration; Atmospheric CO2concentration; Resistance parameter; Maize
S161.4
A
1671-3990(2017)05-0634-13
10.13930/j.cnki.cjea.160839
* 国家自然科学基金项目(91425302, 31400375)资助
**通讯作者:沈彦俊, 主要从事生态水文过程研究。E-mail: yjshen@sjziam.ac.cn
吴林, 主要从事生态水文过程研究。E-mail: wulinmsn@163.com
2016-12-19
2017-02-17
* This study was supported by the National Natural Science Foundation of China (91425302, 31400375).
** Corresponding author, E-mail: yjshen@sjziam.ac.cn
Dec. 19, 2016; accepted Feb. 17, 2017
吴林, 闵雷雷, 沈彦俊, 周晓旭, 刘峰贵. 分时段修正双源模型在西北干旱区玉米蒸散量模拟中的应用[J]. 中国生态农业学报, 2017, 25(5): 634-646
Wu L, Min L L, Shen Y J, Zhou X X, Liu F G. Simulation of maize evapotranspiration at different growth stages using revised dual-layered model in arid Northwest China[J]. Chinese Journal of Eco-Agriculture, 2017, 25(5): 634-646
