2001—2010年中国农田生态系统NPP的时空演变特征*
2017-04-19王轶虹史学正王美艳赵永存
王轶虹史学正†王美艳赵永存
(1 土壤与农业可持续发展国家重点实验室(中国科学院南京土壤研究所),南京 210008)
(2 中国科学院大学,北京 100049)
2001—2010年中国农田生态系统NPP的时空演变特征*
王轶虹1,2史学正1,2†王美艳1,2赵永存1,2
(1 土壤与农业可持续发展国家重点实验室(中国科学院南京土壤研究所),南京 210008)
(2 中国科学院大学,北京 100049)
植被净初级生产力(Net Primary Productivity,NPP)是地表碳循环的重要组成部分,而农业NPP代表了农田生态系统通过光合作用可固定大气中CO2的能力,决定了农田土壤可获得的有机碳含量。测算中国农田生态系统产生的NPP并分析其时空变异规律,探索其影响因子,对于了解全球碳循环,预测未来生态变化趋势具有重要意义。基于MOD17A3数据集,利用一元线性回归趋势线法和相关系数法定量分析了农田生态系统NPP的时空演变特征和气候因子对农田NPP的影响。结果表明,2001—2010年中国农田NPP平均值变化范围为C 0.21~17.24 Mg hm-2a-1,平均值为4.12 Mg hm-2a-1。从时间变化来看,NPP年际变化呈现先增加后下降的趋势。从空间分布来看,表现为南方高,北方低,其中,甘新区、黄土高原区、东北区、内蒙古及长城沿线区和黄淮海区北部NPP值较低,<3 Mg hm-2a-1;四川盆地、山东丘陵、长江中下游滨海和沿江平原、云南、贵州、海南等地NPP值较高,>5 Mghm-2a-1。从变化趋势来看,黄淮海农业区、黄土高原区、新疆的绿洲农业区和长江中下游农业区南部上升趋势明显,东北农业区、四川盆地和长江中下游农业区下降趋势明显。2001—2010年,中国农田中有22%的像元NPP平均值与降水呈显著相关,7%的像元与气温呈显著相关,反映了农田生态系统受人类活动影响较大。
农作物;MOD17A3数据;植物净初级生产力(NPP);空间变化;气候因子;中国
植被净初级生产力(Net Primary Productivity,NPP)指绿色植物在单位时间和面积上所能累积的有机干物质的量,包括植物的枝、叶和根等生产量及植物枯落部分的数量[1]。NPP不仅反映了植被群落在自然环境条件下的生产能力,表征陆地生态系统的质量状况,而且是调节生态过程和估算陆地碳“源/汇”的重要因子[2-3],是生态系统碳循环的重要组成部分。农业植被净初级生产力代表了农田生态系统通过光合作用可固定大气中CO2的能力,决定了农田土壤可获得的有机碳含量,农田生态系统的碳循环具有固碳周期短、蓄积量大的特点,是全球碳库中最活跃的部分[4],因此农田碳库的大小及其在全球碳平衡中的作用受到更多的关注[5-6]。中国国土幅员辽阔、气候多变、地域类型复杂,农业类型多样,使中国农田生态系统成为影响气候变化最敏感的领域之一,中国农业碳库的大小及其变化对于国家乃至世界粮食安全和全球碳平衡均具有重要的影响[7-10]。因此研究中国农田生态系统NPP时空变化一方面有助于了解中国农田生态系统碳“源/汇”的时空格局,另一方面对于研究中国在全球碳循环中的作用,预测未来气候变化趋势具有重要意义。
MOD17A3 NPP是基于MODIS/TERRA 卫星遥感参数,通过BIOME-BGC模型计算出全球陆地植被净初级生产力(NPP)[11]。利用MOD17A3 NPP数据研究农田生产力的时空特征及影响因素已经得到广泛应用和验证[12-14]。但迄今为止,利用MOD17A3 NPP分析中国范围内农田生产力时空特征及气候因子对农田生产力影响的研究还未见报道。本文利用2001—2010年的MOD17A3 NPP数据,结合GIS空间分析技术,研究2001—2010中国农田生产力的时空分异特征,并分析了气候因子对农田生产力的影响,结果可为准确估算中国农田碳储量提供数据支撑。
1 材料与方法
1.1 数据来源与处理
2001—2010年MOD17A3 NPP数据来自美国NASA网站(https://ladsweb.nascom.nasa.gov/data/ search.html),空间分辨率为1km×1km。利用MRT( ModisReprojection Tool)软件对下载的NPP数据进行投影、拼接处理,为保证与其他数据的匹配精度,所有数据均采用Albers等积圆锥投影,空间分辨率为1km。
气象数据由中国气象数据网(http://data.cma. gov.cn/)提供,包括年平均气温和年降水量数据。2001—2010年701个气象站点数据在ArcMap10.2中采用普通克里格插值方法[15-16]进行插值,生成250m×250m的栅格数据,与中国国界图叠加裁剪得到2001—2010年中国年均气温和年降水量分布图。
中国2010年的土地利用/覆盖数据来自于中国科学院碳专项“生态系统固碳现状、速率、机制和潜力”项目“陆地生态系统固碳参量遥感监测及估算技术研究”课题组[17],从2010年全国土地利用图中提取出各省级行政单位的农田(旱地和水田)空间分布图后,拼接为全国农田分布图的矢量格式,再将矢量数据转换为250 m×250 m的中国农田分布图的栅格数据。最后将其与2001—2010年MODIS17A3 NPP数据和气象要素分布图叠加,提取中国农田的NPP和气象数据。
1.2 NPP变化趋势分析
每个像元NPP年际变化趋势分析采用一元线性回归趋势线法,回归直线的斜率采用最小二乘法求得[18-19]。

式中,n为每个像元存在有效NPP数据的年份个数,n=10;Y为每个像元的NPP数据;θslope表示趋势线的斜率,θslope>0说明NPP在10年间的变化趋势是增加的,反之减少。
1.3 NPP与气候因子相关性分析
基于每个像元的NPP与气候因子的相关系数计算公式[20]

式中,变量i为年序号,n=10或n取值为10,Yij为第i年第j个像元的NPP数据,Cij为第i年第j个像元的气象因子数据,RYCj为第j个像元NPP与气候因子的相关系数。
采用的分析软件有Excel 2007和SPSS13.0,图件用Origin 8.0 和ArcMap 10.2完成。
2 结果与讨论
2.1 中国农田生态系统NPP时间变化特征
通过对中国农田生态系统的年均NPP值统计结果表明,2001—2010年中国农田NPP变化范围为C 3.74~4.35 Mg hm-2a-1,平均值为4.12 Mg hm-2a-1,最大值出现在2004年,达到4.35 Mg hm-2a-1,最小值出现在2001年,为3.74 Mg hm-2a-1。从时间分布来看,2001—2010年,NPP年均值的变化可分为两个阶段,2001—2004年呈增加趋势,2005—2010年呈下降趋势。国家尺度农业生产力水平可能与气候变化因素有关。2001—2010年全国平均气温和降水量呈先减小后增加的变化趋势,尤其是2004年以后,气温上升趋势明显;日照时数下降趋势明显,全国农业生产力的整体变化与气候变化有关。
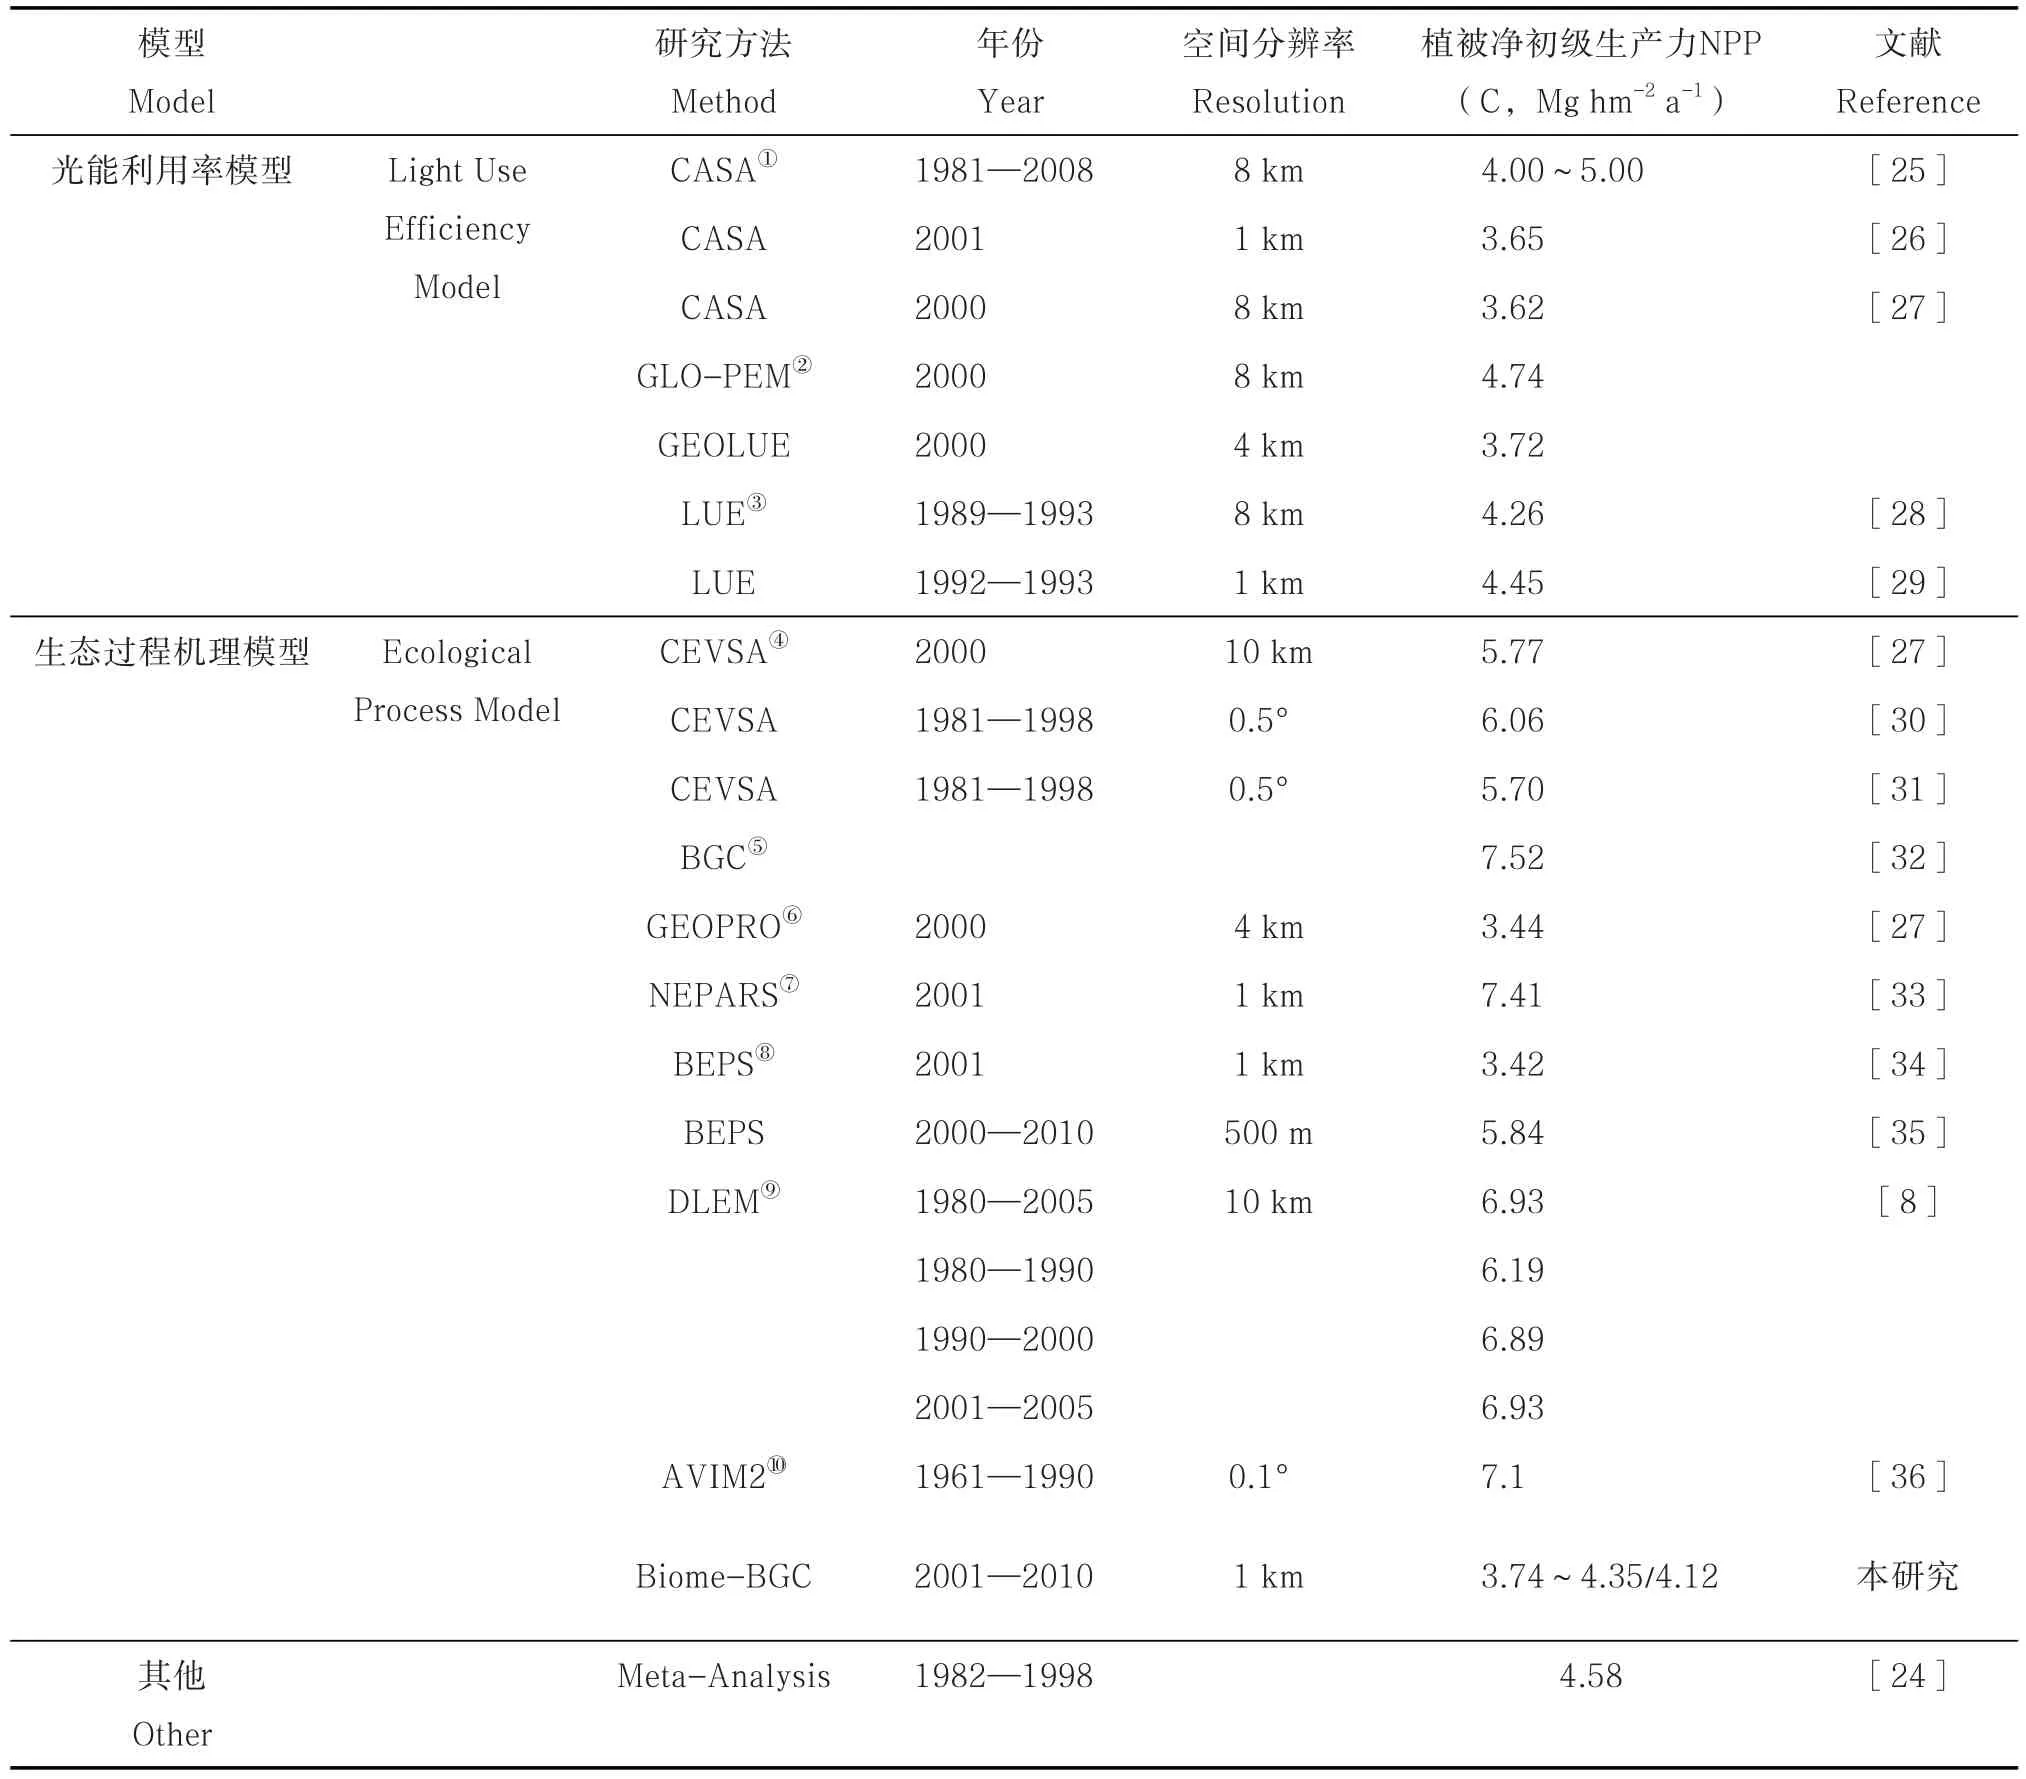
近年来,许多研究者利用遥感驱动的光能利用率模型或者生态机理模型模拟了中国农作物的NPP(表1)。从NPP平均值来看,不同类型模型之间研究结果差异较大,即使是同类模型之间研究结果亦相差较大。利用光能利用率模型得到农作物NPP的变化范围为C 3.62~8.91Mg hm-2a-1,平均值为4.07 Mg hm-2a-1,最大值为最小值的2.5倍,平均值与本研究结果接近。利用生态过程机理模型得到农作物NPP的变化范围为C 3.42~7.521 Mg hm-2a-1,平均值为5.95 Mg hm-2a-1,最大值为最小值的2倍,平均值较本研究结果高出44%。不同模型模拟结果的差异,可能与不同模型之间数据源、使用参数等有关[21-22]。本研究结果低于多数生态过程机理模型模拟结果,可能与MODIS 17A3在计算过程中使用的叶面积指数(LAI)有关,有研究表明,叶面积指数很容易在MODIS 17中被低估[8-23]。还有学者用其他研究方法研究了中国农作物的NPP值,本研究结果与高艳妮等[24]采用整
合分析(Meta-analysis)得到的结果亦较相近。

表1 不同研究者估算农作物NPP结果Table 1 Estimation of farmland NPP relative to scholar
2.2 中国农田生态系统NPP的空间分布特征
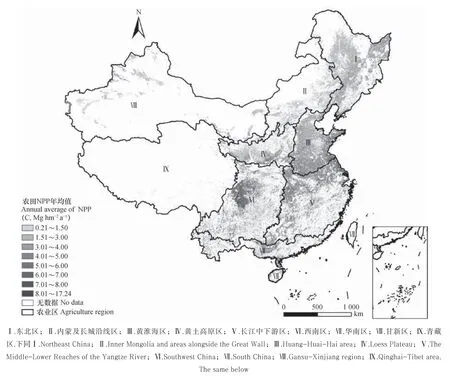
2001—2010年中国农田每个像元的NPP变化范围为0.21~17.24 Mg hm-2a-1,且农作物NPP的分布呈现明显的空间分异特征(图1)。整体来看,北方地区农田NPP较低,NPP值一般小于4 Mg hm-2a-1;南方地区相对较高,NPP值一般大于5 Mg hm-2a-1。经统计,全国范围内有30%的像元农作物NPP值<3 Mg hm-2a-1,主要分布在甘新区、黄土高原区、东北区、内蒙古及长城沿线区和黄淮海区北部,其中,最小值出现在内蒙古及长城沿线区(0.21 Mg hm-2a-1)。有28%的像元农作物NPP值>5 Mg hm-2a-1,主要分布在四川盆地、山东丘陵、长江中下游滨海平原、云南、贵州、海南等地,其中,最大值出现在西南区(17.24 Mg hm-2a-1)。全国范围内有84%的像元农作物NPP值变化范围为1.50~6.00 Mg hm-2a-1。
闫慧敏等[37]应用基于NOAA/AVHRR卫星遥感数据的GLO-PEM模型,研究了1981—2000年中国农田生产力变化的空间格局。王彧等[38]采用Crop-C模型估算了中国1980—2000农业植被净初级生产力。与以往研究结果相比,本研究基于BIOME-BGC模型得到的中国农田NPP空间分布格局整体结果一致,均表现为西北低,东南高的分布特征,但局部存在差异。与闫慧敏等的研究结果相比,本研究获得的四川盆地NPP值较高(5.0~6.0 Mg hm-2a-1);东北地区NPP值较低(1.5~3.0 Mg hm-2a-1C)。与王彧等的研究结果相比,本研究获得的四川盆地NPP值较高(5.0~6.0 Mg hm-2a-1C),黄淮海地区NPP值较低(3.0~5.0 Mg hm-2a-1)。几种研究结果的差异,一方面可能是由不同模型之间模拟结果的差异引起的[21-22],另一方面可能是由不同年代的数据导致的,本研究时段为2001—2010年,而闫慧敏等和王彧等研究时段为1981—2000和1980—2000年,具体差异需进一步探索。

图1 2001—2010年中国农田NPP年均值空间分布Fig. 1 Spatial distribution of the annual mean farmland NPP in China during the years from 2001 to 2010 based on MOD17A3
对中国2001—2010年年均NPP值逐象元进行变化趋势分析(图4)。统计发现,55%的像元NPP呈增加趋势,67%的像元NPP年际变化范围为-0.05~0.05Mg hm-2a-1。黄淮海农业区、黄土高原区、新疆的绿洲农业区和长江中下游农业区南部上升趋势明显,东北农业区、四川盆地和长江中下游农业区下降趋势明显。黄土高原区和新疆绿洲农业区自然条件恶劣、农业基础薄弱,随着经济发展,农业生产条件不断改善,农业生产力逐渐提高。东北农业区作为重要的粮食基地,粮食产量一直很高,但是在黑土区土壤资源的利用过程中,存在着黑土肥力退化、水土流失、土壤盐渍化、旱涝灾害、土壤沙化、土壤酸化等一系列影响黑土区土壤质量、土地生产力发挥和黑土资源持续利用等方面的问题,对东北粮食安全生产构成威胁[39]。黄淮海农业区因自然条件优越,农耕历史悠久,农业生产力一直很高。四川盆地以坡耕地为主,欧胜[40]研究表明90%以上川中丘陵区坡耕地出现不同程度的土壤侵蚀,四川盆地生产力下降可能与该区水土流失有关。长江中下游农业区经济发展迅速,区内土地利用变化剧烈,大量耕地被工业和商业用地占用,韩宗祎[41]、赵其国等[42]研究表明2002—2010年间长江中下游地区农田面积减少了5737 km2,农业生产力受到影响。

图2 2001—2010年中国农田NPP年均值年际变化趋势Fig. 2 Spatial variation of the annual mean farmland NPP in China during the years from 2001 to 2010
进一步通过对比图1和图2,发现2001—2010年农田NPP值的空间分布和变化趋势有差异,黄土高原农业区和新疆的绿洲农业区农田NPP年均值较低的地区,NPP增加趋势明显;四川盆地和长江中下游的中南部农田NPP年均值较高的地区,NPP呈现减少趋势;东北区农田NPP值较低,且表现为明显的下降趋势;黄淮海农业区中南部NPP值较高,NPP增加趋势亦明显。农田NPP的变化趋势能够反映输入到农田中有机物质的变化情况。黄耀和孙文娟[43]研究结果表明从1993—2006年,近20年来中国华东和华北地区农田土壤SOC含量增加明显,西北灌区农田土壤SOC含量表现为总体上升趋势,东北地区呈下降趋势,这与本研究中农田年均NPP变化趋势相一致。农田土壤中SOC的主要来源之一是农作物输入到土壤中的有机质,1993—2006年,中国农田土壤SOC含量的变化可能与输入到农田有机质量的变化有关。
2.3 气候因子对农田NPP的影响
农田生产力的时空变化特征是受各种自然因素(太阳辐射、气温、降水、地形以及土壤类型)和各种人为因素(耕作制度、种植结构、施肥特征)以及作物自身特征等共同影响的结果。Nemani等[44]认为我国长江以南地区由于年降水量大,农田NPP主要受制于太阳辐射,长江以北以及西北地区,农田NPP主要受制于水分条件。为了说明气候因子对我国农田生态系统的影响,通过最小二乘法逐像元计算农田2001—2010年NPP均值与10年降水量均值的线性相关性,生成相关系数空间分布图(图3)。结果表明,有78%的农田NPP值与10年降水量均值呈现不显著相关关系,其中60%的呈现不显著正相关关系。有20%的农田NPP值与10年降水量均值呈现显著正相关关系,其中只有7%的像元呈现极显著正相关关系。与降水有显著正相关关系的区域主要分布在东北的松嫩平原、甘新农业区和内蒙古及长城沿线区、黄淮海区。通过相同方法逐像元计算农田2001—2010年NPP均值与10年气温均值线性相关系数(图4)。统计表明,有93%像元的农田NPP值与10年气温均值呈现不显著相关关系,其中50%的像元呈现不显著正相关关系。农田NPP值与气温呈不显著负相关的区域主要分布在东北农业区。东北农业区处于温带湿润、半湿润季风气候区,除辽南外,均是一年一熟,生长季平均温度满足了作物生长阶段的温度要求,但在成熟期,其温度超过了其生长的最适宜温度,生长季平均降水没有超过最适宜湿度,因此生长季平均NPP与降水呈现正相关关系,与温度呈现负相关关系[14,45-46]。内蒙古及长城沿线区大部分处于半干旱地带,缺少灌溉水源。黄淮海区以旱地为主,常发生春旱;甘新区光能资源丰富,晴天多,辐射强,热量条件好,昼夜温差大,有利于物质积累,由于年降水量较小,限制了农业发展,农田主要分布在有冰雪融水补给的山麓地带,因此在这些地区NPP值与降水量有显著正相关关系。

图3 2001—2010年中国农田NPP平均值与降水相关系数分布Fig. 3 Correlation relationship between average farmland NPP and precipitation in China during the years from 2001 to 2010

图4 2001—2010年中国农田NPP平均值与气温相关系数分布Fig. 4 Correlation relationship between average farmland NPP and temperature in China during the years from 2001 to 2010
中国农田生态系统NPP值与气温降水虽然有一定的相关关系,但是大部分区域不显著,反映了农田生态系统受人类活动的影响较大,与森林和草地生态系统相比,农田生态系统受耕作方式、种植制度和管理方式(如农药化肥的使用)的影响更大,这降低了气候环境因子对农田生物量的影响程度,所以大部分区域未表现出显著相关关系。
3 结 论
2001—2010年中国农田NPP平均值为4.12 Mg hm-2a-1。NPP年际变化呈现先增加后减小的的变化趋势。农田NPP的时空分布呈现南高北低的特征。甘新区、黄土高原区、东北区、内蒙古及长城沿线区和黄淮海区的北部NPP值较低,四川盆地、山东丘陵、长江中下游滨海和沿江平原、云南、贵州、海南等地NPP值较高。2001—2010年,黄淮海农业区、黄土高原区、新疆的绿洲农业区和长江中下游农业区南部上升趋势明显,东北农业区、四川盆地和长江中下游农业区下降趋势明显。全国范围内有22%的像元农田NPP平均值与降水有显著相关关系,主要分布在东北的松嫩平原、甘新农业区和内蒙古及长城沿线区、黄淮海区;有7%的像元与气温有显著相关关系,说明农田生态系统受气候影响较小,受人类活动的影响较大,在今后对农田生态系统的影响因素研究中应加强人为因素的量化。
[1]Field C B,Behrenfeld M J,Randerson J T,et al. Primary production of the biosphere:Integrating terrestrial and oceanic components. Science,1998,281(5374):237—240
[2]Cao M K,Woodward F I. Net primary and ecosystem production and carbon stocks of terrestrial ecosystems and their responses to climate change. Global Change Biology,1998,4(2):185—198
[3]Koffi E N,Rayner P J,Scholze M,et al. Atmospheric constraints on gross primary productivity and net ecosystem productivity:Results from a carbon-cycle data assimilation system. Global Biogeochemical Cycles,2012,26(1):104—105
[4]Houghton R A,Hackler J L. Sources and sinks of carbon from land-use change in China. Global Biogeochemical Cycles,2003,17(2):3—1
[5]Pan G X,Xu X W,Smith P,et al. An increase in topsoil Soc stock of China’s croplands between 1985 and 2006 revealed by soil monitoring. Agriculture Ecosystems & Environment,2010,136(1/2):133—138
[6]Sperow M,Eve M,Paustian K. Potential soil C sequestration on US agricultural soils. Climatic Change,2003,57(3):319—339
[7]Huang Y,Yu Y,Zhang W,et al. Agro-C:A biogeophysical model for simulating the carbon budget of agroecosystems. Agricultural and Forest Meteorology,2009,149(1):106—129
[8]Ren W,Tian H,Tao B,et al. China’s crop productivity and soil carbon storage as influenced by multifactor global change. Global Change Biology,2012,18(9):2945—2957
[9]Xie Z,Liu G,Bei Q,et al. CO2mitigation potential in farmland of China by altering current organic matter amendment pattern. Science China-Earth Sciences,2010,53(9):1351—1357
[10]潘根兴,周萍,李恋卿,等. 固碳土壤学的核心科学问题与研究进展. 土壤学报,2007,44(2):327—337
Pan G X,Zhou P,Li L Q,et al. Core issues and research progresses of soil science of C sequestration(In Chinese). Acta Pedologica Sinica,2007,44(2):327—337
[11]Turner D P,Ritts W D,Cohen W B,et al. Evaluation of MODIS NPP and GPP products across multiple biomes. Remote Sensing of Environment,2006,102 (3):282—292
[12]国志兴,王宗明,刘殿伟,等. 基于MOD17A3数据集的三江平原低产农田影响因素分析. 农业工程学报,2009,25(2):152—155
Guo Z X,Wang Z M,Liu D W,et al. Analysis of the influence factors of low-yield cropland in the Sanjiang Plain based on MOD17A3 dataset(In Chinese). Transactions of the Chinese Society of Agricultural Engineering,2009,25(2):152—155
[13]位贺杰,张艳芳,朱妮,等. 河南农田生产力时空变化的遥感分析. 测绘科学,2014,39(11):67—71
Wei H J,Zhang Y F,Zhu N,et al. Temporal-spatial changes of farmland productivity in Henan Province using MODIS data(In Chinese). Science of Surveying and Mapping,2014,39(11):67—71
[14]朱锋,刘志明,王宗明,等. 东北地区农田净初级生产力时空特征及其影响因素分析. 资源科学,2010,32 (11):2079—2084
Zhu F,Liu Z M,Wang Z M,et al. Temporal-spatial characteristics and factors influencing crop NPP across northeastern China(In Chinese). Resources Science,2010,32(11):2079—2084
[15]林忠辉,莫兴国,李宏轩,等. 中国陆地区域气象要素的空间插值. 地理学报,2002,57(1):47—56
Lin Z H,Mo X G,Li H X,et al. Comparison of three spatial interpolation methods for climate variables in China(In Chinese). Acta Geographica Sinica,2002,57(1):47—56
[16]曾红伟,李丽娟,张永萱,等.大样本降水空间插值研究——以2009 年中国年降水为例. 地理科学进展,2011,30(7):811—818
Zeng H W,Li L J,Zhang Y X,et al. Study on spatial interpolation of precipitation with large scale samples:A case study on 2009,s precipitation of China(In Chinese). Progress in Geography,2011,30(7):811—818
[17]吴炳方,苑全治,颜长珍,等. 21世纪前十年的中国土地覆盖变化. 第四纪研究,2014,34(4):723—731
Wu B F,Yuan Q Z,Yan C Z,et al. Land cover changes of China from 2000 to 2010(In Chinese). Quaternary Sciences,2014,34(4):723—731
[18]李燕丽,潘贤章,王昌昆,等. 2000—2011年广西植被净初级生产力时空分布特征及其驱动因素. 生态学报,2014,34(18):5220—5228
Li Y L,Pan X Z,Wang C K,et al. Changes of vegetation net primary productivity and its driving factors from 2000 to 2011 in Guangxi,China(InChinese). Acta Ecologica Sinica,2014,34(18):5220—5228
[19]穆少杰,李建龙,周伟,等. 2001—2010年内蒙古植被净初级生产力的时空格局及其与气候的关系. 生态学报,2013,33(12):3752—3764
Mu S J,Li J L,Zhou W,et al. Spatial-temporal distribution of net primary productivity and its relationship with climate factors in Inner Mongolia from 2001 to 2010(In Chinese). Acta Ecologica Sinica,2013,33(12):3752—3764
[20]龙慧灵,李晓兵,王宏,等. 内蒙古草原区植被净初级生产力及其与气候的关系. 生态学报,2010,30 (5):1367—1378
Long H L,Li X B,Wang H,et al. Net primary productivity(NPP)of grassland ecosystem and its relationship with climate in Inner Mongolia(In Chinese). Acta Ecologica Sinica,2010,30(5):1367—1378
[21]范建忠,李登科,周辉. Glopem与Mod17a3 NPP的比较. 陕西气象,2013(1):21—25
Fan J Z,Li D K,Zhou H. Comparative analysis between Glopem and Mod17a3 of NPP(In Chinese). Journal of Shaanxi Meteorology,2013(1):21—25
[22]王新闯,王世东,张合兵. 基于Mod17a3的河南省NPP时空格局. 生态学杂志,2013,32(10):2797—2805
Wang X C,Wang S D,Zhang H B. Spatio-temporal pattern of vegetation net primary productivity in Henan Province of China based on Mod17a3(In Chinese). Chinese Journal of Ecology,2013,32(10):2797—2805
[23]Zhang Y,Yu Q,Jiang J,et al. Calibration of terra/ modis gross primary production over an irrigated cropland on the north China Plain and an alpine meadow on the Tibetan Plateau. Global Change Biology,2008,14(4):757—767
[24]高艳妮,于贵瑞,张黎,等. 中国陆地生态系统净初级生产力变化特征——基于过程模型和遥感模型的评估结果. 地理科学进展,2012,31(1):109—117
Gao Y N,Yu G R,Zhang L,et al. The changes of net primary productivity in Chinese terrestrial ecosystem:Based on process and parameter models(In Chinese). Progress in Geography,2012,31(1):109—117
[25]陈福军,沈彦俊,李倩,等. 中国陆地生态系统近30 年NPP时空变化研究. 地理科学,2011,31(11):1409—1414
Chen F J,Shen Y J,Li Q,et al. Spatio-temporal variation analysis of ecological systems NPP in China in past 30 years(In Chinese). Scientia Geographica Sinica,2011,31(11):1409—1414
[26]李贵才. 基于modis数据和光能利用率模型的中国陆地净初级生产力估算研究.北京:中国科学院遥感应用研究所,2004
Li G C. Estimation of Chinese terrestrialnet primary production using LUE Model and MODIS data(In Chinese).Beijing:Institute of Remote Sensing and Digital Earth,Chinese Academy of Sciences,2004
[27]高志强,刘纪远. 中国植被净生产力的比较研究. 科学通报,2008,53(3):317—326
Gao Z Q,Liu J Y. Comparative analysis for net primary productivity of Chinese terrestrial vegetation (In Chinese). Chinese Science Bulletin,2008,53 (3):317—326
[28]朱文泉,潘耀忠,张锦水. 中国陆地植被净初级生产力遥感估算. 植物生态学报,2007,31(3):413—424
Zhu W Q,Pan Y Z,Zhang J S. Estimation of net primary productivity of Chinese terrestrial vegetation based on remote sensing(In Chinese). Acta Phytoecologica Sinica,2007,31(3):413—424
[29]孙睿,朱启疆. 中国陆地植被净第一性生产力及季节变化研究. 地理学报,2000,55(1):36—45
Sun R,Zhu Q J. Distribution and seasonal change of net primary productivity in China from April,1992 to March,1993(In Chinese). Acta Geographica Sinica,2000,55(1):36—45
[30]陶波,李克让,邵雪梅,等. 中国陆地净初级生产力时空特征模拟. 地理学报,2003,58(3):372—380
Tao B,Li K R,Shao X M,et al. Temporal and spatial pattern of net primary production of terrestrial ecosystems in China(In Chinese). Acta Geographica Sinica,2003,58(3):372—380
[31]李克让,王绍强,曹明奎. 中国植被和土壤碳储量. 中国科学(D辑:地球科学),2003,33(1):72—80
Li K R,Wang S Q,Cao M K. Carbon storage of the vegetation ecosystem in China(In Chinese). Science in China(Series D:Earth Science),2003,33 (1):72—80
[32]刘明亮. 中国土地利用/土地覆盖变化与陆地生态系统植被碳库和生产力研究. 北京:中国科学院遥感应用研究所,2001
Liu M L. Storages of soil organic carbon and nitrogen and land use changes in China(In Chinese). Beijing:Institute of Remote Sensing and Digital Earth,Chinese Academy of Sciences,2001
[33]王军邦. 中国陆地净生态系统生产力遥感模型研究.杭州:浙江大学,2004
Wang J B. Chinese terrestrial net ecosystem productive model applied remote sensing data(In Chinese).Hangzhou:Zhejiang University,2004
[34]Feng X,Liu G,Chen J M,et al. Net primary productivity of China’s terrestrial ecosystems from a process model driven by remote sensing. Journal of Environmental Management,2007,85(3):563—573
[35]柳艺博. 基于遥感和过程模型的中国陆地生态系统水分利用效率时空变化特征研究,南京:南京大学,2013
Liu Y B. Characteristics of terrestrial ecosystem primary productivity in China based on remote sensing and process-based model(In Chinese). Nanjing:Nanjing University,2013
[36]黄玫,季劲钧,曹明奎,等. 中国区域植被地上与地下生物量模拟. 生态学报,2006,26(12):4156—4163
Huang M,Ji J J,Cao M K,et al. Modeling study of vegetation shoot and root biomass in China(In Chinese). Acta Ecologica Sinica,2006,26(12):4156—4163
[37]闫慧敏,刘纪远,曹明奎. 中国农田生产力变化的空间格局及地形控制作用. 地理学报,2007,62(2):171—180
Yan H M,Liu J Y,Cao M K. Spatial pattern and topographic control of China’s agricultural productivity variability(In Chinese). Acta Geographica Sinica,2007,62(2):171—180
[38]王彧,黄耀,张稳,等. 中国农业植被净初级生产力模拟(ⅱ)——模型的验证与净初级生产力估算. 自然资源学报,2006,21(6):916—925
Wang Y,Huang Y,Zhang W,et al. Simulating net primary production of agricultural vegetation in China(ⅱ):Model validation and estimation of net primary production(In Chinese). Journal of Natural Resources,2006,21(6):916—925
[39]魏丹,杨谦,迟凤琴. 东北黑土区土壤资源现状与存在问题. 黑龙江农业科学,2006(6):69—72
Wei D,Yang Q,Chi F Q. The soil resource conditions and the problems in northeast black soil regions(In Chinese). Heilong jiang Agricultural Sciences,2006 (6):69—72
[40]欧胜. 川中丘陵区坡耕地土壤侵蚀及治理对策研究,四川雅安:四川农业大学,2010
Ou S. Study on erosion and its controlling strategies in slope farming land in central Sichuan hilly area(In Chinese). Ya’an,Sichuan:Sichuan Agricultural University,2010
[41]韩宗祎. 基于MODIS数据的长江中下游流域景观格局变化研究,武汉:华中农业大学,2012
Han Z W. Study on the landscape pattern change in the Middle and Lower reaches of Yangtze River basin based on MODIS data(In Chinese). Wuhan:Huazhong Agricultural University,2012
[42]赵其国,周生路,吴绍华,等. 中国耕地资源变化及其可持续利用与保护对策. 土壤学报,2006,43(4):662—672
Zhao Q G,Zhou S L,Wu S H,et al. Cultivated land resources and strategies for its sustainable utilization and protection in China(In Chinese). Acta Pedologica Sinica,2006,43(4):662—672
[43]黄耀,孙文娟. 近20年来中国大陆农田表土有机碳含量的变化趋势. 科学通报,2006,51(7):750—763
Huang Y,Sun W J. Changes in topsoil organic carbon of China’s cropland in recent 20 years(In Chinese). Chinese Science Bulletin,2006,51(7):750—763
[44]Nemani R R,Keeling C D,Hashimoto H,et al. Climate-driven increases in global terrestrial net primary production from 1982 to 1999. Science,2003,300 (5625):1560—1563
[45]国志兴,王宗明,刘殿伟,等. 三江平原农田生产力时空特征分析. 农业工程学报,2009,25(1):249—254
Guo Z X,Wang Z M,Liu D W,et al. Analysis of temporal and spatial features of farmland productivity in the Sanjiang Plain(In Chinese). Transactions of the Chinese Society of Agricultural Engineering,2009,25 (1):249—254
[46]罗玲,王宗明,宋开山,等. 2000—2006年松嫩平原农田生产力时空特征与影响因素研究. 农业系统科学与综合研究,2010,26(4):468—474
Luo L,Wang Z M,Song K S,et al. Research on farmland productivity about spatial-temporal features and influential factors in Songnen Plain from 2000 to 2006 (In Chinese). System Sciences and Comprehensive Studies in Agriculture,2010,26(4):468—474
Spatio-temporal Variation of NPP in Cropland Ecosystem of China during the Years From 2001 to 2010
WANG Yihong1,2SHI Xuezheng1,2†WANG Meiyan1,2ZHAO Yongcun1,2
(1 State Key Laboratory of Soil and Sustainable Agriculture,Institute of Soil Science,Chinese Academy of Sciences,Nanjing 210008,China)
(2 University of Chinese Academy of Sciences,Beijing 100049,China)
【Objective】Net primary productivity(NPP)of vegetation is an important part of the land surface carbon cycle and is closely related to the processes of carbon recycling and global climate change. NPP of agricultural vegetation represents capacity of the agroecosystem fixing CO2from the atmosphere via photosynthesis,and determines how much organic carbon the agricultural soil can sequestrate. Agricultural soil is a huge carbon(C)pool. An accurate estimation of how much carbon can be turned into organic matter may help better understand the mechanism of carbon recycling in farmland soil,predict which way carbon tends to go in recycling and manage carbon recycling in farmland soil. China is a country vast in territory,changeable in climate,complex in type of regions,and diverse in agricultural pattern,making the farmland ecosystems,one of the sectors the most sensitive to global climate change. Size and variation of the agricultural carbon pool is very important to both the world’s food safety and global carbon balance. It is,therefore,of important significance to understanding of the role of China in global carbon recycling and prediction of future trend of the global climate change,to accurately estimate NPP of the farmland ecosystem of China,analyze its spatio-temporal variation rules and explore for its affecting factors【Method】In this study,based on the annual net primary productivity(NPP)data cited from the MOD17A3 dataset,characteristics of the spatial-temporal variation of NPP of the farmland in China and impacts of climatic factors on farmland NPP were analyzed quantitatively with the single factor linear regression trendline method and correlation coefficient method. 【Result】Results show that during the years from 2001 to 2010,the annual NPPs averaged to be C 4.12Mg hm-2a-1,ranging from 0.21 to 17.24 Mg hm-2a-1.Within this period of time,annual NPP rose first and then declined,and within the territory of China,the Gansu-Xinjiang Region,the Loess Plateau Region,Northeast China,Inner Mongolia,areas alongside the Great Wall and northern part of the Huang-Huai-Hai Region were quite low in NPP,and even lower than 3 Mg hm-2a-1,whereas the Sichuan Basin,Shandong Hilly Region,the coastal areas of East China and areas alongside the Middle-Lower Reaches of the Yangtze River,Yunnan,Guizhou and Hainan were quite high,and even going beyond 5 Mg hm-2a-1. In about 55% of the pixels NPP displayed a rising trend,especially in the pixels representing the Huang-Huai-Hai Agricultural Region,the Loess Plateau Region,oasis agricultural areas in Xinjiang,and the south part of the agricultural region of the Middle-Lower Reaches of the Yangtze River. But NPP in Northeast China agricultural zones,Sichuan Basin and most part of the agricultural region of the Middle-Lower Reaches of the Yangtze River displayed reversely. In order to assess the impact of climate factors on crop NPP in China,we analyzed relationships between average NPP and mean temperature and precipitation during the years of 2001—2010. It was found that average NPP was significantly related to precipitation in about 22% of the pixels of the farmland of China,and with temperature in about 7% of the pixels,which indicates that the agroecosystem of China is greatly affected by human activities such as tillage and farmingpattern,cropping system and field management.【Conclusion】 Farmland NPP of China varied sharply in space. It was relatively low in the north and quite high in the south,but displayed a rising trend in most parts of the country. However,its spatial distribution did not tally with its variation trend. In areas that used to be low in NPP,a rising trend was observed with NPP,and vice versa. The agroecosystem of China was less affected by climatic factors than by human activities. It is,therefore,advisable to pay more attention to quantification of the factors of human activities in future studies on influential factors of the agroecosystem.
Crop;MOD17A3;Net Primary Productivity(NPP);Spatial variability;Climate;China
S181
A
10.11766/trxb201604220153
(责任编辑:檀满枝)
* 中国科学院战略性先导科技专项(XDA05050509)和国家自然科学基金项目(41401240)资助 Supported by the Strategic Priority Research Program of the Chinese Academy of Sciences(No. XDA05050509)and the National Natural Science Foundation of China(No. 41401240)
† 通讯作者 Corresponding author,E-mail:xzshi@issas.ac.cn
王轶虹(1984—),女,河北高邑人,博士研究生,主要从事农田土壤碳循环研究。E-mail:yhwang@issas. ac.cn
2016-04-22;
2016-12-23; 优先数字出版日期(www.cnki.net):2016-12-29
