带状套作复光后不同大豆品种干物质积累模型与特征分析*
2017-04-08吴雨珊龚万灼杨文钰雍太文刘卫国武晓玲
吴雨珊, 龚万灼, 杨文钰**, 雍太文, 杨 峰, 刘卫国, 武晓玲
带状套作复光后不同大豆品种干物质积累模型与特征分析*
吴雨珊1, 龚万灼2, 杨文钰1**, 雍太文1, 杨 峰1, 刘卫国1, 武晓玲1
(1. 四川农业大学农学院/农业部西南作物生理生态与耕作重点实验室/四川省作物带状复合种植工程技术研究中心成都 611130; 2.重庆市农业科学院特色作物研究所 永川 402160)
为了研究套作下高产类型大豆复光后的干物质积累特征, 本研究共采用14个高、中、低产量水平的大豆为材料, 比较了不同大豆产量类型品种与玉米套作, 复光后的干物质积累特征差异。结果表明: 1)高产类型大豆复光后干物质积累量为32.99 g∙plant-1, 较中、低产类型分别高26.82%和91.51%(两年均值)。2)不同产量类型大豆复光后干物质积累速率均呈先增加后下降的趋势, 复光后最大干物质积累速率和平均干物质积累速率呈高产类型>中产类型>低产类型, 高产类型大豆最大干物重积累速率的时间大致在复光后41~42 d, 中低产类型则在复光后33~37 d; 高产类型大豆复光后干物质渐增期天数、积累速率和干物质积累量以及快增期和缓增期的积累速率和积累量均显著高于中、低产类型。3)产量与最大干物质积累速率、最大干物质积累速率时间、平均干物质积累速率、渐增期的持续时间及干物质增量、快增期平均积累速率及干物质增量、缓增期平均积累速率及干物质增量呈显著正相关。本研究表明, 套作下高产类型大豆复光后较强的干物质积累优势主要表现在复光后渐增期, 而复光后渐增期较强的干物质积累能力主要在于其较长的渐增期持续天数。
套作; 大豆; 产量水平; 品种; 光照恢复; 干物质生产
大豆()起源于中国, 至今已有五千多年的种植史。大豆以其优良的营养价值, 广泛应用于食品、医药、饲料及工业原料, 需求量逐年增加。然而, 受比较效益下降、进口冲击等影响, 我国大豆生产出现下滑, 产需缺口扩大, 2015年, 进口量达8 169万t, 同比增长14.4%。间套作大豆不仅能充分利用光热水资源, 还能提高复种指数, 是增加我国大豆总产量, 缓解供需矛盾的主要途径之一[1-2]。其中, 玉米()-大豆带状套作复合种植模式是我国西南、华南间套作大豆的重要代表模式。
在玉米-大豆带状套作系统中, 大豆存在两个不同的生长阶段: 与玉米的共生期和玉米收获后的单独生长期[3-4]。共生期内, 低位作物大豆受高位玉米遮荫, 荫蔽信号对大豆的形态生理产生显著影响[5]。研究发现, 荫蔽环境下, 大豆表现为叶片变小变薄[4,6], 茎长显著增加, 茎粗、光合速率和地上部生物量显著下降[7-9], 随遮荫程度增加, 大豆幼苗叶片的叶绿素含量和叶绿素a/b值下降[10]; 光合积累量减少, 倒伏严重, 强耐荫性品种在中度遮荫下能保持较高光合能力和抗倒伏能力[11]。玉米收获后的单独生长期, 大豆获得补偿生长[3]。有研究表明, 在间套作系统中, 前茬作物收获后, 后茬作物的生长得到恢复和补偿, 最后产量达到或者超过相应单作[12-13]。这说明在间套作系统中, 后期的补偿生长能弥补前期的负面影响, 而补偿生长主要表现为较大的干物质积累。许多学者常采用作物生长模拟方程来解释干物质积累和产量的关系, 但在间套作系统中多集中在分析种间互作[14]、养分积累[15]等方面, 而用来描述作物补偿生长的研究还鲜见报道。因此, 本研究以不同产量水平的大豆品种为材料, 通过建立干物质积累模型, 分析与玉米套作复光后大豆干物质积累动态和光能截获特征, 明确不同产量水平大豆在去掉遮荫复光后的生长差异, 为筛选适宜套作的大豆品种提供理论依据。
1 材料与方法
1.1 试验材料
试验选取课题组收集的14个产量水平不同的大豆品种(系)作为试验材料, 其中高产品种: ‘南豆021-1’、‘特选13’、‘南豆12’和‘贡选1号’, 平均产量为1 408.17 kg∙hm–2; 中产品种: ‘小黄豆’、‘菜豆’、‘桂夏3号’、‘大圆豆’和‘罗泉黄’, 平均产量为880.7 kg∙hm–2; 低产品种: ‘铅山乌豆’、‘南256-1’、‘大黄珠’、‘广15’和‘贡秋豆04-2’, 平均产量为601.93 kg∙hm–2。
1.2 试验设计
试验于2013—2015年在四川农业大学雅安校区教学科研园区进行。试验地土壤含全氮2.79 g∙kg–1、全磷0.383 g∙kg–1、全钾12.89 g∙kg–1、速效氮168.6 mg∙kg–1、速效磷81.3 mg∙kg–1、速效钾140.1 mg∙kg–1、有机质33.2 g∙kg–1。
单因素随机区组设计, 采用玉米-大豆(2∶2)带状套作模式(relay strip intercropping, RSI), 共14个大豆品种。试验设3次重复, 小区面积12 m2(2 m× 6 m)。带状套作处理中的玉米品种为‘正红505’, 3月28日育苗, 4月9日移栽。移栽时2行玉米组成1带, 行距0.5 m, 穴距0.4 m, 每穴2苗。每带玉米间隔1.5 m, 玉米密度5万株 hm–2, 8月9日收获玉米。6月20日在玉米宽行内播种2行大豆, 行距为0.5 m, 窝距0.2 m, 每窝2株, 密度为9.9万株∙hm–2。带状套作玉米施肥量为纯氮240 kg∙hm–2、P2O570 kg∙hm–2、K2O 90 kg∙hm–2, 其中氮肥按底肥︰拔节肥︰穗肥2︰3︰5施用, 磷、钾肥以底肥施用。大豆全生育期均不施肥, 田间正常杂草病虫害管理。
1.3 测定项目与方法
分别于玉米收获当天, 收获后第15 d、30 d、45 d、60 d取样。每次取样前, 于晴天的11:00—13:00进行PAR分布的测定, 测定时, 利用LI-1400光量子仪(Li-Cor, USA), 在各小区内大豆顶部以上30 cm处测定自然光强Io(探头面水平向上)和入射到冠层底部的光强I, 用于计算光能截获率。
每次取样测定选择各小区长势一致的5株植株地上部进行。剪根后, 单株按叶片、叶柄、茎分解植株, 叶片经扫描获得单株叶面积用于计算叶面积指数, 然后分别装入牛皮纸袋中, 置于烘箱中105 ℃杀青30 min、75 ℃烘干至恒重, 称重并计算单株地上部干物质量。大豆成熟后每小区连续选取10株, 风干后考察单株荚数、单荚粒数、百粒重, 计算产量。
1.4 建模及检验
应用Logistic方程对复光后干物质积累过程进行拟合, 并计算相应干物质特征参数进行生长分析。并采用回归分析和配对检验进行模型检验, 模型模拟值与观测值间的一致性越好, 说明模拟结果越准确。建模数据来自2013—2014年, 模型检验数据来自2015年。Logistic方程为:
=/(1+´e´) (1)
式中:为复光后天数(复光日计作0=0);为复光后干物质(复光日干物质计0);为理论最大干物质;、为形状参数, 由方程一阶导数和二阶导数推导出参数。具体公式如下[16]:
干物质高峰开始日期1:
1=(ln-1.317)/(2)
对应此时干物质1为:
1=/(1+´e-´1) (3)
干物质高峰结束日期2:
2=(ln+1.317)/(4)
对应此时干物质2为:
2=/(1+´e-´2) (5)
复光后干物质达99%时()为有效积累期, 其计算公式3为:
3=(ln+4.595)/(6)
对应此时干物质为3。渐增期持续时间1为:
1=1-0(7)
渐增期干物质增量为:
1=1-0(8)
渐增期平均积累速率1为:
1=1/1(9)
快增期持续时间2为:
2=2-1(10)
快增期干物质增量2为:
2=2-1(11)
快增期平均积累速率2为:
2=2/2(12)
缓增期持续时间3为:
3=3-2(13)
缓增期干物质增量3为:
3=3-2(14)
缓增期平均积累速率3为:
3=3/3(15)
干物质积累速率最大时间max为:
max=ln/(16)
干物质积累速率最大时生长量max为:
max=/2 (17)
最大干物质积累速率max为:
max=´max(1-max) (18)
平均干物质积累速率mean为:
mean=3/3(19)
群体生长率和光合势计算公式为[17]:
群体生长率(g×m–2×d–1)=(2–1)/(2–1) (20)
光合势(×104m2∙d∙hm–2)=0.5×(1+2)×(2–1) (21)
式中:1和2为前后2次测定的干物质量(t×hm–2),1和2为前后2次测定的时间(d),1和2为前后2次测定的叶面积(m2×hm–2)。
光能截获率[18]计算公式为:
光能截获率=1-/o (22)
式中:为入射到冠层底部的光强,o为冠层顶部的光强。
1.5 数据分析与处理
试验所得数据用SPSS 17.0及Microsoft Excel 2013软件处理, 采用Duncan’s新复极差(SSR)法检验显著性, Spearman检验相关性, 线性回归分析及配对检验进行模型检验。
2 结果与分析
2.1 不同产量水平大豆品种复光后干物质积累特征
2.1.1 干物质积累量比较
复光后的干物质积累是影响产量的主要因素。图1表明, 2013年, 高产类型大豆复光后干物质积累量为29.39 g∙株-1, 分别比中低产类型大豆高34.28%和107.90%; 2014年高产类型大豆复光后干物质积累量为36.58 g∙株-1, 分别比中低产类型大豆高19.37%和75.14%。
不同小写字母表示在0.05水平上差异显著。Different lowercase letters mean significant differences at 0.05 level.
2.1.2 干物质Logistic模型的建立及检验
进一步运用Logistic方程对干物质积累过程进行模拟, 以复光后天数()为自变量, 干物质()为因变量。两年数据表明, 方程拟合的决定系数都在0.960以上, 说明Logistic方程能较好地拟合复光后大豆干物质积累过程(表1)。
对‘特选13’(高产)、‘罗泉黄’(中产)、‘广15’(低产)复光后的干物质模拟值与实测值进行线性回归分析表明(图2), 模拟的精确度(以2表示)分别为0.975、0.988、0.943, 相关系数均在0.971以上, 且模拟值与实测值相关性达极显著水平。将模拟值与实测值进行配对检验发现,值分别为0.909、0.886、0.900, 均大于0.05, 差异不显著。说明该模型可准确地反映不同大豆品种复光后的干物质积累特征。
2.1.3 干物质积累特征参数
由表2可知, 2013年, 高产类型大豆的最大干物质积累速率(max)和平均干物质积累速率(mean)分别为0.847 g∙d-1、0.462 g∙d-1, 均显著大于中产类型大豆的0.553 g∙d-1、0.331 g∙d-1和低产类型大豆的0.454 g∙d-1、0.273 g∙d-1。高产类型大豆在复光后30 d达到最大干物质积累速率, 此时最大干物质积累量为18.515 g∙株-1。2014年, 高产大豆‘特选13’的最大干物质积累速率(max)、最大干物质积累速率时间(max)、干物质积累速率最大时间生长量(max)、平均干物质积累速率(mean)均显著大于中低产类型。
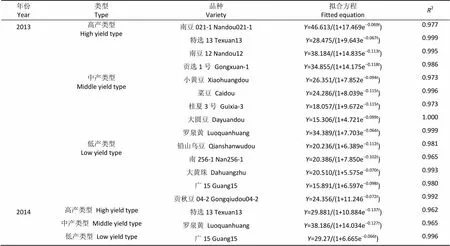
表1 不同产量类型大豆与玉米套作复光后干物质积累模拟方程
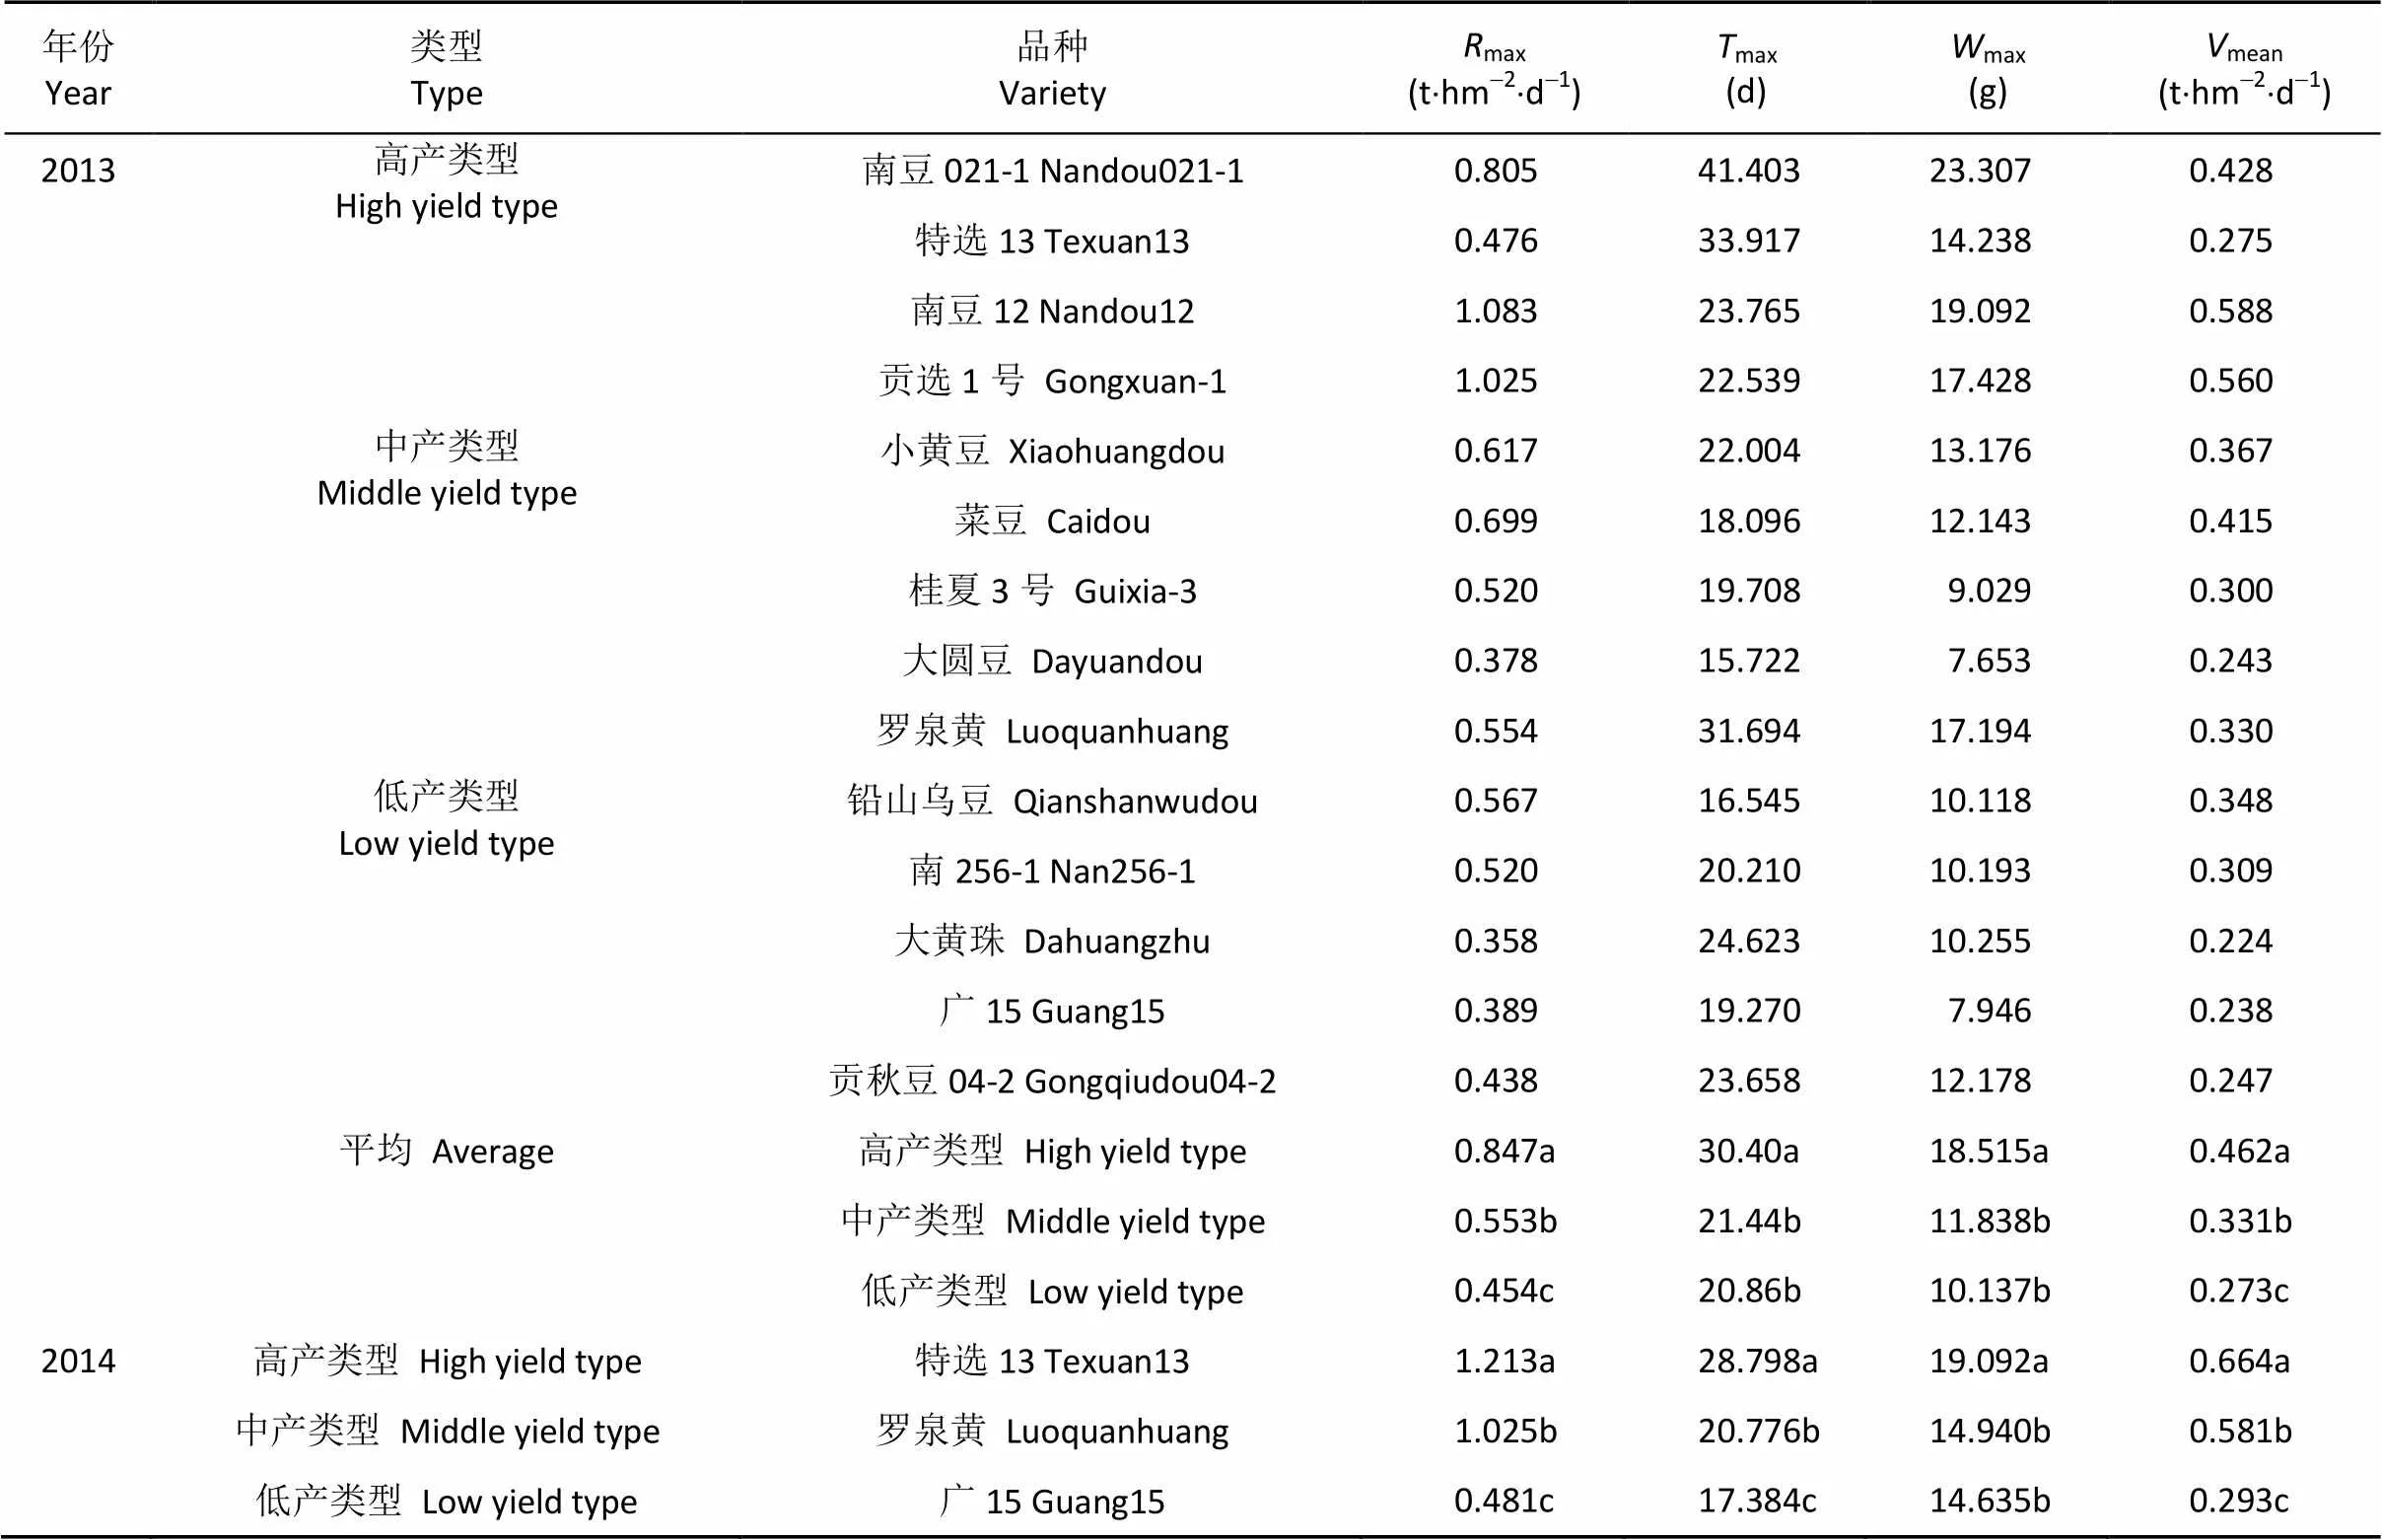
表2 不同产量类型大豆与玉米套作复光后干物质积累特征参数
max: 最大干物质积累速率;max: 最大干物质积累速率时间;max: 干物质积累速率最大时间生长量;mean: 平均积累速率。max: maximum dry matter accumulation rate;max: time reaching the maximum dry matter accumulation rate;max: dry matter weight at the time of maximum dry matter accumulation rate;mean: mean dry matter accumulation rate.
2.1.4 干物质积累阶段
依据Logistic曲线进一步将大豆复光后干物质积累过程分为渐增期、快增期和缓增期(表3)。3种类型大豆各阶段的干物质积累持续时间均为缓增期>快增期>渐增期; 干物质积累速率均呈先上升后下降趋势, 表现为快增期>渐增期>缓增期, 干物质积累量则为快增期>缓增期>渐增期。高产类型大豆渐增期持续时间最长, 两年平均值为13.45 d, 缓增期持续时间两年平均值为40.54 d, 均显著高于低产类型, 但快增期差异不显著。高产类型在3个时期的干物质积累速率和积累量均最大。
2.1.5 干物质积累参数和产量的相关分析
对3种类型大豆的产量和各干物质积累参数进行相关分析发现(表4), 产量与最大干物质积累速率(max)、最大干物质积累速率时间(max)、干物质积累速率最大时生长量(max)、平均干物质积累速率(mean)、渐增期持续时间(1)、渐增期干物质增量(1)、快增期平均积累速率(2)、快增期干物质增量(2)、缓增期平均积累速率(3)、缓增期干物质增量(3)呈显著正相关。
2.2 不同产量水平大豆品种成熟期群体物质生产特征
通过计算大豆复光当天(0 d)至大豆生理成熟(45 d)这一阶段的群体物质生产特征发现(表5), 2013年, 高产类型大豆的叶面积指数、光能截获率、群体生长率及光合势分别为2.45 g×m-2×d-1、0.80 g×m-2×d-1、5.55 g×m-2×d-1和366.77 m2×d×m-2, 分别大于中产类型的1.50 g×m-2×d-1、0.67 g×m-2×d-1、3.37 g×m-2×d-1、250.34 m2×d×m-2和低产类型的1.11 g×m-2×d-1、0.45 g×m-2×d-1、2.74 g×m-2×d-1和205.87 m2×d×m-2。2014年, 高产大豆‘特选13’的叶面积指数、光能截获率、群体生长率及光合势分别为2.59 g×m-2×d-1、0.83 g×m-2×d-1、6.50 g×m-2×d-1和268.92 m2×d×m-2, 均显著大于中、低产类型大豆。
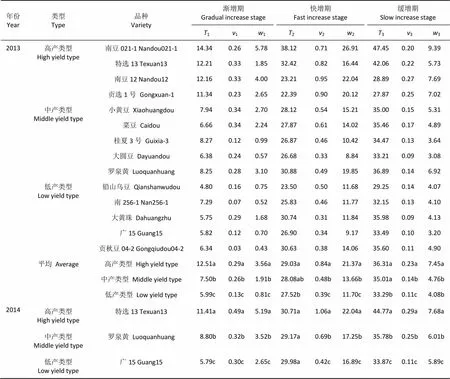
表3 不同产量类型大豆与玉米套作复光后干物质积累3个阶段的特征参数
1、2和3分别代表渐增期、快增期和缓增期的持续时间;1、2和3分别代表渐增期、快增期和缓增期的平均干物质积累速率;1、2和3分别代表渐增期、快增期和缓增期的干物质积累量。不同小写字母表示在0.05水平上差异显著。1,2and3stand for dry matter accumulation durations of gradual increase stage, fast increase stage and slow increase stage of dry matter, respectively.1,2and3stand for mean dry matter accumulation rates of gradual increase stage, fast increase stage and slow increase stage of dry matter.1,2and3stand for increased dry matter weights of gradual increase stage, fast increase stage, and slow increase stage of dry matter. Different lowercase letters mean significant differences at 0.05 level.

表4 与玉米套作的不同产量类型大豆产量与干物质积累因子的相关性
max: 最大干物质积累速率;max: 最大干物质积累速率时间;max: 干物质积累速率最大时间生长量;mean: 平均积累速率。1、2和3分别代表渐增期、快增期和缓增期的持续时间;1、2和3分别代表渐增期、快增期和缓增期的平均干物质积累速率;1、2和3分别代表渐增期、快增期和缓增期的干物质积累量。*, **分别代表在0.05和0.01水平上显著。max: maximum dry matter accumulation rate;max: the time reaching the maximum dry matter accumulation rate;max: dry matter weight at the time of maximum dry matter accumulation rate;mean: mean dry matter accumulation rate.1,2and3stand for dry matter accumulation durations of gradual increase stage, fast increase stage and slow increase stage of dry matter, respectively.1,2and3stand for mean dry matter accumulation rates of gradual increase stage, fast increase stage and slow increase stage of dry matter.1,2and3stand for increased dry matter weights of gradual increase stage, fast increase stage, and slow increase stage of dry matter. *, ** indicate significant differences at the 0.05 and 0.01 probability levels, respectively.
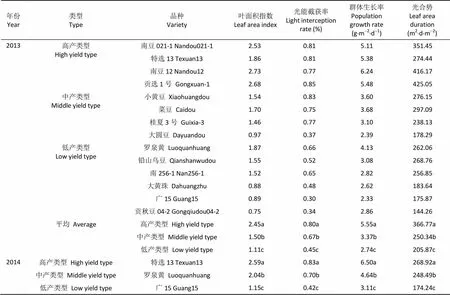
表5 不同产量类型大豆与玉米套作复光后的光合积累特征
不同小写字母表示在0.05水平上差异显著。Different lowercase letters mean significant differences at 0.05 level.
3 讨论
3.1 不同大豆品种复光后干物质积累模型的建立及特征参数
作物生长模型可描述作物生长发育特征, 在大豆、水稻()、玉米()等作物上均有相关报道[17,19-20]。就大豆而言, 唐江华等[21]基于Logistic方程分析了不同耕作方式对夏大豆干物质积累与分配规律的影响。姜丽霞等[22]根据Logistic方程建立了大豆干物质累积曲线从而预报大豆产量。本研究表明, 3种产量类型大豆复光后干物质量通过Logistic方程的拟合效果较好(2均大于0.960), 在此基础上, 分析了不同产量类型大豆品种干物质生产特征。
此前, 基于作物生长模型对大豆干物质生产特征的描述多侧重于单作大豆的全生育期, 而对套作大豆特别是套作复光后大豆干物质生产特征的研究还少见报道。本研究表明, 大豆复光后干物质积累速率呈先上升后下降趋势, 可分为渐增期、快增期和缓增期; 高产类型大豆渐增期持续时间两年平均值为13.45 d, 均显著高于中、低产类型, 最大干物质积累速率在复光后29 d, 且高产类型在3个时期的干物质积累速率和积累量均最大。有研究表明, 对大豆营养生长期进行荫蔽处理会影响大豆形态特征及降低生物量积累, 但对籽粒产量没有影响, 而对生殖生长期进行遮荫则会显著降低产量[23-25]。也有报道表明, 对大豆在生殖生长期进行光富集处理时能增加大豆产量, 暗示大豆生殖生长期增强光照有利于提高产量[26-27]。对不同生育时期遮荫发现, 大豆在出苗—盛花期间遮荫, 主要影响主茎形态, 对产量形成影响不大, 且在盛花期前复光, 有利于叶片光合能力的恢复[28]。根据大豆生育期发现, 套作下高产类型大豆生育期较长, 恢复光照时, 高产大豆仍处于营养生长期, 此时复光可以为生殖生长积累更多能量, 而中低产大豆已进入生殖生长期, 荫蔽环境严重影响了产量的形成。相关分析也表明, 渐增期持续时间和积累量与产量呈极显著正相关。说明高产大豆在复光后较大的干物质积累量主要来自其较长的渐增期和较大的平均增长速率。
3.2 不同大豆品种复光后群体光合物质生产差异
增加生殖生长期物质生产能力是提高大豆产量的有效途径[29]。叶面积指数、光能截获率、光合势、群体生长率等是表征群体光合生产能力的重要指标[30]。黄中文等[31]研究表明, 高产品系在生殖生长期地下部和地上部生物量显著高于中、低产品系。也有研究表明, 恢复光照后, 大豆地上部干物质迅速增加, 分配规律表现为“茎少叶多”, 高产类型地上部干物质、叶面积、叶干重比例均显著大于低产类型[32-33]。本试验条件下, 高产类型大豆产量两年平均值达1 408.17 kg∙hm–2, 较中、低产类型分别高37.45%和57.25%。恢复光照后, 叶面积指数、光能截获率、群体生长率和光合势均以高产类型显著大于中、低产类型。说明高产类型大豆叶面积较大, 能截获较多的光照, 从而促进更多干物质积累, 为高产奠定了基础。
4 结论
套作下高产类型大豆在复光时仍处于营养生长期, 复光可以为生殖生长积累更多能量。高产类型大豆在光照恢复后的干物质积累量、叶面积指数、光能截获率、群体生长率及光合势均显著高于中、低产类型。其复光后较强的物质积累优势主要体现在复光后的渐增阶段, 且渐增阶段较强的物质积累能力主要在于其较长的渐增期天数。
[1] 杨文钰, 杨峰, 雍太文. 我国间套作大豆研究方向和发展对策研讨会纪要[J]. 大豆科技, 2011, (1): 35–36 Yang W Y, Yang F, Yong T W. Symposium of research and development countermeasure of interplanting soybean in China[J]. Soybean Science & Technology, 2011, (1): 35–36
[2] 杨文钰, 雍太文, 任万军, 等. 发展套作大豆, 振兴大豆产业[J]. 大豆科学, 2008, 27(1): 1–7 Yang W Y, Yong T W, Ren W J, et al. Develop relay-planting soybean, revitalize soybean industry[J]. Soybean Science, 2008, 27(1): 1–7
[3] Wu Y S, Gong W Z, Yang F, et al. Responses to shade and subsequent recovery of soya bean in maize-soya bean relay strip intercropping[J]. Plant Production Science, 2016, 19(2): 206–214
[4] 范元芳, 杨峰, 何知舟, 等. 套作大豆形态、光合特征对玉米荫蔽及光照恢复的响应[J]. 中国生态农业学报, 2016, 24(5): 608–617 Fan Y F, Yang F, He Z Z, et al. Effects of shading and light recovery on soybean morphology and photosynthetic characteristics in soybean-maize intercropping system[J]. Chinese Journal of Eco-Agriculture, 2016, 24(5): 608–617
[5] 任梦露, 刘卫国, 刘小明, 等. 荫蔽信号对大豆幼苗生长和光合特性的影响[J]. 中国生态农业学报, 2016, 24(4): 499–505 Ren M L, Liu W G, Liu X M, et al. Effect of shading signal on growth and photosynthetic characteristics of soybean seedlings[J]. Chinese Journal of Eco-Agriculture, 2016, 24(4): 499–505
[6] Gong W Z, Qi P F, Du J B, et al. Transcriptome analysis of shade-induced inhibition on leaf size in relay intercropped soybean[J]. PLoS One, 2014, 9(6): e98465
[7] Gong W Z, Jiang C D, Wu Y S, et al. Tolerance vs. avoidance: Two strategies of soybean () seedlings in response to shade in intercropping[J]. Photosynthetica, 2015, 53(2): 259–268
[8] Su B Y, Song Y X, Song C, et al. Growth and photosynthetic responses of soybean seedlings to maize shading in relay intercropping system in Southwest China[J]. Photosynthetica, 2014, 52(3): 332–340
[9] Yang F, Huang S, Gao R C, et al. Growth of soybean seedlings in relay strip intercropping systems in relation to light quantity and red: Far-red ratio[J]. Field Crops Research, 2014, 155: 245–253
[10] 李瑞, 文涛, 唐艳萍, 等. 遮荫对大豆幼苗光合和荧光特性的影响[J]. 草业学报, 2014, 23(6): 198–206 Li R, Wen T, Tang Y P, et al. Effect of shading on photosynthetic and chlorophyll fluorescence characteristics of soybean[J]. Acta Prataculturae Sinica, 2014, 23(6): 198–206
[11] 刘婷, 刘卫国, 任梦露, 等. 遮荫程度对不同耐荫性大豆品种光合及抗倒程度的影响[J]. 中国农业科学, 2016, 49(8): 1466–1475 Liu T, Liu W G, Ren M L, et al. Effects of shade degrees on photosynthesis and lodging resistance degree of different shade tolerance soybean[J]. Scientia Agricultura Sinica, 2016, 49(8): 1466–1475
[12] Li L, Sun J H, Zhang F S, et al. Wheat/maize or wheat/soybean strip intercropping: Ⅱ. Recovery or compensation of maize and soybean after wheat harvesting[J]. Field Crops Research, 2001, 71(3): 173–181
[13] Li L, Sun J H, Zhang F S, et al. Wheat/maize or wheat/soybean strip intercropping: Ⅰ. Yield advantage and interspecific interactions on nutrients[J]. Field Crops Research, 2001, 71(2): 123–137
[14] Li C J, Yan D, Li H G, et al. The dynamic process of interspecific interactions of competitive nitrogen capture between intercropped wheat (L.) and faba bean (L.)[J]. PLoS One, 2014, 9(12): e115804
[15] Corre-Hellou G, Faure M, Launay M, et al. Adaptation of the STICS intercrop model to simulate crop growth and N accumulation in pea-barley intercrops[J]. Field Crops Research, 2009, 113(1): 72–81
[16] 王晓慧, 张磊, 刘双利, 等. 不同熟期春玉米品种的籽粒灌浆特性[J]. 中国农业科学, 2014, 47(18): 3557–3565 Wang X H, Zhang L, Liu S L, et al. Grain filling characteristics of maize hybrids differing in maturities[J]. Scientia Agricultura Sinica, 2014, 47(18): 3557–3565
[17] 韦还和, 孟天瑶, 李超, 等. 甬优籼粳杂交稻花后干物质积累模型与特征分析[J]. 作物学报, 2016, 42(2): 265–277 Wei H H, Meng T Y, Li C, et al. Dynamic model and its characteristics analysis for dry matter production after heading of Indica/Japonica hybrid rice of Yongyou Series[J]. Acta Agronomica Sinica, 2016, 42(2): 265–277
[18] 金剑, 刘晓冰, 王光华, 等. 大豆高产群体的生态生理特征[J]. 中国油料作物学报, 2003, 25(3): 109–114 Jin J, Liu X B, Wang G H, et al. Eco-physiological characters of high yielding population in soybean[J]. Chinese Journal of Oil Crop Sciences, 2003, 25(3): 109–114
[19] 李向岭, 赵明, 李从锋, 等. 播期和密度对玉米干物质积累动态的影响及其模型的建立[J]. 作物学报, 2010, 36(12): 2143–2153 Li X L, Zhao M, Li C F, et al. Effect of sowing-date and planting density on dry matter accumulation dynamic and establishment of its simulated model in maize[J]. Acta Agronomica Sinica, 2010, 36(12): 2143–2153
[20] 杨萍, 李杰, 剡斌, 等. 胡麻/大豆间作体系下施氮对胡麻干物质积累和产量的影响[J]. 中国油料作物学报, 2015, 37(4): 489–497 Yang P, Li J, Yan B, et al. Effects of applied nitrogen on dry matter accumulation and oil flax yield in flax/soybean intercropping system[J]. Chinese Journal of Oil Crop Sciences, 2015, 37(4): 489–497
[21] 唐江华, 苏丽丽, 罗家祥, 等. 不同耕作方式对夏大豆干物质积累及转运特性的影响[J]. 核农学报, 2015, 29(10): 2026–2032Tang J H, Su L L, Luo J X, et al. Effects of different tillage methods on dry matter accumulation and transfer characteristics of summer soybean[J]. Journal of Nuclear Agricultural Sciences, 2015, 29(10): 2026–2032
[22] 姜丽霞, 那济海, 朱海霞, 等. 基于Logistic方程的大豆产量预报方法[J]. 大豆科学, 2008, 27(3): 414–419 Jiang L X, Na J H, Zhu H X, et al. Method for forecasting soybean yield based on logistic equation[J]. Soybean Science, 2008, 27(3): 414–419
[23] Jiang H F, Egli D B. Shade induced changes in flower and pod number and flower and fruit abscission in soybean[J]. Agronomy Journal, 1993, 85(2): 221–225
[24] Jiang H F, Egli D B. Soybean seed number and crop growth rate during flowering[J]. Agronomy Journal, 1995, 87(2): 264–267
[25] 王一, 杨文钰, 张霞, 等. 不同生育时期遮阴对大豆形态性状和产量的影响[J]. 作物学报, 2013, 39(10): 1871–1879 Wang Y, Yang W Y, Zhang X, et al. Effects of shading at different growth stages on different traits and yield of soybean[J]. Acta Agronomica Sinica, 2013, 39(10): 1871–1879
[26] Mathew J P, Herbert S J, Zhang S H, et al. Differential response of soybean yield components to the timing of light enrichment[J]. Agronomy Journal, 2000, 92(6): 1156–1161
[27] Liu X B, Herbert S J, Hashemi A M, et al. Responses of soya bean yield and yield component distribution across the main axis under source-sink manipulation[J]. Journal of Agronomy and Crop Science, 2006, 192(2): 140–146
[28] 王一, 张霞, 杨文钰, 等. 不同生育时期遮阴对大豆叶片光合和叶绿素荧光特性的影响[J]. 中国农业科学, 2016, 49(11): 2072–2081 Wang Y, Zhang X, Yang W Y, et al. Effect of shading on soybean leaf photosynthesis and chlorophyll fluorescence characteristics at different growth stages[J]. Scientia Agricultura Sinica, 2016, 49(11): 2072–2081
[29] Board J E, Modali H. Dry matter accumulation predictors for optimal yield in soybean[J]. Crop Science, 2005, 45(5): 1790–1799
[30] 凌启鸿. 作物群体质量[M]. 上海: 上海科学技术出版社, 2000: 42–120 Ling Q H. Crop Population Quality[M]. Shanghai: Shanghai Scientific and Technical Publishers, 2000: 42–120
[31] 黄中文, 赵团结, 盖钧镒. 大豆不同产量水平生物量积累与分配的动态分析[J]. 作物学报, 2009, 35(8): 1483–1490 Huang Z W, Zhao T J, Gai J Y. Dynamic analysis of biomass accumulation and partition in soybean with different yield levels[J]. Acta Agronomica Sinica, 2009, 35(8): 1483–1490
[32] 龚万灼, 吴雨珊, 雍太文, 等. 玉米-大豆带状套作中荫蔽及光照恢复对大豆生长特性与产量的影响[J]. 中国油料作物学报, 2015, 37(4): 475–480 Gong W Z, Wu Y S, Yong T W, et al. Effects of shade and lighting recovery on growth and yield of soybean in maize-aoybean relay strip intercropping[J]. Chinese Journal of Oil Crop Sciences, 2015, 37(4): 475–480
[33] 吴雨珊, 龚万灼, 廖敦平, 等. 带状套作荫蔽及复光对不同大豆品种(系)生长及产量的影响[J]. 作物学报, 2015, 41(11): 1740–1747 Wu Y S, Gong W Z, Liao D P, et al. Effects of shade and light recovery on soybean cultivars (Lines) and its relationship with yield in relay strip intercropping system[J]. Acta Agronomica Sinica, 2015, 41(11): 1740–1747
Dynamic model and characteristics analysis of dry matter production after light recovery of different soybean varieties in relay strip intercropping systems*
WU Yushan1, GONG Wanzhuo2, YANG Wenyu1**, YONG Taiwen1, YANG Feng1, LIU Weiguo1, WU Xiaoling1
(1. College of Agronomy, Sichuan Agricultural University / Key Laboratory of Crop Ecophysiology and Farming System in Southwest China, Ministry of Agriculture / Sichuan Engineering Research Center for Crop Strip Intercropping System, Chengdu 611130, China; 2. Characteristic Crops Research Institute, Chongqing Academy of Agricultural Sciences, Yongchuan 402160, China)
Maize-soybean relay strip intercropping is a widespread practice in soybean production areas in southwestern and southern China and has been the main mode of increasing total output of soybean in China. To provide theoretical basis for the selection and breeding of high yield soybean varieties for intercropping, this study used fourteen soybean varieties with different yield levels toanalyze the characteristics of dry matter production after light recovery (after maize harvest) of different yield types of soybean varieties relay strip intercropped with maize.Results indicated that average grain yield of high yield soybean varieties was 1 408.17 kg∙hm–2, which was 37.45% and 57.25% higher than those of medium and low yield varieties, respectively. Dry matter accumulation of high yield soybean varieties was on an average of 32.99 g∙plant-1, which was 26.82% and 91.51% higher than those of medium and low yield varieties, respectively.Logistic equation was used to simulate the relationship between dry matter weight and days after light recovery for three types of soybean varieties (2≥ 0.960). Pairedtest for independent samples showed no significant difference between the simulated and measured values. After light recovery, the rate of dry matter accumulation of three types of soybean varieties increased before declining. The order of maximum rate of dry matter accumulation and the mean rate of dry matter accumulation was high yield type > medium yield type > low yield type. The average time to maximum rate of dry matter accumulation after light recovery of the high yield soybean varieties was 41–42 days, while that of both medium and low types was 33–37 days. The duration, accumulation rate and accumulation amount of dry matter of gradual increase stage; the accumulation rate and amount of dry matter accumulation of both fast increase and slow increase stages of high yield soybean were significantly higher than those of other two yield types of soybean. The yield had a significantly positive correlation with the maximum dry matter accumulation rate, time reaching the maximum dry matter accumulation rate, mean dry matter accumulation rate, duration of gradual increase stage, dry matter weight of gradual increase stage, dry matter accumulation rate and weight of both fast and slow increase stages. Two years data indicated that leaf area index, light interception rate, population growth rate and leaf area duration of high yield soybean were 2.52 g×m-2×d-1, 0.81 g×m-2×d-1, 6.02 g×m-2×d-1and 317.84 m2×d×m-2, respectively, which were significantly higher than those of both medium and low yield types. Our results suggested that greater dry matter accumulation mainly occurred at gradual increase stage after light recovery for high yield soybean varieties, which was mainly attributed to the longer duration of the stage.
Relay strip intercropping; Soybean; Yield level; Variety; Light recovery; Dry matter production
10.13930/j.cnki.cjea.160928
S592
A
1671-3990(2017)04-0572-09
2016-10-19
2016-12-18
Oct. 19, 2016; accepted Dec. 18, 2016
* 国家自然科学基金项目(31171476)和现代农业产业技术体系建设专项(CARS-04-PS19)资助
* Founded by the National Natural Science Foundation of China (31171476) and the Special Fund for Construction of Modern Agricultural Industry Technology System of China (CARS-04-PS19)
** Corresponding author, E-mail: mssiyangwy@sicau.edu.cn
**通讯作者: 杨文钰, 主要研究方向为作物高产栽培。E-mail: mssiyangwy@sicau.edu.cn
吴雨珊, 研究方向为大豆高产栽培生理。E-mail: wuys513@foxmail.com
吴雨珊, 龚万灼, 杨文钰, 雍太文, 杨峰, 刘卫国, 武晓玲. 带状套作复光后不同大豆品种干物质积累模型与特征分析[J].中国生态农业学报, 2017, 25(4): 572-580
Wu Y S, Gong W Z, Yang W Y, Yong T W, Yang F, Liu W G, Wu X L. Dynamic model and characteristics analysis of dry matter production after light recovery of different soybean varieties in relay strip intercropping systems[J]. Chinese Journal of Eco-Agriculture, 2017, 25(4): 572-580
