胰腺局灶性实性病变CT灌注参数特征及不同算法的比较
2017-03-15薛华丹刘昌义金征宇
李 平,朱 亮,薛华丹,刘昌义,徐 凯,李 娟,孙 婷,金征宇
中国医学科学院 北京协和医学院 北京协和医院放射科,北京 100730
·Force CT专栏 论著·
胰腺局灶性实性病变CT灌注参数特征及不同算法的比较
李 平,朱 亮,薛华丹,刘昌义,徐 凯,李 娟,孙 婷,金征宇
中国医学科学院 北京协和医学院 北京协和医院放射科,北京 100730
目的总结胰腺局灶性实性病变CT灌注参数的特征,评估Deconvolution和Maximum slope+Patlak方法所测得的灌注参数之间的一致性及两种测量方法之间是否可相互替换。方法2015年12月至2016年11月在北京协和医院行全胰腺CT灌注检查、经术后及穿刺病理证实为胰腺癌(PAC)患者22例和胰腺神经内分泌瘤(pNET)患者22例(共37个病灶),全胰腺CT灌注检查采用管电压80kV、管电流100mA,进行28次连续动态体积扫描,静脉注射45ml碘普罗胺,速率5ml/s,随后追加40ml盐水,速率5ml/s。由1名经验丰富的放射科医师在西门子后处理工作站上分别用Maximum slope+Patlak及Deconvolution method 方法进行数据分析,测量并记录其灌注参数。结果Wilcoxon非参配对秩和检验结果显示,PAC(BFM比BFD,Z=-3.263,P=0.001;BVD 比BVP,Z=-3.978,P=0.000)和pNET(BFM 比BFD,Z=-5.212,P=0.000;BVD比BVP,Z=-2.633,P=0.008)两种方法所测得的灌注参数之间差异均有统计学意义。Spearman’s 相关系数分析结果显示,PAC(BFM与BFD,r=0.845,P=0.000;BVD 与BVP,r=0.964,P=0.000)和pNET(BFM与BFD,r=0.759,P=0.000;BVD比BVP,r=0.683,P=0.000)两种方法所测得的灌注参数间均有显著相关性。PAC的BFM/BFD和BVD/BVP几何均数及其95%一致性界限(LOA)分别为0.77(0.61~0.99)和1.42(1.13~1.79),pNET的BFM/BFD和BVD/BVP几何均数及其95% LOA分别为0.66(0.51~0.86)和1.15(0.88~1.50)。结论无论在PAC还是pNET中由Deconvolution和Maximum slope+Patlak方法所测得的灌注参数BF、BV存在显著性差异,两种测量方法之间具有显著相关性,并且两者之间的转换范围较窄,所以两种测量方法之间可以相互替换。
胰腺实性病变;CT灌注;Deconvolution;Maximum slope+Patlak
ActaAcadMedSin,2017,39(1):80-87
胰腺实性病变可以有多种原因所致,包括肿瘤、炎症、感染等,其中较常见的乏血供病变为胰腺癌,富血供病变为胰腺神经内分泌肿瘤(pancreatic neuroendocrine tumor,pNET)。胰腺癌是最常见的胰腺恶性病变,其发病率近年不断升高,由于胰腺位置隐蔽,临床症状不典型,发现时多已是晚期。随着CT技术的不断发展,胰腺病变的检出及诊断得到了极大提高,但当病变小于2 cm时,其检出敏感性有所下降[1],此时形态学结合功能学检查可能有所帮助。pNET是一种少见的胰腺肿瘤,根据有无临床症状分为功能性和非功能性,根据其病理特点分为良性、低度恶性和高度恶性,世界卫生组织根据核分裂数及增殖细胞核抗原Ki- 67将其分为G1、G2、G3级[2]。无论是乏血供病变还是富血供病变,肿瘤性病变预后与肿瘤内微血管密度(tumor microvascular density,MVD)密切相关,有研究指出CT灌注成像可以反映MVD[3]。CT灌注为功能性成像,是一种相对先进的CT检查技术[4],可将功能参数扩展到传统增强CT上面。CT灌注成像允许逐像素计算一系列的生理参数并形成彩色函数图,这些参数可反映肿瘤血管生成的生理及分子过程,用于提供生物标志物或反映肿瘤的治疗反应[5]。因此,CT灌注成像是一种理想的无创检查方法,可反映和量化组织的血流动力学变化,已有研究表明其在胰腺疾病方面的应用价值[6- 7],其在肿瘤病变的检出、诊断、良恶性鉴别、病理诊断及分级、肿瘤性疾病对放化疗反应的评估、患者预后预测等方面有重要作用[8- 10]。CT灌注成像为定量检查,其优势在于定量测量灌注参数,以往研究显示,不同研究所得的灌注参数数值之间存在明显差异,这可能与不同研究的研究对象、灌注扫描方案、所应用的灌注后处理软件及灌注测量方法不同有关[8,11]。本研究总结了胰腺实性病变的CT灌注特点,评估了Deconvolution和Maximum slope+Patlak方法所测得的灌注参数之间的一致性及两种测量方法之间是否可相互替换,以期为今后的临床应用提供参考。
对象和方法
对象2015年12月至2016年11月在北京协和医院行胰腺灌注CT检查、经术后及穿刺病理证实为胰腺癌或pNET的患者,除外胰腺的弥漫性病变。共入组胰腺癌患者22例,其中,男12例,女10例,平均年龄(57±12岁)(25~79岁);pNET患者22例(共37个病灶),其中,男11例,女11例,平均年龄(44±13)岁(10~60岁),pNET多发患者5例。本研究经北京协和医院伦理委员会批准,所有患者在检查前均签署了知情同意书。
容积灌注CT扫描方案采用第3代双源CT (SOMATOM Definition Force;Siemens Healthcare,Forchheim,Germany)行胰腺灌注检查,具体扫描方案如下:(1)灌注前腹部CT平扫确定胰腺灌注扫描的范围:准直192×0.6 mm,螺距 0.6,重建间隔 5 mm,管电压、管电流自动选择,扫描范围为上腹部,从横隔至双肾下极。(2)灌注前告知患者进行均匀浅呼吸并应用、加压腹带以减少患者呼吸运动伪影,采用DynMulti 4D模式进行灌注扫描:管电压80 kV,管电流100 mA,进行28次连续动态数据采集,最后1次采集时间间隔为3 s,其余时间间隔均为1.5 s,总灌注扫描时间42 s,扫面范围为176 mm。采用双筒高压注射器经肘前静脉注射对比剂 (碘普罗胺,370 mgI/ml,45 ml,5 ml/s) 和生理盐水(40 ml,5 ml/s)。在对比剂注射6 s后开始行灌注扫描。
图像分析及定量灌注评估1名经验丰富的放射科医生在西门子后处理工作站(Syngo Volume Perfusion CT Body,VB10,Siemens Healthcare)上分别用Deconvolution 和Maximum slope+Patlak方法进行数据测量。CT灌注分析软件采用自动运动校正及4D减噪技术,自动选择腹主动脉作为其输入动脉,形成动脉输入函数,从而获得时间密度曲线,进而形成灌注伪彩图。在增强CT图像上以病变的最大层面画取感兴趣区(region of interest,ROI)。划定ROI区域时,应尽量保证两种方法测量的ROI大小一致,避开血管、胆管、胰腺边缘、胰腺导管及病变坏死区域。然后分别用Deconvolution 和Maximum slope+Patlak方法测量并记录胰腺病变的灌注参数血流量(blood flow,BF)、血容量(blood volume,BV),Deconvolution方法所测得的灌注参数BF、BV用BFD、BVD表示,Maximum slope方法所测得的灌注参数BF用BFM表示,Patlak方法所测得的灌注参数BV用BVP表示。
统计学处理采用SPSS 21.0统计软件,正态分布计量资料以均数±标准差表示,灌注参数测量值之间的差异性以Wilcoxon 配对非参秩和检验评估,两种测量方法的相关性以Spearman’s 相关系数评估;两种测量方法所测得的灌注参数原始数据用Bland-Altman散点图表示,并采用Bland-Altman方法分析两种测量方法之间一致性,测量数据经对数转换;P<0.05为差异有统计学意义。
结 果
两种方法所测得灌注参数
Deconvolution法:胰腺癌和pNET的BFD分别为(54.8±22.4)和(282.8±138.5)ml/(100ml·min),BVD分别为(5.2±3.0)和(25.7±9.9)ml/100 ml。
Maximum slope+Patlak法:胰腺癌和pNET的BFM分别(43.4±19.4)和(175.4±56.0)ml/(100 ml·min),BVP分别为(3.9±3.0)和(22.1±8.4)ml/100 ml。
灌注参数测量数据之间的差异Wilcoxon非参配对秩和检验结果显示,胰腺癌(BFM比BFD,Z=-3.263,P=0.001;BVD 比BVP,Z=-3.978,P=0.000)和pNET(BFM 比BFD,Z=-5.212,P=0.000;BVD比BVP,Z=-2.633,P=0.008)两种方法所测得的灌注参数之间差异均有统计学意义(表1)。
灌注参数测量数据之间的相关性Spearman’s 相关系数分析结果显示,胰腺癌(BFM比BFD,r=0.845,P=0.000;BVD 比BVP,r=0.964,P=0.000)和pNET(BFM比BFD,r=0.759,P=0.000;BVD比BVP,r=0.683,P=0.000)两种方法所测得的灌注参数间均有显著相关性。
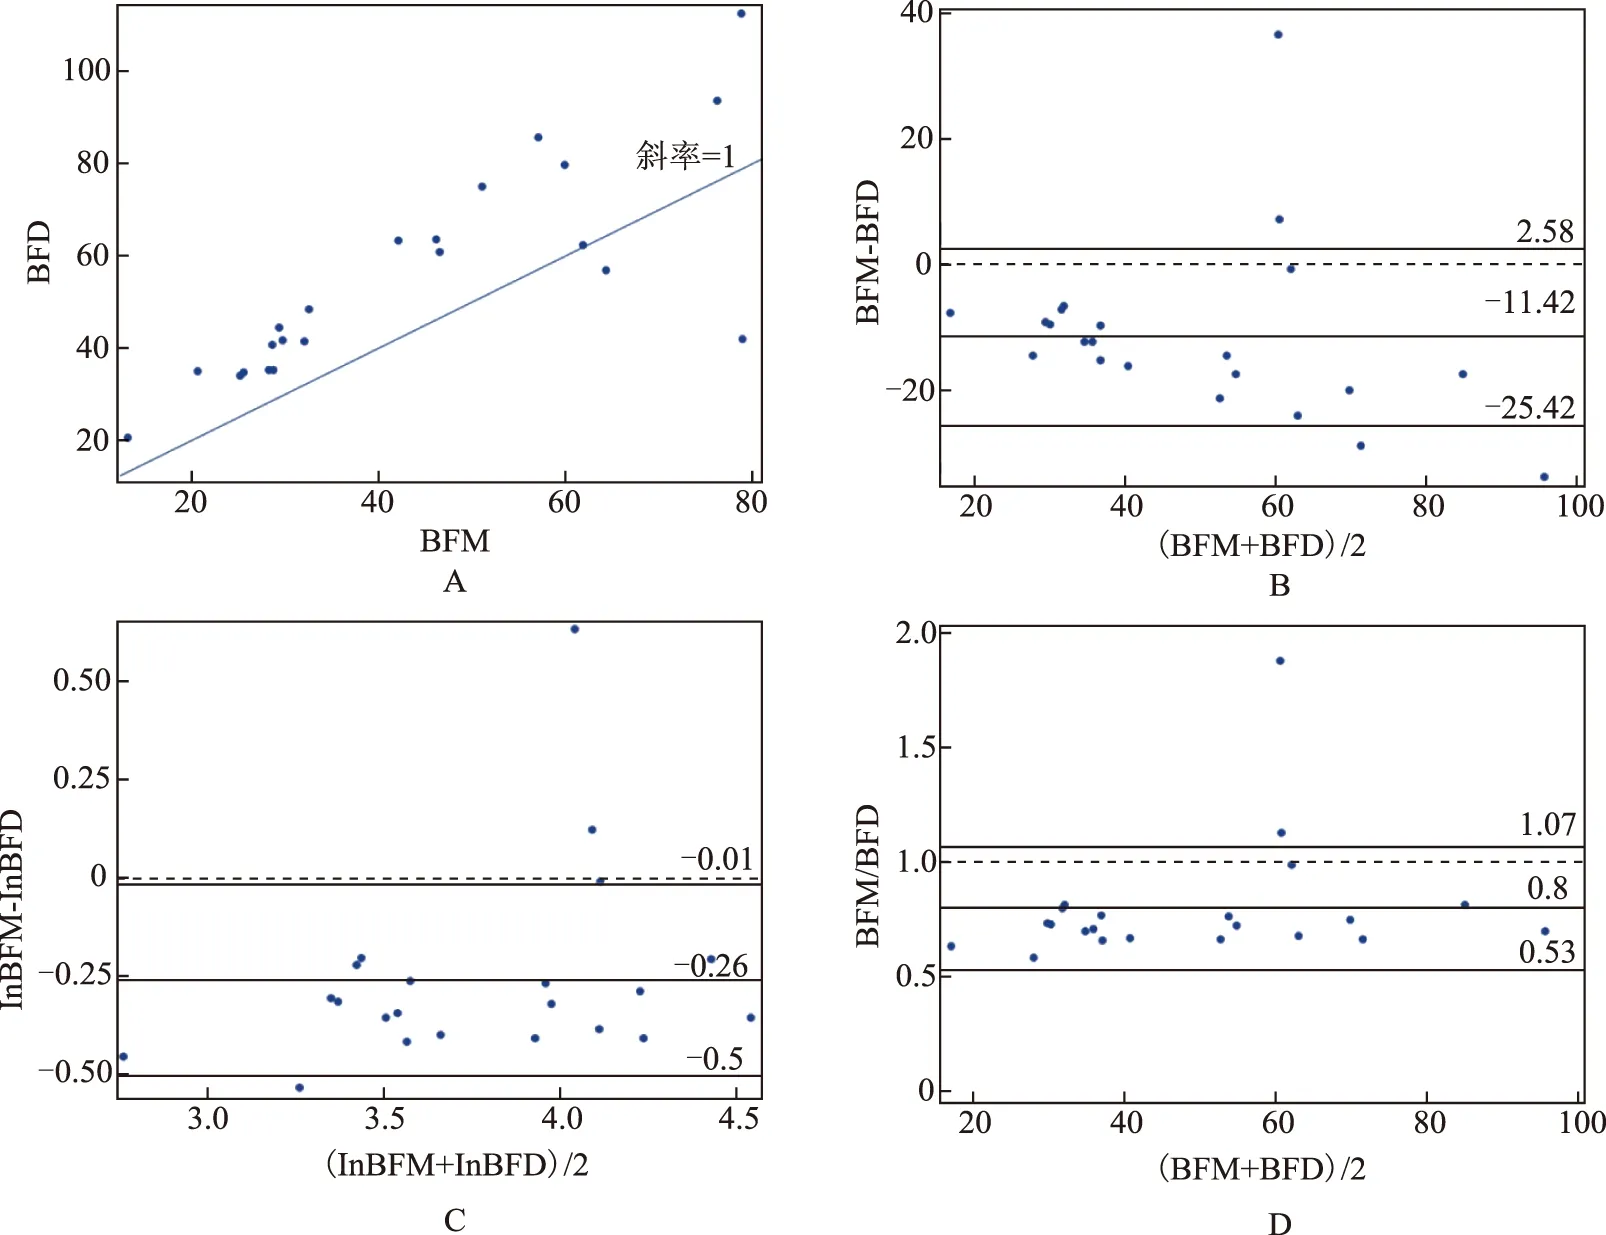
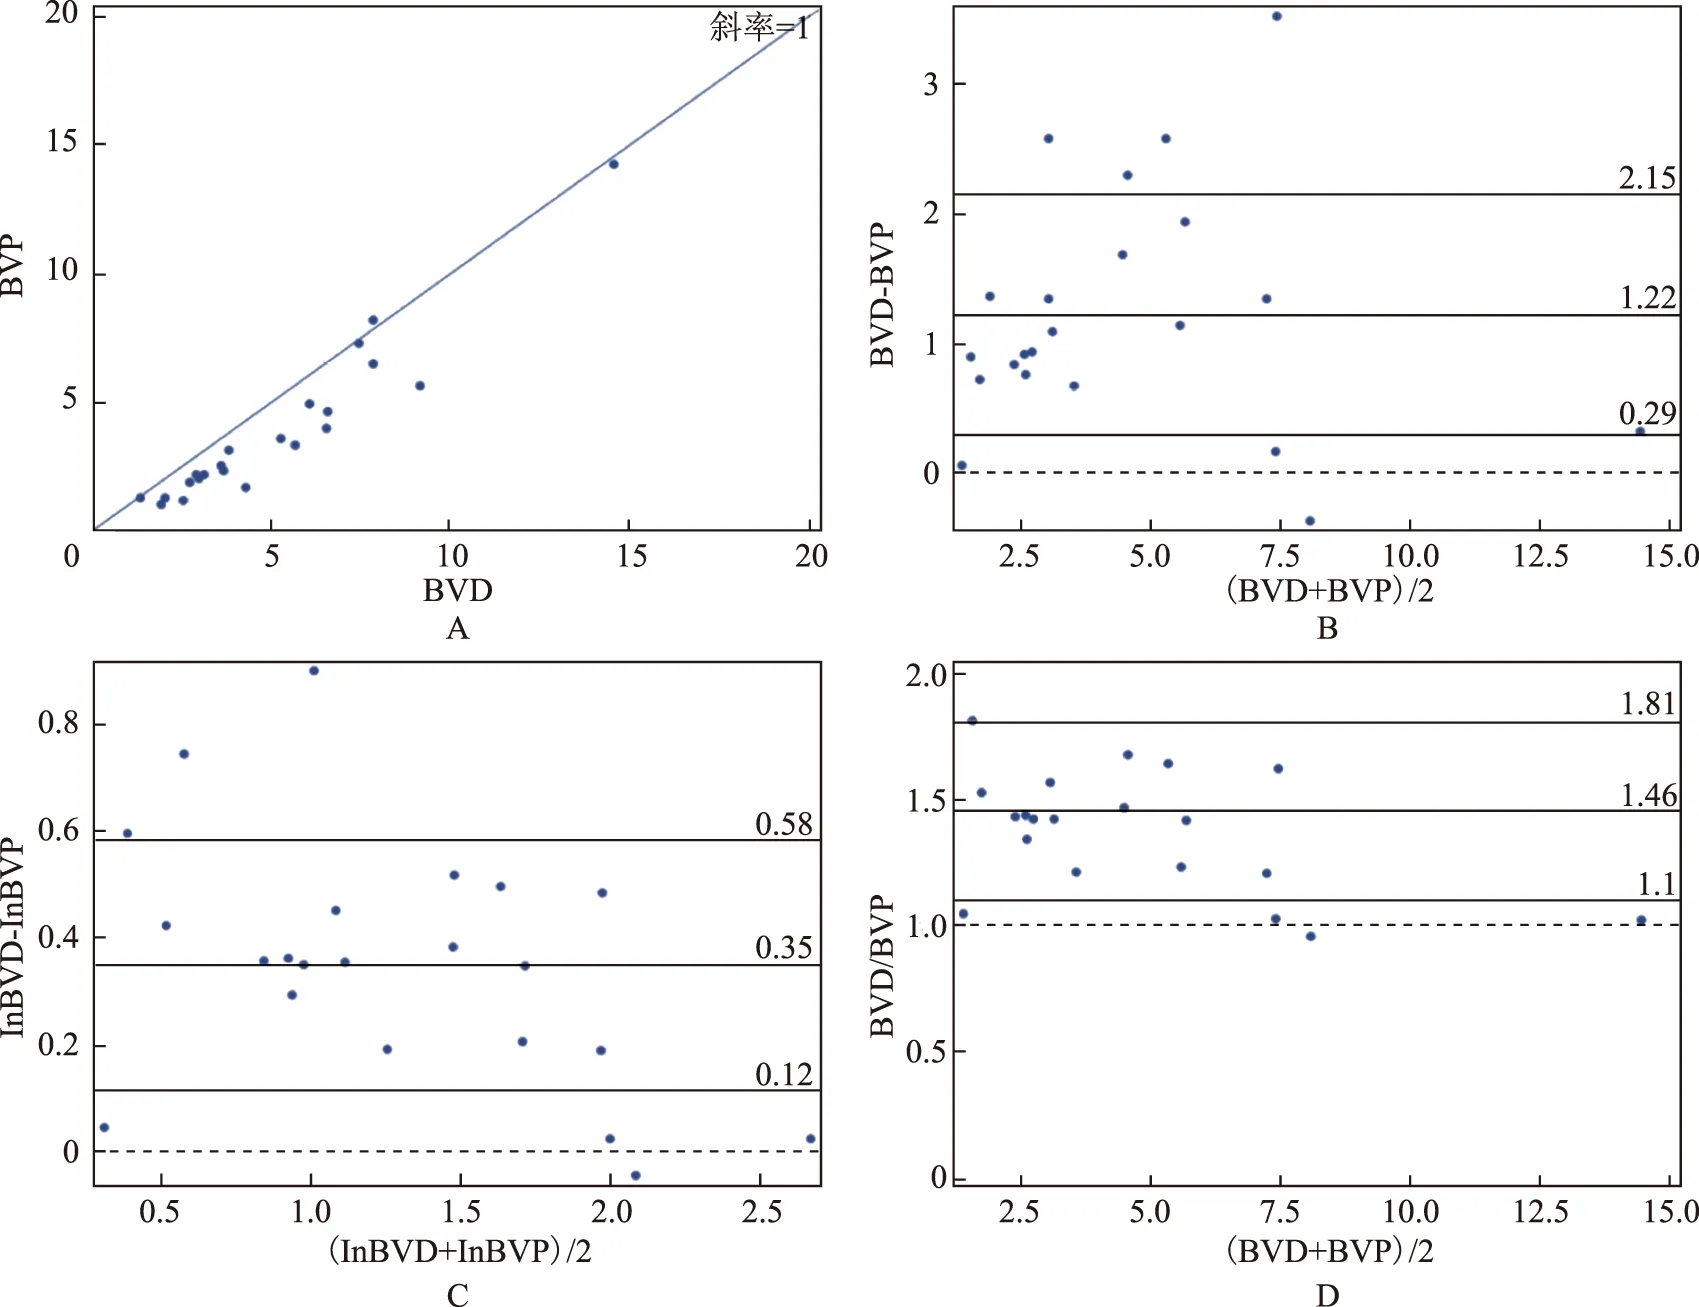
灌注参数测量数据之间的一致性Bland-Altman分析结果显示,两种灌注测量方法所测得的灌注参数BF、BV的均值差及95%一致性界限(limits of agreenment,LOA)存在明显差异(图 1~4A)。胰腺癌和pNET由Deconvolution方法所测得灌注参数BF和BV值均高于由Maximum slope+Patlak方法测量所得(图1A、B,2A、B,3A、B,4A、B)。由于灌注参数BF、BV的差值与均值分布不均(图1~4 B),本研究对原始数据进行对数转换后绘图(图1~4C),经过反对数计算可得出pNET BFM/BFD的几何均数及其95%LOA为0.66(0.51~0.86),BVD/BVP的几何均数及其95%LOA为1.15(0.88~1.50);BFM/BFD的均数及其95%LOA为0.68(0.51~0.85),BVD/BVP的均数及其95%LOA为1.19(0.84~1.54)。胰腺癌BFM/BFD的几何均数及其95%LOA为0.77(0.61~0.99),BVD/BVP的几何均数及其95%LOA为1.42(1.13~1.79);BFM/BFD的均数及其95%LOA为0.80(0.53~1.07),BVD/BVP的均数及其95%LOA为1.46(1.10~1.81)(图1~4D)。

表1 PAC与pNET患者CT灌注参数的差异Table 1 Differences in parameters of perfusion CT between patients with PAC and pNET
PAC:胰腺癌;pNET:胰腺神经内分泌瘤;BF:血流量;BV:血容量
PAC:pancreatic cancer;pNET:pancreatic neuroendocrine tumor;BF:blood flow;BV:blood volume
BFM:血流量(Maximum slope);BFD:血流量(Deconvolution)
BFM:blood flow(Maximum slope);BFD:blood flow(Deconvolution)
A.BFM与BFD一致性图,大部分数据都在y=x线上方;B.Bland-Altman一致性点图,0为完全一致性,中间连续的实线为平均差,外边的两条线表现95%一致性界限;C.经对数转换的lnBFM及lnBFD之间的一致性分析,0为完全一致性,中间连续的实线为平均差,外边的两条线表现95%一致性界限;D.BFM/BFD的一致性分析,1为完全一致性,中间连续的实线为平均差,外边的两条线表现95%一致性界限
A.BFM and BFD agreement diagram:the majority of data points lie above the line of equality (y=x);B.Bland-Altman agreement plot of the difference between the BFM and BFD,against their mean values (0:line of perfect agreement;thick continuous line in the middle:the mean difference;outer lines:95% limits of agreement);C.Bland-Altman agreement plot of the difference between the ln-transformed BFM (ln BFM) and BFD (lnBFD),against their mean values (0:line of perfect agreement;thick continuous line in the middle:the mean difference;outer continuous lines:95% limits of agreement);D. Bland-Altman agreement plot of the difference between the BFM/BFD ratios,against their mean values (1:line of perfect agreement;thick continuous line in the middle:the mean difference;outer continuous lines:95% limits of agreement)
图1 胰腺癌血流参数的一致性
Fig 1 Agreement diagram of blood flow of pancreatic cancers
BVD:血容量(Deconvolution);BVP:血容量(Patlak)
BVD:blood volume(Deconvolution);BVP:blood volume(Patlak)
A.BVD与BVP的一致性图,大部分数据都在y=x线下方;B.Bland-Altman一致性点图,0为完全一致性,中间连续的实线为平均差,外边的两条线表现95%一致性界限;C.经对数转换的lnBVD及lnBVP之间的一致性分析,0为完全一致性,中间连续的实线为平均差,外边的两条线表现95%一致性界限;D.BVD/BVP的一致性分析,1为完全一致性,中间连续的实线为平均差,外边的两条线表现95%一致性界限
A.BVD and BVP agreement diagram:the majority of data points lie below the line of equality (y=x);B.Bland-Altman agreement plot of the difference between the BVD and BVP,against their mean values (0:line of perfect agreement;thick continuous line in the middle:the mean difference;outer continuous lines:95% limits of agreement);C.Bland-Altman agreement plot of the difference between the ln-transformed BVD (lnBVD) and BVP (lnBVP),against their mean values (0:line of perfect agreement;thick continuous line in the middle:the mean difference;outer continuous lines:95% limits of agreement);D.Bland-Altma agreement plot of the difference between the BVD/BVP ratios,against their mean values (1:line of perfect agreement;thick continuous line in the middle:the mean difference;outer continuous lines:95% limits of agreement)
图2 胰腺癌血容量参数的一致性
Fig 2 Agreement diagram of blood volume of pancreatic cancers
讨 论
CT灌注成像是一种无创的检查技术,可以提供组织形态学及量化血流动力学变化,对临床有重要意义,特别是在肿瘤性疾病的应用中显得尤为重要。而CT灌注参数的测量受多种因素影响,如灌注成像的软件及其应用的数学模型、计算方法、对比剂浓度、注射速度、ROI部位及大小等。分析和比较灌注参数时,这些因素应尽量保持一致。目前常用的计算方法有Deconvolution、Maximum slope及Patlak[12]。不同的计算方法所测得的灌注参数值明显不同,本研究结果显示Deconvolution和Maximum slope+Patlak方法所得pNET及胰腺癌的BFM与BFD、BVD与BVP间均有明显差异。Maximum slope用单室模型来评估灌注参数,其假设对比剂从流入动脉开始至最短通过时间这期间均留存在血管内,没有静脉的流出,所以这种方法测量的BF数值偏低[13- 14]。本研究结果亦显示,由Deconvolution方法所测得的灌注参数BF值高于由Maximum slope 方法所得,pNET的BFD、BFM 分别为(282.8±138.5)、(175.4±56.0)ml/(100ml·min),BFD值约是BFM值的1.5倍;胰腺癌BFD、BFM分别为(54.8±22.4)、(43.4±19.4)ml/(100ml·min),BFD值约是BFM值的1.3倍,与以往研究结果类似[3,9,11,15]。Patlak用两室模型来计算BV,其考虑到对比剂注入血流后,在组织的血管内外间存在物质交换,把血管内外分为2个室区。而Patlak对噪声更敏感,低管电压扫描可能会影响最终结果,导致计算出现误差[13]。Deconvolution法是利用推动剩余函数计算对比剂的静脉流出,对灌注的流入动脉和流出静脉进行综合考虑,与实际的血流动力学相近,计算出的灌注参数和函数图更能反映病变内部的实际情况[14]。本研究结果显示,pNET的BVD、BVP值分别为(25.7±9.9)、(22.1±8.4)ml/100ml,BVD是BVP值的1.2倍;胰腺癌的BVD、BVP值分别为(5.2±3.0)、(3.9±3.0)ml/100ml,BVD是BVP值的1.4倍。与以往研究结果相矛盾。Goh等[16]采用GE灌注后处理软件应用Deconvolution方法测量的结直肠癌BV值低于西门子灌注后处理软件Patlak方法测量所得。Bisdas等[17]研究发现在头颈部肿瘤中由Maximum slope+Patlak方法所测得的BF、BV值均高于由Deconvolution方法测量所得。推测其原因可能与研究对象不同、后处理软件不同、疾病构成不同有关,也有可能与本研究采用80kV管电压扫描有关,尚需进一步研究。
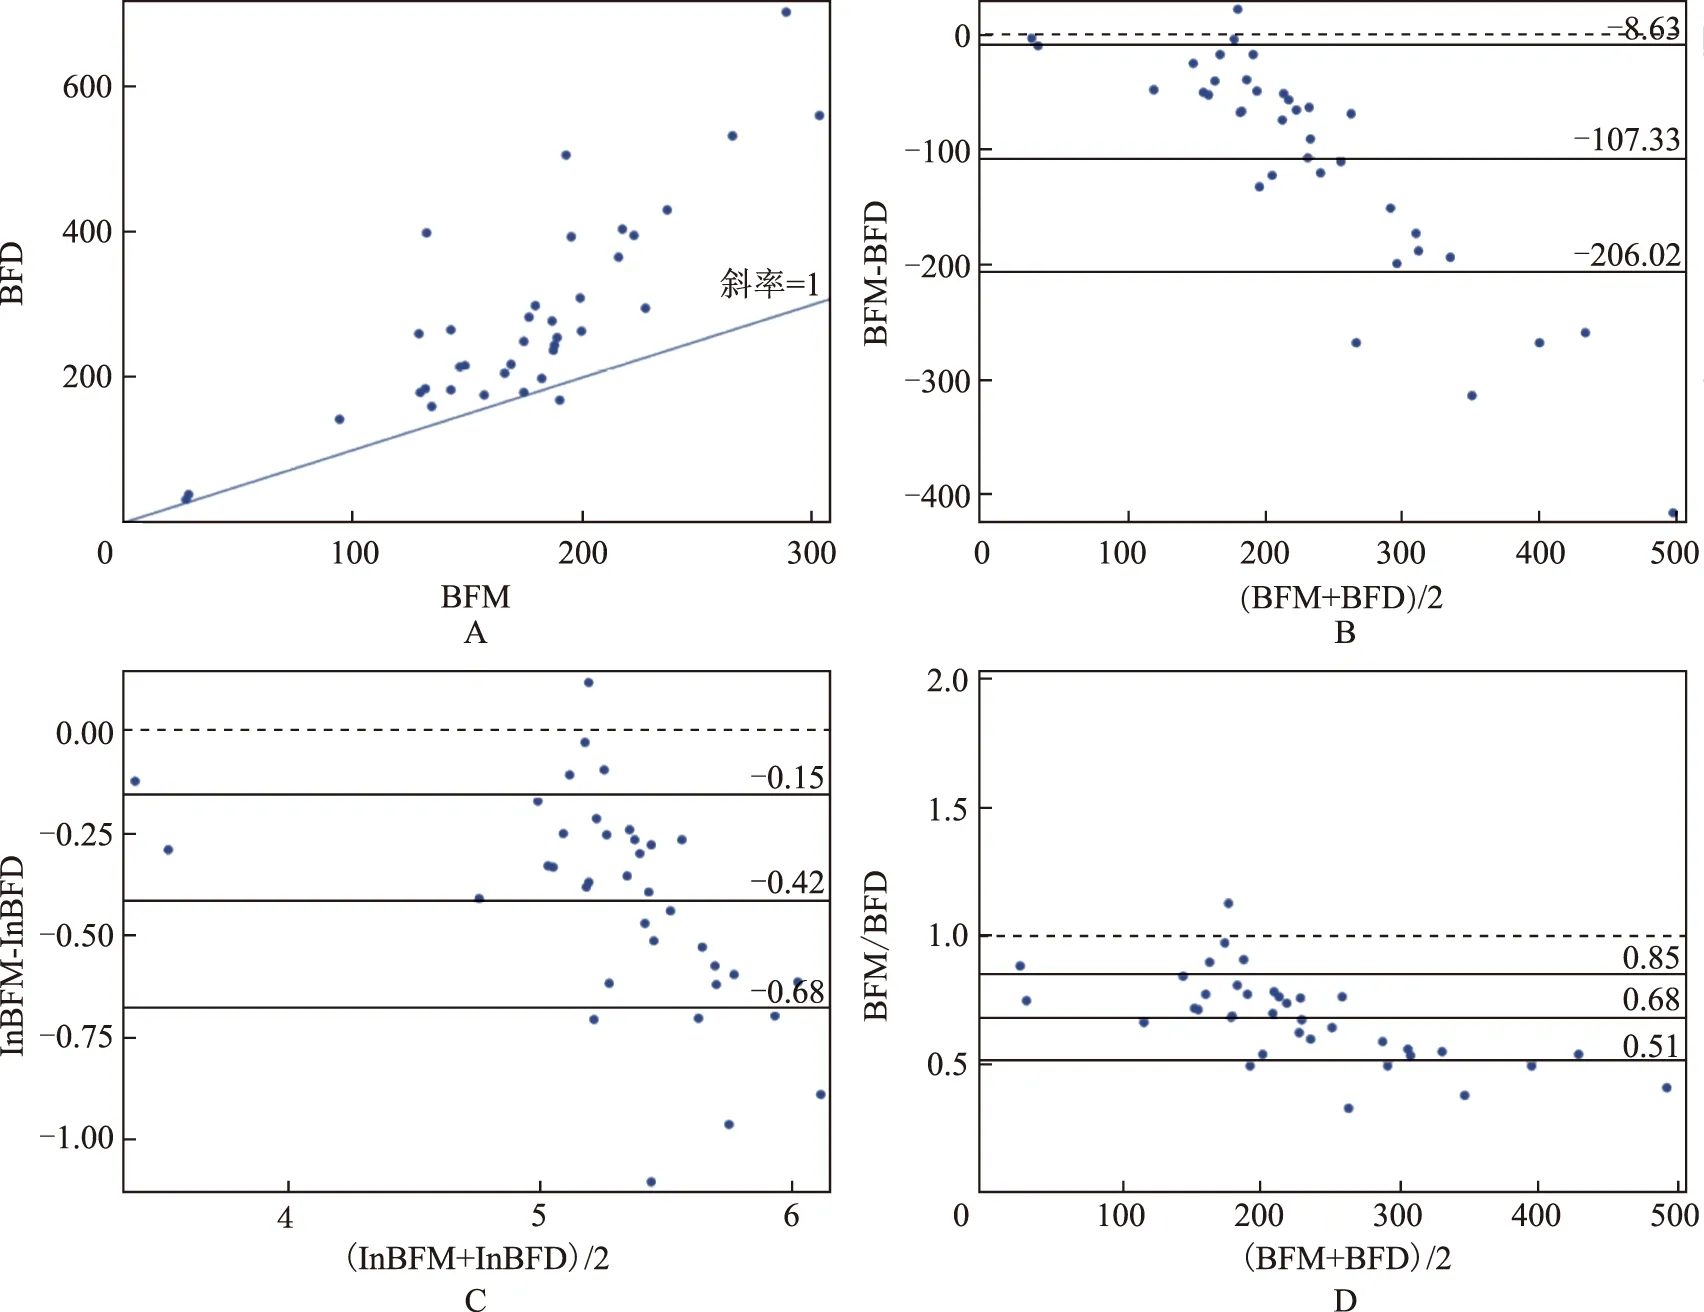
A.BFM与BFD一致性图,大部分数据都在y=x线上方;B.Bland-Altman一致性点图,0为完全一致性,中间连续的实线为平均差,外边的两条线表现95%一致性界限;C.经对数转换的lnBFM及lnBFD之间的一致性分析,0为完全一致性,中间连续的实线为平均差,外边的两条线表现95%一致性界限;D.BFM/BFD的一致性分析,1为完全一致性,中间连续的实线为平均差,外边的两条线表现95%一致性界限
A.BFM and BFD agreement diagram:the majority of data points lie above the line of equality (y= x);B.Bland-Altman agreement plot of the difference between the BFM and BFD,against their mean values (0:line of perfect agreement;thick continuous line in the middle:the mean difference;outer lines:95% limits of agreement);C.Bland-Altman agreement plot of the difference between the ln-transformed BFM (ln BFM) and BFD (lnBFD),against their mean values (0:line of perfect agreement;thick continuous line in the middle:the mean difference;outer continuous lines:95% limits of agreement);D. Bland-Altman agreement plot of the difference between the BFM/BFD ratios,against their mean values (1:line of perfect agreement;thick continuous line in the middle:the mean difference;outer continuous lines:95% limits of agreement)
图3 胰腺神经内分泌肿瘤血流参数的一致性
Fig 3 Agreement diagram of blood flow of pancreatic neuroendocrine tumor
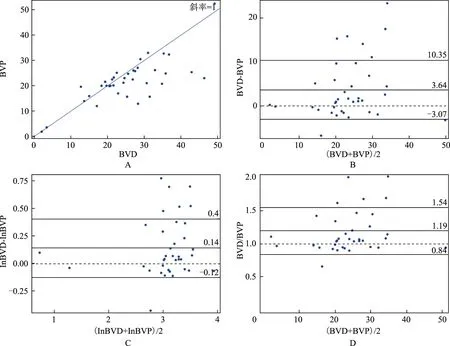
A.BVD与BVP的一致性图,大部分数据都在y=x线下方;B.Bland-Altman一致性点图,0为完全一致性,中间连续的实线为平均差,外边的两条线表现95%一致性界限;C.经对数转换的lnBVD及lnBVP之间的一致性分析,0为完全一致性,中间连续的实线为平均差,外边的两条线表现95%一致性界限;D.BVD/BVP的一致性分析,1为完全一致性,中间连续的实线为平均差,外边的两条线表现95%一致性界限
A.BVD and BVP agreement diagram:the majority of data points lie below the line of equality (y=x);B.Bland-Altman agreement plot of the difference between the BVD and BVP,against their mean values (0:line of perfect agreement;thick continuous line in the middle:the mean difference;outer continuous lines:95% limits of agreement);C.Bland-Altman agreement plot of the difference between the ln-transformed BVD (lnBVD) and BVP (lnBVP),against their mean values (0:line of perfect agreement;thick continuous line in the middle:the mean difference;outer continuous lines:95% limits of agreement);D.Bland-Altma agreement plot of the difference between the BVD/BVP ratios,against their mean values (1:line of perfect agreement;thick continuous line in the middle:the mean difference;outer continuous lines:95% limits of agreement)
图4 胰腺神经内分泌肿瘤血容量参数的一致性
Fig 4 Agreement diagram of blood volume of pancreatic neuroendocrine tumor
本研究Spearman’s 相关系数分析结果显示,胰腺癌和pNET两种方法所测得的灌注参数间均有显著相关性。以往研究亦显示两种灌注测量方法在食管癌及肺内结节中也具有较高的相关性[14,18]。本研究采用Bland-Altman法评价了两种测量方法的一致性,结果显示,pNET BFM/BFD和BVD/BVP的几何均数及其95%LOA分别为0.66(0.51~0.86)和1.15(0.88~1.50),BFM/BFD和BVD/BVP的均数及其95%LOA分别为0.68(0.51~0.85)和1.19(0.84~1.54);胰腺癌BFM/BFD和BVD/BVP的几何均数及其95%LOA分别为0.77(0.61~0.99)和1.42(1.13~1.79),BFM/BFD和BVD/BVP均数及其95%LOA分别为0.80(0.53~1.07)和1.46(1.10~1.81)。两者之间转换范围较小,所以在两种方法之间可以相互替换。与Djuric-Stefanovic 等[14]研究不同,后者研究认为两种灌注测量方法在食管癌灌注参数的测量中不能相互交换,其应用灌注后处理软件采用Deconvolution方法自动测量与手动Maximum slope方法测量比较,而本研究均采用灌注后处理软件自动进行两种不同计算方法的测量,推测这可能存在一定的影响。
本研究存在以下局限性:(1)只有1名放射科医生进行数据测量,不能保证数据及结果的可重复性,可能对结果有一定的影响。(2)采用80kV的扫描管电压,可能对Patlak方法测量结果有一定的影响,但是可以相应地降低患者的辐射剂量。
综上,本研究结果显示,由Deconvolution及Maximum slope+Patlak方法所测得的pNET及胰腺癌灌注参数BF、BV之间存在明显差异,Deconvolution方法测量的BF、BV值均高于Maximum slope+Patlak方法所得,两者之间具有明显的相关性且转换范围较窄,所以可以相互转换。
[1]Bronstein YL,Loyer EM,Kaur H,et al. Detection of small pancreatic tumors with multiphasic helical CT[J]. AJR Am J Roentgenol,2004,182(3):619- 623.
[2]Ricci C,Casadei R,Taffurelli G,et al. WHO 2010 classification of pancreatic endocrine tumors. Is the new always better than the old[J]. Pancreatology,2014,14(6):539- 541.
[3]d’Assignies G,Couvelard A,Bahrami S,et al. Pancreatic endocrine tumors:tumor blood flow assessed with perfusion CT reflects angiogenesis and correlates with prognostic factors[J]. Radiology,2009,250(2):407- 416.
[4]Delrue L,Blanckaert P,Mertens D,et al. Assessment of tumor vascularization in pancreatic adenocarcinoma using 128-slice perfusion computed tomography imaging[J]. J Comput Assist Tomogr,2011,35(4):434- 438.
[5]Miles KA,Lee TY,Goh V,et al. Current status and guidelines for the assessment of tumour vascular support with dynamic contrast-enhanced computed tomography[J]. Eur Radiol,2012,22(7):1430- 1441.
[6]Park MS,Klotz E,Kim MJ,et al. Perfusion CT:noninvasive surrogate marker for stratification of pancreatic cancer response to concurrent chemo-and radiation therapy[J]. Radiology,2009,250(1):110- 117.
[7]Tsuji Y,Hamaguchi K,Watanabe Y,et al. Perfusion CT is superior to angiography in predicting pancreatic necrosis in patients with severe acute pancreatitis [J]. J Gastroenterol,2010,45(11):1155- 1162.
[8]Kandel S,Kloeters C,Meyer H,et al. Whole-organ perfusion of the pancreas using dynamic volume CT in patients with primary pancreas carcinoma:acquisition technique,post-processing and initial results[J]. Eur Radiol,2009,19(11):2641- 2646.
[9]Delrue L,Blanckaert P,Mertens D,et al. Tissue perfusion in pathologies of the pancreas:assessment using 128-slice computed tomography[J]. Abdom Imaging,2012,37(4):595- 601.
[10]Grözinger G,Grözinger A,Horger M. The role of volume perfusion CT in the diagnosis of pathologies of the pancreas[J]. Rofo,2014,186(12):1082- 1093.
[11]薛华丹,金征宇,刘炜,等. 正常胰腺及胰岛细胞瘤的多层螺旋CT灌注参数特征[J]. 中国医学科学院学报,2006,28(1):68- 70.
[12]Petralia G,Preda L,D’Andrea G,et al. CT perfusion in solid-body tumours. Part Ⅰ:Technical issues[J]. Radiol Med,2010,115(6):843- 857.
[13]Kaufmann S,Schulze M,Horger T,et al. Reproducibility of VPCT parameters in the normal pancreas:comparison of two different kinetic calculation models [J]. Acad Radiol,2015,22(9):1099- 1105.
[14]Djuric-Stefanovic A,Saranovic DJ,Masulovic D,et al. Comparison between the deconvolution and maximum slope 64-MDCT perfusion analysis of the esophageal cancer:is conversion possible[J]. Eur J Radiol,2013,82(10):1716- 1723.
[15]Xu J,Liang Z,Hao S,et al. Pancreatic adenocarcinoma:dynamic 64-slice helical CT with perfusion imaging[J]. Abdom Imaging,2009,34(6):759- 766.
[16]Goh V,Halligan S,Bartram CI. Quantitative tumor perfusion assessment with multidetector CT:are measurements from two commercial software packages interchangeable[J]. Radiology,2007,242(3):777- 782.
[17]Bisdas S,Konstantinou G,Surlan-Popovic K,et al. Dynamic contrast-enhanced CT of head and neck tumors:comparison of first-pass and permeability perfusion measurements using two different commercially available tracer kinetics models[J]. Acad Radiol,2008,15(12):1580- 1589.
[18]Sun Y,Yang M,Mao D,et al. Low-dose volume perfusion computed tomography (VPCT) for diagnosis of solitary pulmonary nodules[J]. Eur J Radiol,2016,85(6):1208- 1218.
Characteristics of CT Perfusion Parameters of Focal Pancreatic Lesions and Data Comparison of Different Algorithms
LI Ping,ZHU Liang,XUE Huadan,LIU Changyi,XU Kai,LI Juan,SUN Ting,JIN Zhengyu
Department of Radiology,PUMC Hospital,CAMS and PUMC,Beijing 100730,China
XUE Huadan Tel:010- 69155509,E-mail:bjdanna95@hotmail.com
Objective To characterize the CT perfusion parameters of focal pancreatic lesions including pancreatic cancers (PACs) and pancreatic neuroendocrine tumors (pNETs),estimate the confirmity and fungibility of parameters obtained from Deconvolution and Maximum slope+Patlak.Methods From December 2015 to November 2016,22 patients with PACs and 22 patients with pNETs(37 lesions confirmed by surgery and biopsy)underwent preoperative whole-pancreas CT perfusion in our center. The volume perfusion CT of the entire pancreas was performed at 80 kV and 100 mA,using 28 consecutive volume measurements and intravenous injection of 45 ml of iodinated contrast and saline at a flow rate of 5 ml/s. One experienced radiologists measured and recorded the CT perfusion parameters on Siemens post-processing workstation using two mathematical methods:Maximum slope+Patlak analysis versus Deconvolution method.Results Wilcoxon matched-pairs test revealed significant difference between both pairs of the perfusion measurements by the two methods,PACs(BFMvs. BFD,Z=-3.263,P=0.001;BVDvs. BVP,Z=-3.978,P=0.000); pNETs(BFMvs. BFD,Z=-5.212,P=0.000;BVDvs. BVP,Z=-2.633,P=0.008). Spearman’s correlation coefficient showed both pairs of perfusion measurements significantly correlated with each other in PACs (BFMvs. BFD,r=0.845,P=0.000;BVDvs. BVP,r=0.964,P=0.000) and pNETs(BFMvs. BFD,r=0.759,P=0.000),BVDvs. BVP,r=0.683,P=0.000). Geometric mean BFM/BFD ratio in PACs was 0.77 (range:0.61- 0.99),while geometric mean BVD/BVP ratio was 1.42 (range:1.13-1.79),within 95% limits of agreement. Geometric mean BFM/BFD ratio in pNETs was 0.66 (range:0.51- 0.86),while geometric mean BVD/BVP ratio was 1.15 (range:0.88-1.50),within 95% limits of agreement. Conclusions Significantly different CT perfusion values of blood flow and blood volume were obtained by Deconvolution-based and Maximum slope+Patlak-based algorithms in the pNETs and PACs. They correlated significantly with each other. Two perfusion-measuring algorithms are interchangeable because the ranges of the conversion factors are narrow.
pancreatic solid lesions;CT perfusion;Deconvolution;Maximum slope+Patlak
国家自然科学基金(81371608)和卫生公益性行业科研专项项目(201402001、201402019)Supported by the National Natural Sciences Foundation of China (81371608) and the Health Industry Special Scientific Research Project (201402001,201402019)
薛华丹 电话:010- 69155509,电子邮件:bjdanna95@hotmail.com
R445
A
1000- 503X(2017)01- 0080- 08
10.3881/j.issn.1000- 503X.2017.01.014
2016- 10- 10)