T Cell Repertoire Diversity Is Decreased in Type 1 Diabetes Patients
2017-01-11YinTongZhoufangLiHuaZhangLigangXiaMengZhangYingXuZhanhuiWangMichaelDeemXiaojuanSunJiankuiHe
Yin TongZhoufang LiHua ZhangLigang XiaMeng Zhang Ying XuZhanhui WangMichael W.DeemXiaojuan Sun* Jiankui He*j
1Department of Biology,South University of Science and Technology of China,Shenzhen 518055,China
2Department of Endocrinology,Zhujiang Hospital,Southern Medical University,Guangzhou 510280,China
3Department of Gastrointestinal Surgery,Shenzhen People’s Hospital,the Second Clinical Medical College of Jinan University, Shenzhen 518020,China
4Department of Infectious Diseases and Hepatology Unit,Nanfang Hospital,Southern Medical University,Guangzhou 510515, China
5Departments of Bioengineering and Physics&Astronomy,Rice University,Houston,TX 77005,USA
6Shenzhen Tumor Immune-Gene Therapy Clinical Application Engineering Lab,Biobank of the Second People’s Hospital,the First Affliated Hospital of Shenzhen University,Shenzhen 518035,China
ORIGINAL RESEARCH
T Cell Repertoire Diversity Is Decreased in Type 1 Diabetes Patients
Yin Tong1,#,a,Zhoufang Li1,#,b,Hua Zhang2,#,c,Ligang Xia3,#,d,Meng Zhang1,e, Ying Xu4,f,Zhanhui Wang4,g,Michael W.Deem5,h,Xiaojuan Sun6,*,i, Jiankui He1,*,j
1Department of Biology,South University of Science and Technology of China,Shenzhen 518055,China
2Department of Endocrinology,Zhujiang Hospital,Southern Medical University,Guangzhou 510280,China
3Department of Gastrointestinal Surgery,Shenzhen People’s Hospital,the Second Clinical Medical College of Jinan University, Shenzhen 518020,China
4Department of Infectious Diseases and Hepatology Unit,Nanfang Hospital,Southern Medical University,Guangzhou 510515, China
5Departments of Bioengineering and Physics&Astronomy,Rice University,Houston,TX 77005,USA
6Shenzhen Tumor Immune-Gene Therapy Clinical Application Engineering Lab,Biobank of the Second People’s Hospital,the First Affliated Hospital of Shenzhen University,Shenzhen 518035,China
Diversity;
High-throughput
sequencing;
Immune repertoire;
T cell receptor;
Type 1 diabetes
Type 1 diabetesmellitus(T1D)is an immune-mediated disease.The autoreactive T cells in T1D patients attack and destroy their own pancreatic cells.In order to systematically investigate the potential autoreactiveT cell receptors(TCRs),we used a high-throughputimmune repertoiresequencing technique to profle the spectrum of TCRs in individual T1D patients and controls. We sequenced the T cell repertoire of nine T1D patients,four type 2 diabetes(T2D)patients,and six nondiabetic controls.The diversity of the T cell repertoire in T1D patients was signifcantly decreased in comparison with T2D patients(P=7.0E-08 for CD4+T cells,P=1.4E-04 for CD8+T cells)and nondiabetic controls(P=2.7E-09 for CD4+T cells,P=7.6E-06 for CD8+T cells).Moreover,T1D patients had signifcantly more highly-expanded T cell clones than T2D patients(P=5.2E-06 for CD4+T cells,P=1.9E-07 for CD8+T cells)and nondiabetic controls(P=1.7E-07 for CD4+T cells,P=3.3E-03 for CD8+T cells).Furthermore,we identifed a group of highly-expanded T cell receptor clones that are shared by more than two T1D patients.Although further validation in larger cohorts is needed,our data suggest that T cell receptor diversity measurements may become a valuable tool in investigating diabetes,such as using the diversity as an index to distinguish different types of diabetes.
Introduction
Type 1 diabetes mellitus(T1D)is an autoimmune disease characterized by infltration of leukocytes into the islets of the pancreas,resulting in progressive pancreatic β-cell destruction and loss of insulin production[1-3].The infltrating cells are a heterogeneous population,composed mainly of CD4+and CD8+T lymphocytes,as well as some B lymphocytes,macrophages,and dendritic cells[4-7].The most direct evidence of the pathogenic role of T cells in T1D is from the biobreeding rat and the nonobese diabetic(NOD)mouse models[8,9]. Extensive studies in mouse models have demonstrated that T cells play crucial roles in the pathogenesis of T1D,as the disease can be transferred by T cell clones or a heterogeneous T cell population[10-12].For example,Wicker et al.transferred splenocytes of NOD mice to young mice.Consequently these recipient mice develop diabetic at a higher frequency and at a younger age than their controls[10].Notably,CD4+and CD8+T cell subpopulations play different roles in the process of T1D initiation.CD4+T cells mostly recognize insulin and are the main cellular effectors,whereas CD8+cytotoxic T cells recognize peptide epitopes presented on the β cell surface and directly contribute to β cell death[13,14].
The diversity of the T cell immune repertoire is critical in maintaining an effective immune response,and decreased diversity of the T cell immune repertoire has been linked to several autoimmune diseases,such as rheumatoid arthritis [15]and multiple sclerosis[16,17]and aging[18].
Over the past two decades,researchers have shown that restricted T cell expansion and reduced T cell diversity in pancreatic islets is a common phenomenon in T1D.In early work, the biased usage of some T cell receptor(TCR)gene segments was found in islet-infltrated T cells[19].In 2009,Li et al.[19] performed single-cell PCR to analyze the TCR sequences of 218 T cells in NOD mice and discovered a restricted repertoire dominated by one or two clones,suggesting the monoclonal expansion of T cells in pancreatic islets of NOD mice[20]. In 2011, another group cloned 139 different TCR complementarity-determining region 3(CDR3)sequences and revealed the monoclonal expansion of T cells in human pancreatic islets[21].These studies mainly used traditional cloning and sequencing methods to identify TCRs when examining the T cell composition in the islet infltrate in T1D.However,this traditional approach has some limitations in studying TCR restriction.For example,the size of the TCR repertoire in a human being is estimated to be as many as 107clones, whereas current cloning and sequencing can only identify a few hundreds of sequences[22],which only account for a tiny fraction of the total repertoire.Therefore,the overall diversity of the TCR repertoire in T1D patients has not been studied yet,due to the technical limitations.
Here,we applied a recently-developed high-throughput immune repertoire sequencing technique to investigate the T cell immune repertoire diversity in T1D patients.Immune repertoire sequencing is a powerful technique which is able to sequence millions of TCR or B cell receptor sequences in parallel in a single sample[23-26].We sequenced an average of 105TCR sequences per sample,which covers all the dominant TCR clones in the sample.By analyzing a large number of TCR sequences,we characterized the overall diversity of the immune repertoire,V gene usage bias,VDJ recombination pattern,and CDR3 length distribution in both CD4+and CD8+T cell subtypes.We also identifed common T cell clones that are shared by multiple T1D patients.Considering TCRs and human leukocyte antigen(HLA)are closely related, we also investigated HLA genotyping in some T1D patients.
Results
Nine T1D patients,four T2D patients,and six nondiabetic controls were recruited for this study.Peripheral blood mononuclear cells(PBMCs)were isolated from blood samples to sort CD4+and CD8+T cells.Multiplex PCR was performed to amplify the CDR3 regions for construction of libraries,which were sequenced on the Illumina HiSeq 2000/Miseq platform.Sequencing reads were analyzed using our in-house bioinformatics pipeline and the online ImMunoGeneTics(IMGT)/HighV-QUSET tool[27,28].
A total of 16,376,727 merged sequencing reads were obtained from raw sequencing data.Sequencing reads were aligned against the reference sequences of genes encoding human T cell receptor beta variable(TRBV),diversity (TRBD),and joining(TRBJ)[29].Reads with a high identity score(>70%)were selected and identifed as TCRβ chain sequences.As a result,we identifed 4,875,520 TCRβ sequencing reads from control samples,4,738,895 reads from T2D samples,and 1,500,011 reads from T1D samples,respectively.
Relatively more highly-expanded T cell clones found in T1D
TCR clones with frequency≥1%of total reads in a sample were defned as highly-expanded clones(HECs).As shown in Figure 1 and Figure S1,T1D patients have more HECs compared to T2D and control samples for both CD4+and CD8+T cells(Figure 1A and B).In the CD4+T cell population,T1D patients have 22 HECs(median,range of 12-28), which is much higher than those in T2D(median of 1 HEC,range 0-2)and control samples(Figure 1C).As shown in Figure 1D,HECs accounted for 77%of total sequencing reads in the T1D patients(median,range 52%-88%),which is much higher than those in T2D patients(median of 3.9%,range 0-6.8%)and controls(median of 1.7%,range 0-5.7%). Similar trend was also observed in the CD8+T cell population (Figure 1F and G).
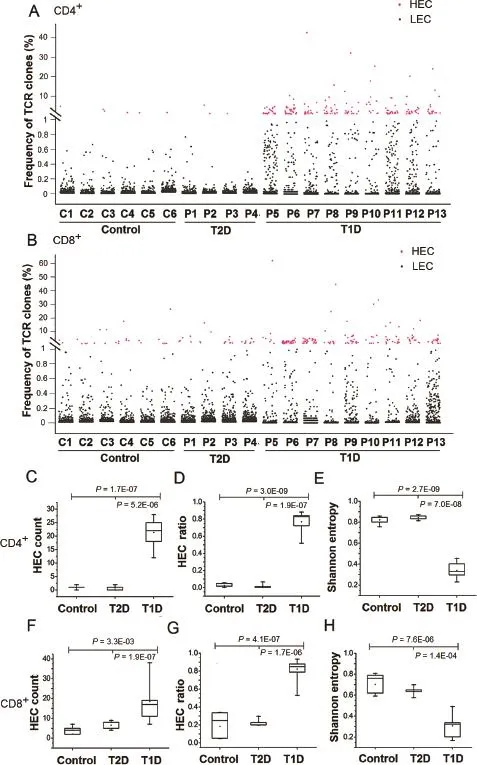
Figure 1 HECs and diversity in T1D
We applied a normalized Shannon entropy index to quantitativelymeasurethediversityoftheentireTCRrepertoireindifferent groups[30].The normalized Shannon entropy index ranges from 0 to 1,in which‘1”indicates the most diversity and‘0”indicates no diversity at all.The normalized Shannon entropy of T1D samples was signifcantly lower than that of T2D and control samples for both CD4+(Figure 1E)and CD8+T cells(Figure 1H).These data indicate that the overall diversity of the entire TCR repertoire of T1D patients is significantlydecreasedcomparedwithT2Dandnondiabeticcontrols.
Collectively,these fndings show that although thousands of TCR clones were observed in T1D,the TCR repertoire of T1D is dominated by a few HECs.Our results are consistent with previous studies using T1D mouse models,in which HECs are frequently observed in islet-infltrating T cells [31-33].The signifcant difference in the number and percentage of HECs between T1D and T2D samples indicates that the quantifcation of HECs and diversity could be a potential indicator of T1D.
Shared TCR clones among T1D samples
The second fnding in our study is that several HECs observed in one T1D patient were also observed in other T1D patients. In CD4+T cells,4 HECs are expressed in all T1D samples tested and 52 HECs are detected in over half of the samples. In CD8+T cells,2 HECs are expressed in all T1D samples tested and 36 HECs are detected in over half of the samples. These data suggest that T1D patients share some common HECs.The shared or common T cells are of long-term interest both in health and disease[34].To investigate the possible common TCRs that are shared in T1D pathogenesis,we analyzed the CDR3 amino acid sequence of all HECs in all the samples tested.The HECs were then ranked according to the number of patients sharing these HECs(Figure 2).As a result, we observed two types of HECs.The frst type of HECs were HECs shared in T1D samples,which are present but not identifed as HECs in T2D or control samples.For example,the TCR CDR3 sequence ASRTGAGTDGYT was observed as a HEC in CD4+T cells of four T1D patients(frst row,shown in orange in the left panel,Figure 2A).Although this sequence is also present in T2D and control samples,it is not classifed as a HEC(shown in gray or green)in any T2D(middle panel) or control samples(right panel,Figure 2A).The second type of HEC is unique to T1D samples,which are not observed in any T2D or control sample.For example,the TCR clone CDR3 sequence ASSEAGTGSYSPLH is classifed as a HEC in two T1D patients(15th row,shown in orange in the left panel), but it is not present in any of the T2D or control samples (shown in gray in the middle and right panels,Figure 2A). Among the total 185 observed CDR3 HECs(by amino acid sequences)in CD4+T cells,the frst type accounts for 32.4%,whereas the remaining 67.3%falls into the second category,which is only observed in T1D samples. In CD8+T cells,there are totally 203 observed CDR3 amino acid HECs,including 43.8%for the frst type and 56.2%for the second type(Figure 2B).It should be noted that we only have a limited number of control and T2D samples included in this study.Some of the second type HECs may turn out to be the frst type HECs,if more T2D and control samples could be sequenced in future.
V and J gene usage in T1D samples
To identify potential V or J gene usage bias in T1D samples, we then investigated the germline gene usage in T1D and T2D patient as well as nondiabetic control samples(Figure 3). Our data showed that the V gene family usage pattern was very similar between the control and T2D patient samples.However,the V gene family usage patterns of T1D patients were highly heterogeneous in CD4+T cells(Figure 3A).This heterogeneity may be explained by the observation that different T1D patients have different HECs(Figure 2).For the CD8+T cells,T1D,T2D,and control samples all display a heterogeneous pattern(Figure 3A).Similar phenomenon is also observed in J gene usage for both CD4+and CD8+T cells(Figure 3B).We then performed statistical analysis to identify any V gene families that were signifcantly overused in T1D.Consequently,we observed V gene usage biases in different samples.The V and J gene usage pattern of control and T2D samples were highly correlated,particularly in CD4+T cells(Figure 3C).The average correlation between any 2 samples in control and T2D groups was 0.97(Figure 3D).Conversely,the T1D samples displayed less correlation in V and J gene usage pattern,probably due to patient-specifc clonal expansion.
The skewed clonotype composition in T1D samples is also observed in the global VJ combination.The global VJ combination usage of three representative samples is shown in Figure 4.CD8+T cells in the control(C5)and T2D(P4) samples display high diversity of immune repertoire that is represented by a broad usage of VJ combinations(Figure 4A and B).On the other hand,the T1D sample(P12) has a dominant VJ combination(TRBV15 and TRBJ2-5), which accounts for 27.5%of total reads.The HEC sequence which corresponds to protein sequence ATAGLAGETQY is present in this dominant VJ combination,indicating a strong clonal expansion(Figure 4C).The global VJ combination usage of all samples is shown in Figure S2.The comprehensive analysis of V gene usage and VJ combinations in T1D samples is shown in Figures S3 and S4,respectively.
Skewed CDR3 length distribution in T1D
CDR3 length infuences the structure of TCRs,in which one amino acid differences can lead to conformational remodeling of the receptor[22].Hence,we perform the statistical analysis of the length distribution of CDR3 here.The CDR3β length distribution of T1D displays a distorted pattern in both CD4+and CD8+T cells(Figure 5).The T2D and control samples have a Gaussian distribution of CDR3β length.However,distorted distribution of CDR3β length is observed in the T1D samples.This provides further evidence that the immune repertoires of T1D patients are skewed,probably owing to patient-specifc clonal expansion.
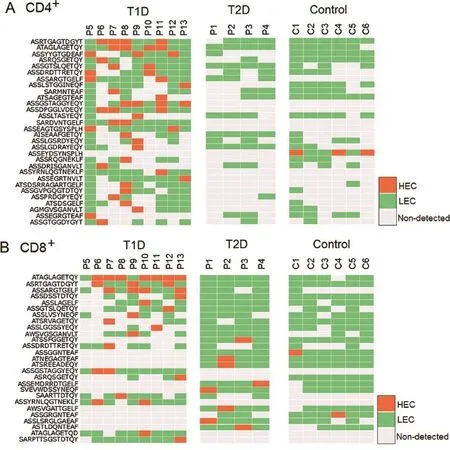
Figure 2 Shared HECs are detected in different T1D patients
PCR amplifcation bias validation
As the full repertoire of TCR is amplifed by multiple PCR primers,differences in amplifcation effciency can affect the real amount of individual TCRs.So frst of all,we need to validate the primers amplifcation level to make sure the designed primer set have similar amplifcation effcacy.We validated the TCRβ primers of their amplifcation effciency using a method developed by Robins et al.[35]with detailed procedure described previously[22].We amplifed the same DNA extracted from T cells of one individual by using the same primer set with 15,20 and 25 PCR cycles respectively,and compared the number of reads for the same TCR clones(Figure 6). We observed a linear correlation between the numbers of reads obtained(106,999 reads for the 15-cycle amplifcation and 703,443 reads for the 25-cycle amplifcation;Figure 6A-C). For sequences observed with a given read number in the 15-cycle amplifcation,the variance of read number at25-cycle amplifcation could be due to the PCR bias.As shown in Figure 6D,the regression coeffcient k=2.09 represents the bias value after 10 PCR cycles from 15-cycle amplifcation to 25-cycle amplifcation.Therefore,a bias of average magnitude 1.07 was introduced in each PCR cycle,eventually resulting in a total accumulated variation about 2.09-fold after 10 more cycles(1.07610=2.09).However,the abundance of V gene usage of the 20-cycle amplifcation and that of the 25-cycle amplifcation are very similar,with 15%deviation for the top 20 V gene families on average.This result indicates that the effciency of the primers used are very close to each other, and the PCR bias are thus random events(Figure 6E).
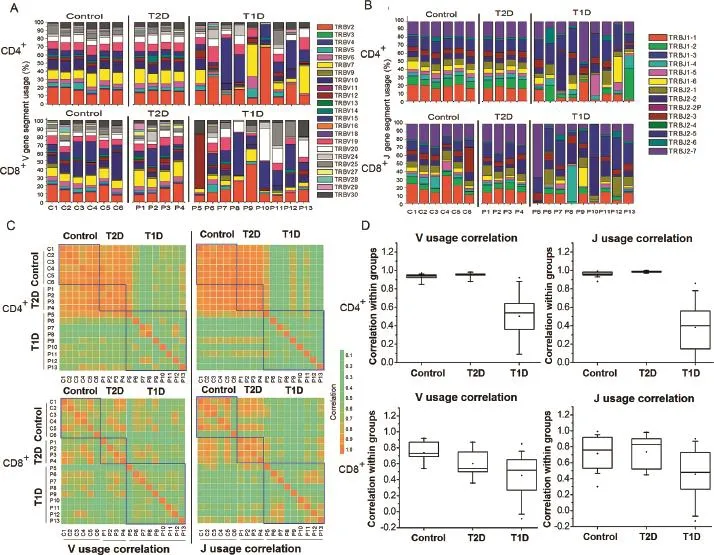
Figure 3 V and J gene usage analysis in T1D,T2D,and control samples
Discussion
We present here quantitative measurement of the TCR repertoire of T1D and T2D patients as well as nondiabetic controls. We observed a signifcant increase in highly-expanded TCR clones and decrease of TCR diversity in T1D patients.The increase in HECs is also observed in other autoimmune diseases,including systemic lupus erythematosus and rheumatoid arthritis[24],indicating that the increase of HECs may be a common phenomenon in autoimmune diseases.Our data suggest that the HECs could be used to distinguish autoimmune T1D from T2D and nondiabetic controls.Nonetheless,it should be noted that the number of patients in the current study is far from enough to distinguish the autoreactive T cells that are related to diabetes.To create the common clone and apply these fndings to T1D diagnosis,validation in a larger cohort with more patients is required.Here,our pilot study illustrates the application of the immune repertoire sequencing in screening the candidate common clones.
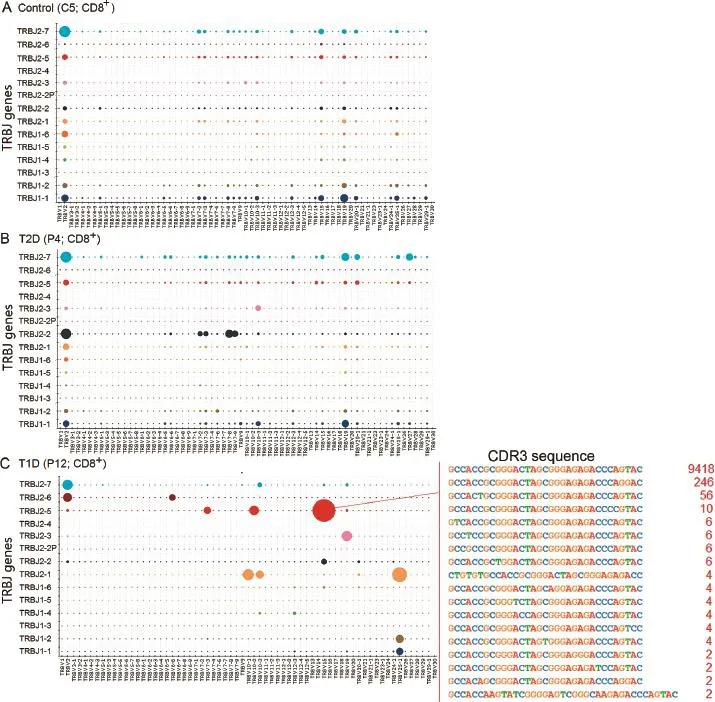
Figure 4 Entire VJ repertoire in CD8+cells for representative samples C5,P4,and P12
Interestingly,we observed the sharing of HECs between different T1D patients in this study.Circulation of isletinfltrating autoreactive T cells responsible for T1D onset in the peripheral blood had also been noticed by several other groups[36-38].Although functional assays were not performed to verify the targets of HECs in this study,a few HECs were shared by more than 3 T1D patients,suggesting that they may be derived from the autoreactive TCR immune response to common autoantigens in T1D.The combination of highthroughput screening and functional assay may facilitate the identifcation of autoreactive T cells.This study will facilitate the understanding of the pathogenesis of auto immune diseases, and help developing potential markers to diagnose the preclinical autoimmune disorders[39].Once the HEC library in T1D identifed in this study is validated by immunophenotyping or other methods,we can use mass spectrometry to identify the associated autoantigens that are not described previously.
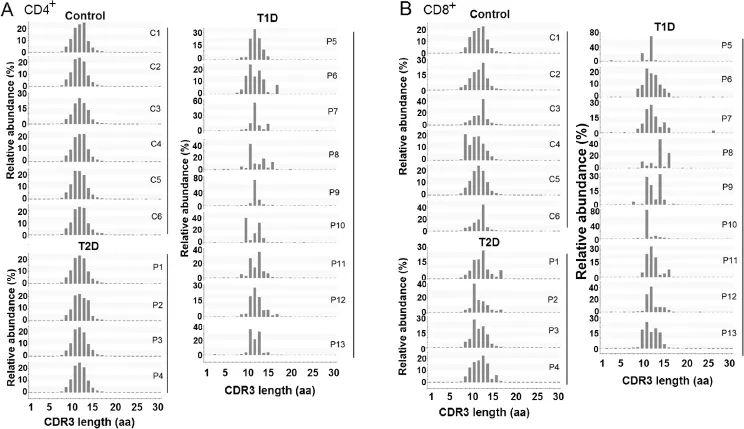
Figure 5 CDR3 amino acid length distribution
The shared HECs between T1D and controls may illustrate the origin of autoreactive TCRs.Two theoretical models could explain the origin of autoreactive TCRs[40,41].The frst model hypothesizes that the high-affnity T cells to the autoantigens in T1D patients may bypass the deletion process in thymus,migrate to the periphery,and become autoreactive T cells[40].According to this model,the autoreactive T cells in T1D should only exist in T1D patients and should not be observed in non-T1D patients.The second model proposed that both healthy individuals and T1D patients have autoreactive T cells,whereas only autoreactive T cells in T1D are triggered and react to autoantigen[41].From our data,we observed the co-existence of two types of HECs.The frst type of HECs observed in T1D exists also in controls,whereas the second type of HECs is observed in T1D patients only.Our results may thus suggest the co-existence of both models. There are slight differences in CD4+and CD8+T cells with regard to the HEC numbers,V gene usage pattern,and CDR3 length distribution,which may be associated with the different biological functions of these two types of T cells [42,43].However,the immune system is very sensitive to the environment and infection,e.g.,by fu in the past 2-3 weeks, which would result in some dominant clones[25].Although we obtained HECs that are shared in most T1D patients,careful validation need to be done before we can draw the conclusion that these HECs are really T1D-associated.
HLA/peptide complex and TCR binding determines the specifcity of immune response[44-46].HLA genotyping in 6 T1D patients(Table S1)indicated that alleles such as A*24∶02,B*58∶01∶01,C*03∶02,DRB1*03∶01,DRB1*09∶01∶02, DQB1*03∶02∶01,and DQB1*02∶01∶01 are frequently expressed in these patients,suggesting that these types of HLAs may play roles in T1D biogenesis.
TheimmunerepertoiresequencingintheT1Dsamplesopens anewvisionforinvestigationofT1Dandrelatedimmunedisorders.However,at present,the work is still on the initial stage. Consideringthemismatchinageandgenderofsubjectsbetween different groups may lead to bias in data interpretation,a larger patient size is needed to achieve a more solid conclusion.With more diabetic samples included in the similar work,as well as the follow-up experimental validation,animal model,and clinical data,the immune repertoire sequencing can provide new diagnostic and therapeutic markers for T1D.
In conclusion,deep sequencing of the CDR3 region of TCR populations using immune-repertoire sequencing can be a powerful tool to access the majority of TCR diversities in peripheral blood of both diabetic patients and controls.The large volume of TCR sequencing data allows us to obtain a snapshot of the entire repertoire.By quantitatively measuring the diversity of the immune repertoire,immune repertoire sequencing maybe helpful to narrow down the potential CDR3 sequences that are related to the autoreactive T cells in T1D.
Methods
Ethics
The study was performed according to the principle of declaration of Department of Endocrinology,Zhujiang Hospital of Southern Medical University,China.Study protocol was approved by the medical ethics committee of this university. All participants gave written informed consent.
Patients
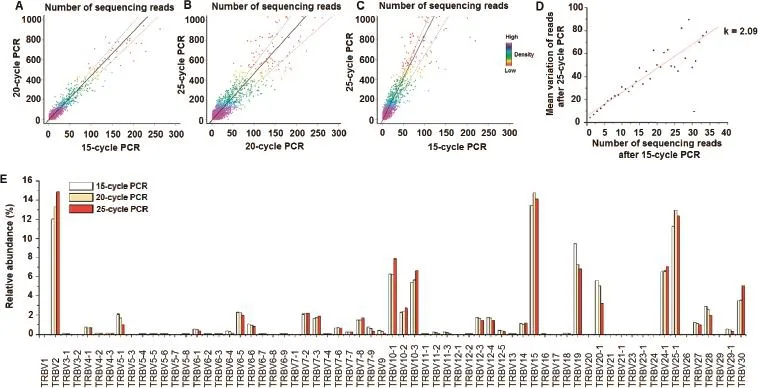
Figure 6 PCR bias assessment
Nine T1D patients,4 T2D patients,and 6 nondiabetic controls were included in this study.All diabetic patients fulflled the classifcation criteria for either T1D or T2D respectively (Table S2)[47].We acquired 10 ml of peripheral blood from all subjects.The glucose level and C-peptide concentration were calculated according to the methods recommended by the WHO (https://www.staff.ncl.ac.uk/philip.home/w-ho_ dmc.htm).To eliminate the potential infuence from other autoimmune disease or infection,we only selected the candidate samples from patients without other autoimmune diseases or infections in the past 4 weeks.
HLA genotyping
Five major HLA types,namely,HLA-A,HLA-B,HLA-C, HLA-DRB1,and HLA-DQB1,were tested for patient genotyping.Briefy,2 ml of human blood samples were collected inEDTA anticoagulanttubeandDNA sampleswere extracted.The resulting genomic DNAs were sent to CapitalBio Technology(Beijing,China)for PCR amplifcation. The PCR condition used is:heating at 96°C for 3 min,35 cycles of denaturation at 96°C for 25 s,annealing at 62°C for 45 s,and extension at 72°C for 45 s,and then a fnal extension at 72°C for 5 min.The remaining primers in the PCR products were then digested by incubation with ExoI at 37° C for 15 min.Afterward,ExoI was inactivated by incubation at 80°C for 20 min.PCR products were then purifed and sequenced usinghigh-resolution ABI3730XL sequencer (Applied Biosystems,Tampa,CA).Sequencing results were analyzed using ATF genotyping software(Conexio Genomics, Fremantle,Australia).
Isolation of PBMCs,CD4+,CD8+T cells
We used LymphoPrepTM(Axis-shield,Dundee,Scotland,UK) to isolate PBMCs as described previously[22].CD4+and CD8+T cells were isolated from PBMCs using magnetic microbeads according to the manufacturer’s instructions(Miltenyi Biotec,Bergisch Gladbach,Germany,Cat.No.:130-045-101 and 130-045-201).Firstly,PBMCs were aliquoted into 2 eppendorf tubes and incubated with either CD4 MicroBeads or CD8 MicroBeads for 15 min at 4°C in the dark to magnetically label the CD4+T cells and CD8+T cells,respectively. Then,the cell suspensions were loaded onto a MACS column and placed in the magnetic feld of a MACS separator(Miltenyi Biotec, Bergisch Gladbach, Germany). The magnetically-labeled CD4+and CD8+T cells were retained within the column while the unlabeled cells run through the column.The magnetically-retained T cells in the column were then eluted as the positively-selected cell fraction.
TCRβ primer design and validation
HumanTCRβsequences(GenBankaccessionNo.NG_001333) were downloaded from the international IMGT database[28]. We designed multiple primers for the TCRβ sequences and validated the primers using the similar method as described previously[22].Primer sequences are listed in Table S3.
Sequencing library preparation
To prepare the TCRβ sequencing library,we performed multiplex PCR to amplify the CDR3 region of the TCRβ gene using the primer set with 30 forward primers and 13 reverse primers as described in Table S3.Genomic DNA isolated from CD4 or CD8 T cell subsets was used as template for PCR amplifcation.PCR products were purifed using AMPure XP beads (Beckman Coulter,Indianapolis,IN,Cat.No.A63881)to remove PCR primers and other impurities.Sequencing indices and adaptors were added to the immune library at the second round of PCR.The PCR conditions for adding indices were heating at 98°C for 1 min,followed by 25 cycles of denaturation at 98°C for 20 s,annealing at 65°C for 30 s,and extension at 72°C for 30 s,with a fnal extension at 72°C for 7 min.PCR products were then subjected to gel electrophoresis for separation and the corresponding bands were excised for DNA purifcation by using QIAquick Gel Extraction Kit (Qiagen,Hilden,Germany).The resulting DNA was used as the library for sequencing on the Illumina HiSeq 2000/Miseq sequencing platform(Illumina,San Diego,CA).
Data analysis
A total of 18,976,912 pair-end reads were generated by the Illumina sequencing platform(Table S4).We used FLASH software[48]to mergeoverlapping paired-end readsand obtained 16,376,727 raw reads.IgBLAST was used to perform the alignment of the merged reads to V,D,and J gene in germline references[49].The reference sequences of V,D,and J gene in germline were obtained from IMGT.Reads with low alignment identity(<70%)to germline references were excluded.After read fltering,11,114,426 reads were retained for further analysis.The starting and ending positions of the CDR3 region,reading frame,and productivity were identifed according to the defnition of IMGT[28].
We followed previous studies and defned that TCR clones with a frequency≥1%were considered to be HECs[24,50]. Normalized Shannon entropy was used as an index to evaluate the diversity of the TCR repertoire:

where p(xi)is the frequency of TCR clone,n represents the total number of TCR clones,and xiindicates a particular TCR clone.Unpaired 2-tailed t-test is applied to calculate the signifcance level of differences of Shannon entropy among T1D patients,T2D patients,and healthy controls.
We developed an online web server iRAP for immune repertoire analysis,which is freely available for public use and can beaccessed at http://www.sustc-genome.org.cn/ irap2/index.php.
Authors’contributions
ZL,JH,and LX designed the project.ZL,HZ,MZ,YX,ZW, andXS performedthe experiments.YTperformed allthebioinformatics analysis of data.YT,ZL,MWD,and JH wrote the manuscript.Allauthorsreadandapprovedthefnalmanuscript.
Competing interests
The authors have no conficts of interest to declare.
Acknowledgments
This study was supported by the National Natural Science Foundation of China(Grant Nos.31200688,81470136, 31401145,and 81372507).This study also received support from the International S&T Cooperation Program of China (Grant No.2014DFA31050).We thank the JinYu Medical Center for providing all the autoantibody tests for all patients.
Supplementary material
Supplementary material associated with this article can be found,in the online version,at http://dx.doi.org/10.1016/j. gpb.2016.10.003.
[1]Katz JD,Benoist C,Mathis D.T helper cell subsets in insulindependent diabetes.Science 1995;268:1185-8.
[2]Roep BO.The role of T-cells in the pathogenesis of Type 1 diabetes:from cause to cure.Diabetologia 2003;46:305-21.
[3]Cnop M,Welsh N,Jonas JC,Jo¨rns A,Lenzen S,Eizirik DL. Mechanisms of pancreatic β-cell death in Type 1 and Type 2 diabetes many differences,few similarities.Diabetes 2005;54: S97-107.
[4]Somoza N,Vargas F,Roura-Mir C,Vives-Pi M,Ferna´ndez-Figueras MT,Ariza A,et al.Pancreas in recent onset insulindependent diabetes mellitus.Changes in HLA,adhesion molecules and autoantigens,restricted T cell receptor V beta usage,and cytokine profle.J Immunol 1994;153:1360-77.
[5]Kelemen K.The role of T cells in beta cell damage in NOD mice and humans.Adv Exp Med Biol 2004;552:117-28.
[6]Haskins K.Pathogenic T-cell clones in autoimmune diabetes: more lessons from the NOD mouse.Adv Immunol 2005;87:123-62.
[7]Planas R,Carrillo J,Sanchez A,de Villa MC,Nunez F, Verdaguer J,et al.Gene expression profles for the human pancreas and purifed islets in type 1 diabetes:new fndings at clinical onset and in long-standing diabetes.Clin Exp Immunol 2010;159:23-44.
[8]Miyazaki A,Hanafusa T,Yamada K,Miyagawa J,Fujino-Kurihara H,Nakajima H,et al.Predominance of T lymphocytes in pancreatic islets and spleen of pre-diabetic non-obese diabetic (NOD)mice:a longitudinalstudy.Clin Exp Immunol 1985;60:622-30.
[9]Makino S.Genetic analysis of IDDM in NOD mice.Exp Anim 1998;47:suppl 107-9.
[10]Wicker LS,Miller BJ,Mullen Y.Transfer of autoimmune diabetesmellituswith splenocytesfrom nonobese diabetic (NOD)mice.Diabetes 1986;35:855-60.
[11]Bendelac A,Carnaud C,Boitard C,Bach JF.Syngeneic transfer of autoimmune diabetes from diabetic NOD mice to healthy neonates.Requirement for both L3T4+and Lyt-2+T cells.J Exp Med 1987;166:823-32.
[12]Roberts SA,Barbour G,Matarrese MR,Mason DL,Leiter EH, Haskins K,et al.Adoptive transfer of islet antigen-autoreactive T cellclonesto transgenicNOD.Ea(d)miceinducesdiabetesindicating a lack of I-E mediated protection against activated effector T cells.J Autoimmun 2003;21:139-47.
[13]Bottazzo GF,Dean BM,McNally JM,MacKay EH,Swift PG, Gamble DR.In situ characterization of autoimmune phenomena and expression of HLA molecules in the pancreas in diabetic insulitis.N Engl J Med 1985;313:353-60.
[14]Eizirik DL,Mandrup-Poulsen T.A choice of death-the signaltransduction of immune-mediated beta-cell apoptosis.Diabetologia 2001;44:2115-33.
[15]Wagner UG,Koetz K,Weyand CM,Goronzy JJ.Perturbation of the T cell repertoire in rheumatoid arthritis.Proc Natl Acad Sci U S A 1998;95:14447-52.
[16]Jiang H,Zhang SI,Pernis B.Role of CD8+T cells in murine experimental allergic encephalomyelitis.Science 1992;256:1213-5. [17]Zhang XM,Heber-Katz E.T cell receptor sequences from encephalitogenic T cells in adult Lewis rats suggest an early ontogenic origin.J Immunol 1992;148:746-52.
[18]Goronzy JJ,Qi Q,Olshen RA,Weyand CM.High-throughput sequencing insights into T-cell receptor repertoire diversity in aging.Genome Med 2015;7:117.
[19]Simone E,Daniel D,Schloot N,Gottlieb P,Babu S,Kawasaki E, et al.T cell receptor restriction of diabetogenic autoimmune NOD T cells.Proc Natl Acad Sci U S A 1997;94:2518-21.
[20]Li L,He Q,Garland A,Yi Z,Aybar LT,Kepler TB,et al.β cellspecifc CD4+T cell clonotypes in peripheral blood and the pancreatic islets are distinct.J Immunol 2009;183:7585-91.
[21]Codina-Busqueta E,Scholz E,Munoz-Torres PM,Roura-Mir C, Costa M,Xufre C,et al.TCR bias of in vivo expanded T cells in pancreatic islets and spleen at the onset in human type 1 diabetes. J Immunol 2011;186:3787-97.
[22]Li Z,Liu G,Tong Y,Zhang M,Xu Y,Qin L,et al.Comprehensive analysis of the T-cell receptor beta chain gene in rhesus monkey by high throughput sequencing.Sci Rep 2015;5:10092.
[23]Weinstein JA,Jiang N,White 3rd RA,Fisher DS,Quake SR. High-throughput sequencing of the zebrafsh antibody repertoire. Science 2009;324:807-10.
[24]Klarenbeek PL,de Hair MJ,Doorenspleet ME,van Schaik BD, Esveldt RE,van de Sande MG,et al.Infamed target tissue provides a specifc niche for highly expanded T-cell clones in early human autoimmune disease.Ann Rheum Dis 2012;71:1088-93.
[25]Jiang N,He J,Weinstein JA,Penland L,Sasaki S,He XS,et al. Lineage structure of the human antibody repertoire in response to infuenza vaccination.Sci Transl Med 2013;5:171ra19.
[26]Robins H.Immunosequencing:applications of immune repertoire deep sequencing.Curr Opin Immunol 2013;25:646-52.
[27]Li S,Lefranc MP,Miles JJ,Alamyar E,Giudicelli V,Duroux P, et al.IMGT/HighV QUEST paradigm for T cell receptor IMGT clonotype diversity and next generation repertoire immunoprofling.Nat Commun 2013;4:2333.
[28]Giudicelli V,Chaume D,Lefranc MP.IMGT/GENE-DB:a comprehensive database for human and mouse immunoglobulin and T cell receptor genes.Nucleic Acids Res 2005;33:D256-61.
[29]Lefranc MP,Giudicelli V,Ginestoux C,Bodmer J,Mu¨ller W, Bontrop R,et al.IMGT,the international ImMunoGeneTics database.Nucleic Acids Res 1999;27:209-12.
[30]Chao A,Shen TJ.Nonparametric estimation of Shannon’s index of diversity when there are unseen species in sample.Environ Ecol Stat 2003;10:429-43.
[31]Reijonen H,Mallone R,Heninger AK,Laughlin EM,Kochik SA, Falk B,et al.GAD65-specifc CD4+T-cells with high antigen avidity are prevalent in peripheral blood of patients with type 1 diabetes.Diabetes 2004;53:1987-94.
[32]Kent SC,Chen Y,Bregoli L,Clemmings SM,Kenyon NS, Ricordi C,et al.Expanded T cells from pancreatic lymph nodes of type 1 diabetic subjects recognize an insulin epitope.Nature 2005;435:224-8.
[33]Marrero I,Hamm DE,Davies JD.High-throughput sequencing of islet-infltrating memory CD4+T cells reveals a similar pattern of TCR Vbeta usage in prediabetic and diabetic NOD mice.PLoS One 2013;8:e76546.
[34]Woodsworth DJ,Castellarin M,Holt RA.Sequence analysis of T-cell repertoires in health and disease.Genome Med 2013;5:98.
[35]Robins HS,Campregher PV,Srivastava SK,Wacher A,Turtle CJ,Kahsai O,et al.Comprehensive assessment of T-cell receptor beta-chain diversity in alphabeta T cells. Blood 2009;114:4099-107.
[36]Roep BO,Arden SD,de Vries RR,Hutton JC.T-cell clones from a type-1 diabetes patient respond to insulin secretory granule proteins.Nature 1990;345:632-4.
[37]Arif S,Tree TI,Astill TP,Tremble JM,Bishop AJ,Dayan CM, et al.Autoreactive T cell responses show proinfammatory polarization in diabetes but a regulatory phenotype in health.J Clin Invest 2004;113:451-63.
[38]Velthuis JH,Unger WW,Abreu JR,Duinkerken G,Franken K, Peakman M,et al.Simultaneous detection of circulating autoreactive CD8+T-cells specifc for different islet cell-associated epitopes using combinatorialMHC multimers.Diabetes 2010;59:1721-30.
[39]Lernmark A.Autoimmune diseases:are markers ready for prediction?J Clin Invest 2001;108:1091-6.
[40]Filion MC,Proulx C,Bradley AJ,Devine DV,Sekaly RP,Decary F,et al.Presence in peripheral blood of healthy individuals of autoreactive T cells to a membrane antigen present on bone marrow-derived cells.Blood 1996;88:2144-50.
[41]van Belle TL,Coppieters KT,von Herrath MG.Type 1 diabetes: etiology,immunology,and therapeutic strategies.Physiol Rev 2011;91:79-118.
[42]Koretzky GA.Multiple roles of CD4 and CD8 in T cell activation.J Immunol 2010;185:2643-4.
[43]Miceli MC,Parnes JR.The roles of CD4 and CD8 in T cell activation.Semin Immunol 1991;3:133-41.
[44]Zhou Z,Reyes-Vargas E,Escobar H,Chang KY,Barker AP, Rockwood AL,et al.Peptidomic analysis of type 1 diabetes associated HLA-DQ molecules and the impact of HLA-DM on peptide repertoire editing.Eur J Immunol 2016.http://dx.doi.org/ 10.1002/eji.201646656.
[45]Singh S,Usha,Singh G,Agrawal NK,Singh RG,Kumar SB. Prevalence of autoantibodies and HLA DR,DQ in type 1 diabetes mellitus.J Clin Diagn Res 2016;10:EC09-13.
[46]Zhang J,Zhao L,Wang B,Gao J,Wang L,Li L,et al.HLAA*33-DR3 and A*33-DR9 haplotypes enhance the risk of type 1 diabetes in Han Chinese.J Diabetes Investig 2016;7:514-21.
[47]Roden M.Diabetes mellitus:defnition,classifcation and diagnosis.Wien Klin Wochenschr 2016;128:S37-40.
[48]Magoc T,Salzberg SL.FLASH:fast length adjustment of short reads to improve genome assemblies. Bioinformatics 2011;27:2957-63.
[49]Ye J,Ma N,Madden TL,Ostell JM.IgBLAST:an immunoglobulin variable domain sequence analysis tool.Nucleic Acids Res 2013;41:W34-40.
[50]Kriangkum J,Motz SN,Debes Marun CS,Lafarge ST,Gibson SB,Venner CP,et al.Frequent occurrence of highly expanded but unrelated B-cell clones in patients with multiple myeloma.PLoS One 2013;8:e64927.
Received 26 May 2016;revised 13 October 2016;accepted 25 October 2016 Available online 24 December 2016
Handled by Quan-Zhen Li
*Corresponding authors.
E-mail:xiaojuan26@gmail.com(Sun X),hejk@sustc.edu.cn(He J).
#Equal contribution.
aORCID:0000-0001-6521-1915.
bORCID:0000-0001-7943-2196.
cORCID:0000-0002-4627-7529.
dORCID:0000-0003-0923-9686.
eORCID:0000-0002-7588-7182.
fORCID:0000-0003-1452-8423.
gORCID:0000-0001-9022-6545.
hORCID:0000-0002-4298-3450.
iORCID:0000-0003-4127-3526.
jORCID:0000-0002-7372-6334.
Peer review under responsibility of Beijing Institute of Genomics,Chinese Academy of Sciences and Genetics Society of China.
http://dx.doi.org/10.1016/j.gpb.2016.10.003 1672-0229©2016 The Authors.Production and hosting by Elsevier B.V.on behalf of Beijing Institute of Genomics,Chinese Academy of Sciences and Genetics Society of China.
This is an open access article under the CC BY license(http://creativecommons.org/licenses/by/4.0/).
杂志排行
Genomics,Proteomics & Bioinformatics的其它文章
- Reading and Interpreting the Histone Acylation Code
- Biological Databases for Hematology Research
- Identifcation of Risk Pathways and Functional Modules for Coronary Artery Disease Based on Genome-wide SNP Data
- Plant Proteins Are Smaller Because They Are Encoded by Fewer Exons than Animal Proteins
- An Improved Methodology to Overcome Key Issues in Human Fecal Metagenomic DNA Extraction
- Announcement of Distinguished GPB Articles 2012-2015
