大森-宇津定律的一种可能机制
----以唐山大地震为例*
2016-12-17胡才博蔡永恩
胡才博 蔡永恩
1) 中国北京100049中国科学院计算地球动力学重点实验室2) 中国北京100049中国科学院大学地球科学学院 3) 中国北京100871北京大学地球与空间科学学院

大森-宇津定律的一种可能机制
----以唐山大地震为例*
胡才博1,2)蔡永恩3),*
1) 中国北京100049中国科学院计算地球动力学重点实验室2) 中国北京100049中国科学院大学地球科学学院 3) 中国北京100871北京大学地球与空间科学学院
为了探讨大森-宇津定律的物理机制,本文在余震区等效黏度远低于其外部,且构造应力场在整个余震活动时间间隔内基本保持不变的假设条件下,提出了一个开尔文黏弹性地震震源体概念模型.该模型可用于模拟主震后断层蠕变和震源区应力调整触发的余震序列以及蠕变停止后余震终结、介质恢复到弹性状态、断层重新闭锁和积累下一次地震的整个过程.有限元方法可用来计算非均匀黏弹性地震震源体模型中主震和每次余震所引起的应力场及其随时间的演化过程.在此基础上,采用开尔文黏弹性地震震源体概念模型和有限元方法模拟了1976年唐山MS7.8地震余震序列.结果表明:经验的大森-宇津定律可以用开尔文黏弹性震源体模型来解释,这意味着余震衰减的频度取决于蠕变的速率;余震序列持续时间受控于震源体的黏度,即黏度越大,蠕变时间越长,余震持续的时间也就越长.
大森-宇津定律 开尔文地震震源体模型 有限元方法 唐山大地震
引言
大地震后,余震的大小、时空展布及其迁移规律等方面的研究对防震减灾和震后重建等具有重要的意义,不同研究人员从统计学、岩石力学实验和数值模拟等角度对这些问题进行了研究,其中基于统计学得到的用于预测余震规律的“三定律”在地震学中得到了广泛应用.其一为大森-宇津定律(Omori,1894; Utsu,1961),该定律最早用于1891年日本Nobi地震的余震序列(Omori,1894),后经Utsu(1961)修订完成,可用于预测余震次数随时间的衰减关系;其二为古登堡-里克特定律(Gutenberg,Richter,1954),描述在给定区域和一定时间范围内的地震震级与地震次数之间的关系,可以预测余震次数的对数随余震震级呈线性减少的规律,但不能预测余震的发震地点和时间;其三为巴特(Båth)定律(Richter,1958; Utsu,1961; Båth,1965),描述主震震级与最大余震震级之间的关系,最大余震震级一般比主震震级小1.1—1.2,两者的差值随主震震级的增加而减少,该定律同样不能确定最大余震的发震地点和时间.关于古登堡-里克特定律的物理机制,Ohnaka(2000)和Yamaguchi等(2011)已经进行了很好的解释;但关于大森-宇津定律和巴特定律的物理机制,目前仍不是很清楚(Dieterich,1994).
大地震之后,余震发生是一种普遍现象,目前至少有两种机制可以解释其成因.一种是地震导致的下地壳和上地幔的应力松弛(Freed,Lin,1998,2001).一般认为,下地壳和上地幔的黏度为1017—1023Pa·s (Dengetal,1998;Fleschetal,2000;Huetal,2004; Zhu,Cai,2006; Bürgmann,Dresen,2008; Thatcher,Pollitz,2008;Changetal,2013).假定岩石的剪切模量为10 GPa,则对应的特征松弛时间为0.3 a—0.1 Ma,即在高黏度情形下,下地壳和上地幔的应力松弛对发震断层应力状态的影响将持续很长时间(Stein,Liu,2009).另一种是速率-状态摩擦定律,其预测得到的余震次数随时间的衰减规律符合大森-宇津定律(Dieterich,1994; Marsan,2006).对于简单的断层几何形状,余震持续时间可用特征松弛时间来表示,反比于断层加载速率(Savage,Burford,1973;Stein,Liu,2009).Stein和Liu(2009)根据速率-状态摩擦定律预测缓慢变形大陆内的余震序列较快速加载的板块边缘的余震序列要持续更长时间.
介质的不均匀性也严重影响着余震的时空分布.Hu等(2009a)利用将主震震源区介质不均匀性考虑在内的静态线弹性有限元模型,研究了1976年唐山大地震的余震分布,结果表明:该模型虽然可用来解释大型走滑型地震断层两侧的余震分布,但不能确定其时间序列.Masterlark (2003)也利用三维有限元模型证明了介质不均匀性会对震源区的变形和应力演化产生显著影响.
目前用于地震模拟的数值模型较多,常见的有地震位错模型(Okada,1992)、损伤模型(Huetal,2009a,b,2012,2013)和摩擦接触力学模型(蔡永恩等,1999;Zhu,Zhang,2010,2013)等.地震位错模型将断层视为数学上的位移不连续面,在断层破裂过程的反演和同震、震后变形以及应力调整的正演等方面得到了广泛应用.损伤模型通过降低断层带的弹性模量或者剪切模量来模拟地震发生,摩擦接触力学模型则通过降低断层接触面上的摩擦系数来模拟地震发生;二者均为动力学模型,均考虑了初始应力场的影响并均能研究断层的自发破裂,但不同的是:前者将断层视为有一定厚度的断层带,后者将断层视为物理上的摩擦不连续面.对于损伤模型,一般只考虑主震震源区的弹性参数变化,而未考虑介质流变性对余震时空演化的影响(Huetal,2009a,b,2013),故本文拟基于地震模拟的损伤模型,提出一个开尔文黏弹性地震震源体概念模型,并通过模拟1976年唐山MS7.8地震余震的衰减规律,探讨大森-宇津定律的可能物理机制.
1 大森-宇津定律机制的力学概念模型
本文将主震断层破裂区及其前震和余震区统称为震源体.从岩石力学实验、野外地质调查和地震波速(Goodman, 1989; Scholz,2002; Lietal,2002; Gudmundsson,2004)等均可推断出震源体介质是不均匀的,尤其是主震后断层滑动导致震源体内裂隙增多,加剧了它的不均匀性.一般认为,断层是具有一定厚度的带,由断层核和损伤区组成(Schulz,Evans,2000; Gudmundsson,2004).断层核是剧烈位错和变形的高发区,损伤区则可能包含一系列微破裂、小断层、岩脉和微观变形等(Chesteretal,1993; Goddard,Evans,1995; Caine,Forster,1999).例如,Li等(2002)利用断层带内的导波确定出美国海克特曼恩(Hector Mine)地震断层带的厚度为75—100 m,相当于加利福尼亚兰德斯(Landers)地震破裂带厚度(150—250 m)的一半.
余震可视为震后震源体(余震区)应力调整的一个时间序列.本文在假设余震区等效黏度远低于其外部,且构造应力场在整个余震活动时间间隔基本不随时间改变的前提下,提出了一个开尔文黏弹性地震震源体概念模型,以探讨发震断层及震源体蠕变和应力调整(Savage,Svarc,1997)触发的余震与大森-宇津定律的关系.由开尔文黏弹性体的力学特性可知,当蠕变停止后,余震终结,介质恢复到弹性状态,断层闭锁,并开始积累下一次地震的能量.其中,开尔文黏弹性模型的本构关系(杨挺青,1990)为

(1)


(2)
式中,σij和εij分别为应力张量和应变张量,δij为狄拉克函数.
综合式(1)和(2),并写成矩阵和向量形式,得到

(3)

{σ}=[σxxσyyσxy]T, {ε}=[εxxεyyεxy]T,
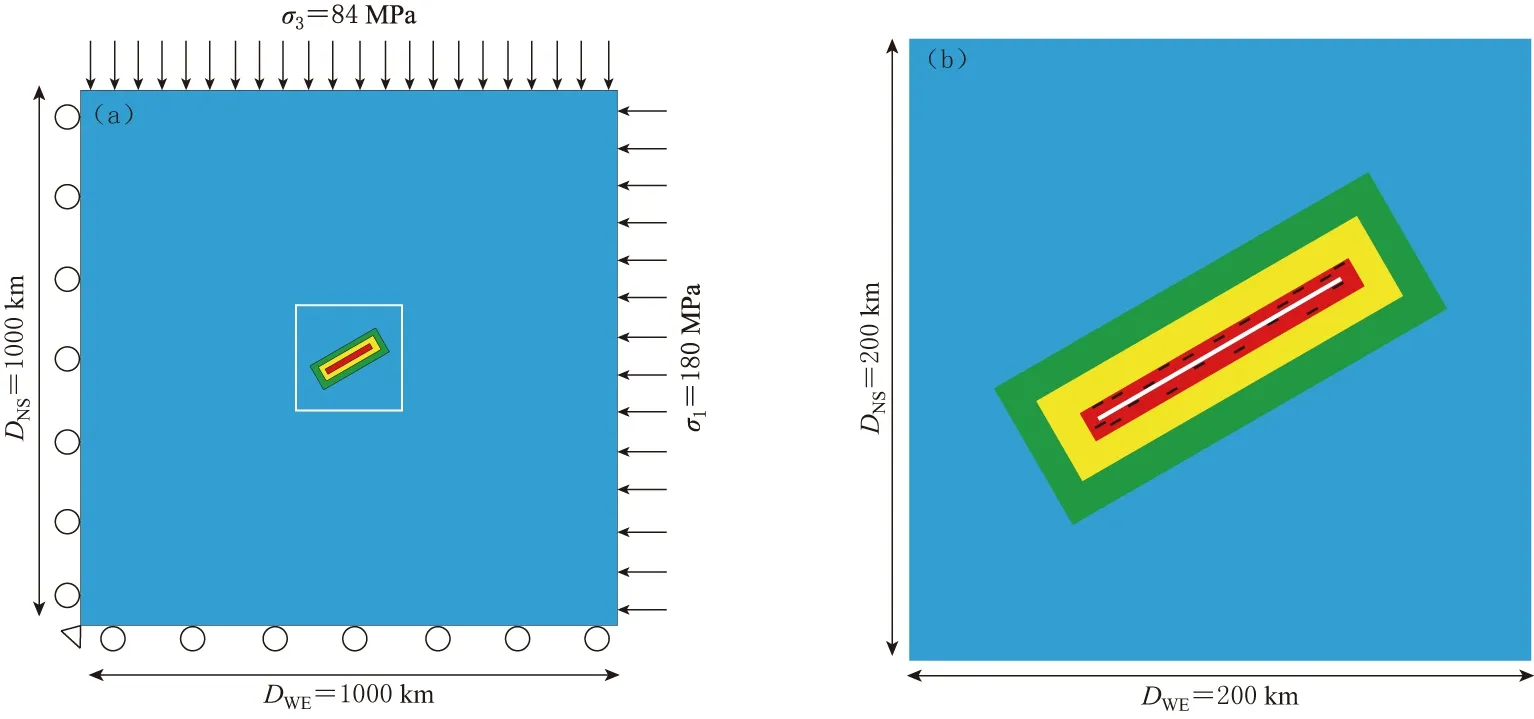
开尔文黏弹性地震震源体概念模型如图1所示.主震震源区包括一条长90 km、厚200 m的主震断层(图1中白色长线)和一些长2.5 km、厚200 m的小裂缝(图1中黑色短线).震源区的主震断层带、小裂缝和原岩区等3部分的弹性模量分别为63,73和88 GPa,泊松比分别为0.40,0.40和0.25.将主震断层带和小裂缝假设为开尔文黏弹性体,其黏度均为1.0×10¹⁷Pa·s (Zhaoetal,1996; Faulkneretal,2006; Audetetal,2009).主震震源区之外弹性介质的弹性模量和泊松比分别为95 GPa和0.25(Zhu,Cai,2006; Thatcher,Poliltz,2008; Changetal,2013).内摩擦系数μ随着离开主震断层的距离越远而增加,在红色、黄色、绿色和蓝色区域分别为0.36,0.40,0.45和0.56.以上介质参数据地震层析成像和冰后回升资料确定(Zhaoetal,1996; Faulkneretal,2006; Zhu,Cai,2006; Thatcher,Pollitz,2008; Changetal,2013).
模型的几何及边界条件如图1a所示,最大主应力σ1和最小主应力σ3分别为180 MPa和84 MPa,分别作用于东部边界和北部边界;滚筒支撑施加于西部和南部边界.主震通过将主震断层带的剪切模量从22.5 GPa降为0.225 GPa来模拟,相当于产生1.6 m的平均位错.地震后断层内的剪切波速度会减小(Lietal,2002),这意味着断层的介质受到损坏,因此地震模拟可以通过降低断层的剪切模量来实现(Huetal,2009a,b, 2013).主震之后,当主震震源区内小裂隙处的应力达到屈服强度时,令其剪切模量从26.1 GPa降低至0.261 GPa来模拟余震的发生.区域外的其它介质在主震前后不发生变化,边界条件在主震前后也不发生变化,计算的时间步长为1个月.

图1 开尔文黏弹性震源体概念模型(a) 材料模型和边界条件;(b) 主震震源区局部放大图图中DWE和DNS分别代表东西方向和南北方向的距离;滚筒表示切向自由滑动而法向位移为零.震源体是由3种材料组成,其材料力学性质分别用红色、黄色和绿色代表.红色区域表示主震震源区(包括主震断层和破坏区),其中白色长线表示断层核,黑色短线表示震前小破裂(前震);蓝色表示震源体外的原岩区
DWEandDNSare the distances in the N--S and E--W directions,respectively. The roll boundary denotes sliding in the tangential direction and no displacement in normal direction,respectively. The earthquake source body is composed of three regions with different material properties marked by the red,yellow and green. The red rectangular denotes the mainshock source region including mainshock fault and damaged zone,in which the white long line and black short lines mark the mainshock fault core and pre-seismic cracks (foreshocks); the blue marks the host rock region
为了定量地描述余震触发的力学机制,Hu等(2009b)定义了一个无量纲的地震触发因子C=|τn|/(μσn)的变化,ΔC=Ca-Cb,来作为地震触发的判定准则.其中,τn和σn分别为外法线为n的微元面上的正应力和剪应力,μ为内摩擦系数,Ca和Cb分别为震后和震前的地震触发因子.在弹性有限元模拟中,若有限元单元的C>1或C=1,则意味着这些单元将发生库仑破裂(余震).发生过余震的地方将C值设定为0,以便统计余震次数.
2 模型结果
本文利用开尔文黏弹性地震震源体概念模型模拟了1976年唐山MS7.8大地震及其余震的时空演化.图2和图3分别给出了有限元模拟得到的地震触发因子C和唐山大地震实际余震的时空分布图.

图2 有限元模拟得到的主震后地震触发因子C的时空分布图(a) 主震后第1个月;(b) 主震后第2个月;(c) 主震后第3个月;(d) 主震后第4个月;(e) 主震后第6个月;(f) 主震后第9个月;(g) 主震后第36个月;(h) 主震后第40个月模型尺寸为200 km×200 km. 白色区域表示地震触发因子C≥1,余震发生;红色区域表示临近库仑破裂; 蓝色区域表示地震触发因子C=0,意味着之前已发生过余震
从图2可以看出:在大地震之后的第1个月,大部分余震发生在主震震源区,特别是在主震断层带的两个尖端附近区域(白色区域),还有一些余震发生在主震断层带的两侧(图2a);主震后第2—4个月,在主震断层尖端,余震会随时间逐渐向外迁移,余震次数随时间迅速减少(图2b--d);主震后第2—9个月,在主震断层的两个尖端附近逐渐形成四叶形的红色和橙色区域(图2b--f),这些区域非常接近库仑破裂,与库仑应力变化ΔCFS>0区域较类似;主震后36—40个月,地震触发因子C≥1的区域(白色区域)非常小,意味着余震次数也非常少(图2g,h).四叶形的红色区域在36个月之后趋于稳定,不再增大或缩小,该结果与马克斯威尔黏弹性模型得到的库仑应力变化ΔCFS>0的区域会在主震之后逐渐扩大的结果(Freed,Lin,1998,2001)非常不一样.

图3 1976年MS7.8唐山大地震之后6年的实际余震(MS>4.0)的时空分布图*地震数据引自中国地震局台网中心内部资料.(a) 第1年内; (b) 第2年内;(c) 第3年内;(d) 第4年内;(e) 第5年内;(f) 第6年内图中八角星为唐山大地震主震,圆圈表示其余震
将有限元概念模型模拟的地震触发因子(图2)与唐山大地震实际余震(图3)的时空分布图进行对比可知,两者具有很好的一致性,均显示出余震次数随时间逐渐减小的规律,符合大森-宇津定律.
假设每个时间步得到的地震触发因子C≥1的有限元单元个数近似等效于余震次数,有限元模型预测得到的余震次数随时间的变化如图4a所示.可以看出,用概念模型得到的结果与唐山大地震实际观测得到的衰减规律具有很好的一致性(图4),余震次数随时间急剧衰减的规律与大森-宇津定律(Omori,1894)的预测结果一致.

图4 1976年唐山大地震的有限元模拟余震次数(a)和实际余震(MS>4.0)(b)随时间的变化曲线
3 讨论与结论
本文采用开尔文黏弹性震源体概念模型来研究走滑地震之后余震的时空分布.结果表明:模型预测的余震次数随时间的衰减符合大森-宇津定律,这意味着余震衰减的频度取决于震源体蠕变的速率;余震序列的持续时间受控于震源体的黏度,即黏度越大,蠕变时间越长,余震的持续时间也就越长.本文的重心不在于具体确定大森-宇津定律中的参数,这些参数仅描述了余震的统计特性,其物理意义目前还未明确.
本文提出的开尔文黏弹性地震震源体模型,主要考虑的是震源体的震后蠕变;而马克斯威尔黏弹性模型,考虑的是主震后下地壳和上地幔的黏弹性应力松弛对余震触发的影响,并广泛应用于模拟余震触发研究中.开尔文黏弹性地震震源体模型可以解释震后断层的缓慢滑动,正是这种滑动引起的震源体应力变化触发了余震;当蠕变终结,余震停止,介质恢复到弹性状态,断层闭锁后开始积累下一次地震的能量.断层系统的复杂几何形状同样会影响余震分布(Saucieretal,1992;Li,Liu,2006; Lietal,2009),而本文使用的断层几何模型虽然很简单,但不会改变余震随时间衰减的大森-宇津定律基本特征.
通过有限元模拟得到了1976年唐山大地震余震次数与时间之间的衰减关系.其中,假设每个时间步内地震触发因子C≥1的有限元单元个数与余震次数等效,这个假设非常粗略,因为该假设暗示有限元单元的尺寸与余震震源的尺寸相同,而未考虑余震震级大小的不同.从有限元模型预测的结果来看,尽管这个假设较为粗略,但还是可以解释大森-宇津定律以及唐山大地震实际余震次数随时间的衰减规律.
蔡永恩,何涛,王仁. 1999. 1976年唐山地震震源动力过程的数值模拟[J]. 地震学报,21(5): 469--477.
Cai Y E,He T,Wang R. 1999. Numerical simulation of dynamic process of the 1976 Tangshan earthquake[J].ActaSeismologicaSinica,21(5): 469--477 (in Chinese).
杨挺青. 1990. 粘弹性力学[M]. 武汉: 华中理工大学出版社: 24--28.
Yang T Q. 1990.MechanicsofViscoelasticity[M]. Wuhan: Central China University of Science and Technology Press: 24--28 (in Chinese).
Audet P,Bostock M G,Christensen N I,Peacock S M. 2009. Seismic evidence for overpressured subducted oceanic crust and megathrust fault sealing[J].Nature,457(7225): 76--78.doi:10.1038/nature07650.
Båth M. 1965. Lateral inhomogeneities of the upper mantle[J].Tectonophysics,2(6): 483--514.
Bürgmann R,Dresen G. 2008. Rheology of the lower crust and upper mantle: Evidence from rock mechanics,geodesy,and field observations[J].AnnuRevEarthPlanetSci,36: 531--567.
Caine J S,Forster C B. 1999. Fault zone architecture and fluid flow: Insights from field data and numerical modeling[G]∥FaultsandSubsurfaceFluidFlowintheShallowCrust. Washington DC: American Geophysical Union,113: 101--127.
Chang W L,Smith R B,Puskas C M. 2013. Effects of lithospheric viscoelastic relaxation on the contemporary deformation following the 1959MW7.3 Hebgen Lake,Montana,earthquake and other areas of the intermountain seismic belt[J].GeochemGeophysGeosyst,14(1): 1--17.doi:10.1029/2012GC004424.
Chester F M,Evans J P,Biegel R L. 1993. Internal structure and weakening mechanisms of the San Andreas fault[J].JGeophysRes,98(B1): 771--786.
Deng J,Gurnis M,Kanamori H,Hauksson E. 1998. Viscoelastic flow in the lower crust after the 1992 Landers,California,earthquake[J].Science,282(5394): 1689--1692.
Dieterich J H. 1994. A constitutive law for rate of earthquake production and its application to earthquake clustering[J].JGeophysRes,99(B2): 2601--2618.
Faulkner D R,Mitchell T M,Healy D,Heap M J. 2006. Slip on ‘weak’ faults by the rotation of regional stress in the fracture damage zone[J].Nature,444(7121): 922--925.doi:10.1038/nature05353.
Flesch L M,Holt W E,Haines A J,Shentu B M. 2000. Dynamics of the Pacific-North American Plate boundary in the western United States[J].Science,287(5454): 834--836.doi:10.1126/science.287.5454.834.
Freed A M,Lin J. 1998. Time-dependent changes in failure stress following thrust earthquakes[J].JGeophysRes,103(B10): 24393--24409.
Freed A M,Lin J. 2001. Delayed triggering of the 1999 Hector Mine earthquake by viscoelastic stress transfer[J].Nature,411(6834): 180--183.
Goddard J V,Evans J P. 1995. Chemical changes and fluid-rock interaction in faults of crystalline thrust sheets,northwestern Wyoming,USA[J].JStructGeol,17(4): 533--547.
Goodman R E. 1989.IntroductiontoRockMechanics[M]. 2nd Edition. New York: John Wiley & Sons Inc:19--53.
Gudmundsson A. 2004. Effects of Young’s modulus on fault displacement[J].ComptRendGeosci,336(1): 85--92.
Gutenberg B,Richter C F. 1954.SeismicityoftheEarthandAssociatedPhenomena[M]. 2nd Edition. Princeton,NJ: Princeton University Press: 17--19.
Hu C B,Zhou Y J,Cai Y E. 2009a. A new finite element model in studying earthquake triggering and continuous evolution of stress field[J].ScienceChinaEarthScience,52(7): 994--1004.
Hu C B,Zhou Y J,Cai Y E,Wang C Y. 2009b. Study of earthquake triggering in a heterogeneous crust using a new finite element model[J].SeismolResLett,80(5): 795--803.
Hu C B,Cai Y E,Wang Z M. 2012. Effects of large historical earthquakes,viscous relaxation,and tectonic loading on the 2008 Wenchuan earthquake[J].JGeophysRes,117: B06410.doi:10.1029/2011JB009046.
Hu C B,Cai Y E,Liu M,Wang Z M. 2013. Aftershocks due to property variations in the fault zone: A mechanical model[J].Tectonophysics,588: 179--188.doi:10.1016/j.tecto.2012.12.013.
Hu Y,Wang K,He J,Klotz J,Khazaradze G. 2004. Three-dimensional viscoelastic finite element model for postseismic deformation of the great 1960 Chile earthquake[J].JGeophysRes,109(B12): B12403.
Li Q S,Liu M. 2006. Geometrical impact of the San Andreas fault on stress and seismicity in California[J].GeophysResLett,33(8): L08302.doi:10.1029/2005GL025661.
Li Q S,Liu M,Zhang H. 2009. A 3-D viscoelastoplastic model for simulating long-term slip on non-planar faults[J].GeophysJInt,176(1): 293--306.
Li Y G,Vidale J E,Day S M,Oglesby D D,The SCEC Field Working Team. 2002. Study of the 1999M7.1 Hector Mine,California,earthquake fault plane by trapped waves[J].BullSeismolSocAm,92(4): 1318--1332.
Marsan D. 2006. Can coseismic stress variability suppress seismicity shadows? Insight from a rate-and-state friction model[J].JGeophysRes,111(B6): B06305.doi:10.1029/2005JB004060.
Masterlark T. 2003. Finite element model predictions of static deformation from dislocation sources in a subduction zone: Sensitivities to homogeneous,isotropic,Poisson-solid,and half-space assumptions[J].JGeophysRes,108(B11): 2540.doi:10.1029/2002JB002296.
Ohnaka M. 2000. A physical scaling relation between the size of an earthquake and its nucleation zone size[J].PureApplGeophys,157(11): 2259--2282.
Okada Y. 1992. Internal deformation due to shear and tensile faults in a half-space[J].BullSeismolSocAm,92(2): 1018--1040.
Omori F. 1894. On the aftershocks of earthquakes[J].JCollSciImperUnivTokyo,7: 111--120.
Richter C F. 1958.ElementarySeismology[M]. San Francisco: W H Freeman and Company: 69.
Saucier F,Humphreys E,Weldon II R. 1992. Stress near geometrically complex strike-slip faults: Application to the San Andreas fault at Cajon Pass,southern California[J].JGeophysRes,97(B4): 5081--5094.
Savage J C,Burford R O. 1973. Geodetic determination of relative platemotion in central California[J].JGeophysRes,78(5): 832--845.
Savage J C,Svarc J L.1997. Postseismic deformation associated with the 1992MW7.3 Landers earhquake,southern California[J].JGeophysRes,102(B4): 7565--7577.
Scholz C H. 2002.TheMechanicsofEarthquakesandFaulting[M]. 2nd Edition. Cambridge: Cambridge University Press: 136--155.
Schulz S E,Evans J P. 2000. Mesoscopic structure of the Punchbowl fault,southern California and the geologic and geophysical structure of active strike-slip faults[J].JStructGeol,22(7): 913--930.
Stein S,Liu M. 2009. Long aftershock sequences within continents and implications for earthquake hazard assessment[J].Nature,462(7269): 87--89.doi:10.1038/nature08502.
Thatcher W,Pollitz F F. 2008. Temporal evolution of continental lithospheric strength in actively deforming regions[J].GSAToday,18(4/5): 4--11.doi:10.1130/GSAT01804-5A.1.
Utsu T. 1961. A statistical study on the occurrence of aftershocks[J].GeophysMagaz,30: 521--605.
Yamaguchi T,Morishita M,Doi M,Hori T,Sakaguchi H,Ampuero J P. 2011. Gutenberg-Richter’s law in sliding friction of gels[J].JGeophysRes,116(B12): B12306.doi:10.1029/2011JB008415.
Zhao D P,Kanamori H,Negishi H,Wiens D. 1996. Tomography of the source area of the 1995 Kobe earthquake: Evidence for fluids at the hypocenter?[J].Science,274(5294): 1891--1894.
Zhu S B,Cai Y E. 2006. Inversion of viscous properties of crust and mantle from the GPS temporal series measurements[J].ChineseJournalofGeophys,49(3): 679--687.
Zhu S B,Zhang P Z. 2010. Numeric modeling of the strain accumulation and release of the 2008 Wenchuan,Sichuan,China,earthquake[J].BullSeismolSocAm,100(5B): 2825--2839.
Zhu S B,Zhang P Z. 2013. FEM simulation of interseismic and coseismic deformation associated with the 2008 Wenchuan earthquake[J].Tectonophysics,584: 64--80.
A possible mechanism of Omori-Utsu’s law through an example of the great Tangshan earthquake
Hu Caibo1,2)Cai Yongen3),*
1)KeyLaboratoryofComputationalGeodynamics,ChineseAcademyofSciences,Beijing100049,China2)CollegeofEarthSciences,UniversityofChineseAcademyofSciences,Beijing100049,China3)DepartmentofGeophysics,PekingUniversity,Beijing100871,China
This paper proposes a conceptual model of earthquake source body with Kelvin viscoelastic property to investigate the physical mechanism of Omori-Utsu’s law,supposing that tectonic stress field after main shock does not change with time and equivalent viscosity in the aftershock region is much lower than that of its outside in the period of total aftershock activity. This model can simulate aftershock sequence induced by post-seismic creep and stress readjustment,and the whole process including creep stopping,materials recovering to its elastic state,and faulting turning to stick state for next earthquake. Finite element method is used to calculate stress field evolution caused by a main shock and its aftershocks in the model with heterogeneous material properties. Further- more,the model and the method are used to simulate decay of the aftershock frequency of the 1976MS7.8 Tangshan earthquake. The results show that the mechanism of Omori-Utsu’s law may be attributed to the stress changes caused by the creep of the fault and earthquake source body,which implies that aftershock frequency depends on the creep rate and decay time of the aftershocks is controlled by the equivalent viscosity. The lager the viscosity is,the longer the creep time or the aftershocks last.
Omori-Utsu’s law;Kelvin earthquake source body model;finite element method;the great Tangshan earthquake
10.11939/jass.2016.04.005.
国家自然基金(41474085, 41474080和41004038)、中国科学院大学校长基金(Y35101EY00)和中国博士后基金(20090460130)共同资助.
2016-05-09收到初稿,2016-06-20决定采用修改稿.
10.11939/jass.2016.04.005
P315.08
A
胡才博,蔡永恩. 2016. 大森-宇津定律的一种可能机制----以唐山大地震为例. 地震学报, 38(4): 580--589.
Hu C B, Cai Y E. 2016. A possible mechanism of Omori-Utsu’s law through an example of the great Tangshan earthquake.ActaSeismologicaSinica, 38(4): 580--589.doi:10.11939/jass.2016.04.005.
*通讯作者 e-mail: yongen@pku.edu.cn
