西藏农田土和农作物中多氯联苯的分布、环境行为和健康风险评估
2016-12-12王传飞龚平王小萍姚檀栋
王传飞,龚平,王小萍,*,姚檀栋
1. 中国科学院青藏高原研究所 中国科学院青藏高原环境变化与地表过程实验室,北京 100101 2. 中国科学院青藏高原地球科学卓越创新中心,北京 100101
西藏农田土和农作物中多氯联苯的分布、环境行为和健康风险评估
王传飞1,2,龚平1,2,王小萍1,2,*,姚檀栋1,2
1. 中国科学院青藏高原研究所 中国科学院青藏高原环境变化与地表过程实验室,北京 100101 2. 中国科学院青藏高原地球科学卓越创新中心,北京 100101
南亚排放的多氯联苯类污染物(PCBs)可随大气传输到西藏南部,并沉降到农田等区域。农田中的PCBs能够经食物链进入人体,从而可能对人体健康产生影响。但目前尚无西藏农田PCBs环境过程和农作物健康风险评估的研究。本研究通过同步采集西藏农田土壤和农作物,发现西藏农田土壤、青稞和油菜PCBs的浓度均值分别为5.1 pg·g-1dw、13.5 pg·g-1dw和10.9 pg·g-1dw,低于全球其他地区。青稞和油菜对PCBs的生物富集系数都大于1,说明PCBs在农作物中发生了生物富集现象。模型模拟结果显示,农田土壤中99.6%的PCBs都富集在土壤有机质中,只有0.38%的PCBs进入了植物根系。因此,青稞直接从大气中吸收PCBs是其对PCBs积累和富集的主要途径。基于饮食结构 (青稞、牛肉、牛奶和酥油),西藏人群PCBs摄入均值为0.75 ng·kg-1bw·d-1,低于安全阈值约一个数量级。PCBs的食物摄入不会对西藏居民健康状况产生明显影响。
多氯联苯;西藏;空间分布特征;逸度模型;健康风险
Received 2 December 2015 accepted 2 January 2016
多氯联苯(polychlorinated biphenyls, PCBs)具有持久性、高毒性、生物富集和长距离传输的特征,在环境中广泛分布,对生物体和人体健康具有严重的危害[1-3]。因而,PCBs受到全球科学家的广泛关注[4-6],并成为首批加入《斯德哥尔摩公约》受控清单的持久性有机污染物(POPs)[1]。目前,虽然大多数国家都已经停止了PCBs的生产,但伴随电子垃圾的焚烧[7]、拆卸[8]和污水灌溉[9],PCBs被再次释放到环境中并产生了相应的生态风险。土壤富含有机质是污染物的重要“储库”[10-12],其不但是长距离大气输送污染物的主要受体,还是局地工农业活动所排放污染物的接收器。土壤对PCBs的全球循环起到重要的作用[13]。一方面,进入土壤的PCBs会发生再分配与迁移,在此过程中不同氯代的PCBs可能发生组成分馏现象,表现为小分子PCBs向土壤深处迁移而大分子PCBs则倾向于富集于表层有机质中[14];另一方面,土壤已然成为了小分子PCBs的二次源[15]。Li等[15]的研究表明全球大部分地区的土壤均在不同程度地向大气挥发小分子PCBs。因此,从PCBs全球循环的角度看,由电子垃圾拆卸和焚烧所产生的一次PCBs排放及土壤挥发引发的二次排放过程是当前PCBs的主要排放源,而深海[16]和位于亚北极圈的北方森林[14]则是PCBs的汇。
在土壤的研究中,PCBs在农田土中的环境过程和农田食物链传递引起了广泛关注。一方面,频繁的耕作活动加速了PCBs的气-地交换过程[17],促使了更多的PCBs向大气挥发;另一方面农作物对土壤PCBs的吸收,使得PCBs通过食物链的传递而在人体富集[8]。目前,相关研究主要集中在受电子垃圾和污灌直接影响的农田土壤中[9, 18]。
青藏高原被称为地球“第三极”。相比南极、北极,它是唯一有着人类丰富生存活动的极地地带。青藏高原工业贫瘠但是却有较长时间的农垦活动[19]。此外,青藏高原毗邻印度、尼泊尔、巴基斯坦等南亚国家,目前这些国家已经成为了发达国家电子垃圾的重要倾泻地[20-21]。电子垃圾拆卸与焚烧产生了大量的PCBs,在印度季风的驱使下,印度排放的PCBs会经大气传输到达青藏高原[22-28]。农田土一般有较高含量的有机质,传输到青藏高原的PCBs是否会在高原农田土壤中积累,并产生怎样的分布格局?西藏农田土壤中PCBs向空气、水、有机质、矿物质及植物根系的传输过程怎样?其是否会被高原典型农作物吸收并产生可能的食用风险。针对这些问题,本研究在青藏高原农田分布区同步采集农田土壤和农作物的样品,旨在获得农田土壤和农作物PCBs的浓度水平、空间分布特征,一方面借助土壤模型探讨农田土壤中PCBs的环境行为,另一方面结合文献报道的酥油[29-30]、牛奶[31]、牦牛肉[31]中PCBs的含量估算藏民由饮食途径而摄入PCBs的风险。
1 材料和方法 (Materials and methods)
1.1 样品采集
据统计,藏南地区(包括拉萨市、日喀则地区、林芝地区、山南地区、昌都地区)农田面积占西藏农田总面积的96%[19]。本研究于2011年8月在藏南采在农田中随机选取100×100 m2样地,在样地的4个角和中心点用干净的不锈钢铲各采集1份表层土壤样品(0~10 cm),将这5份子样本混合成1个样品,该样品可以代表所在该样地的特征。用剪刀采集样地内青稞和油菜的地上组织样本,并用上述方法混合。所有样品用2层铝箔包裹并置于2层自封袋中密封保存。采集完的样品尽快送回实验室,于-20 ℃冷冻保存。土壤和农作物含水率按照文献[29]进行测定:称取10 g土壤或2 g农作物(均为湿重),将其置于烘箱中105 ℃烘20 min,之后90 ℃烘致恒重。通过比较烘干前后样品的重量差而获得含水率。本研究测得的农田土壤和农作物的含水量分别为13%±5%和37%±24%。
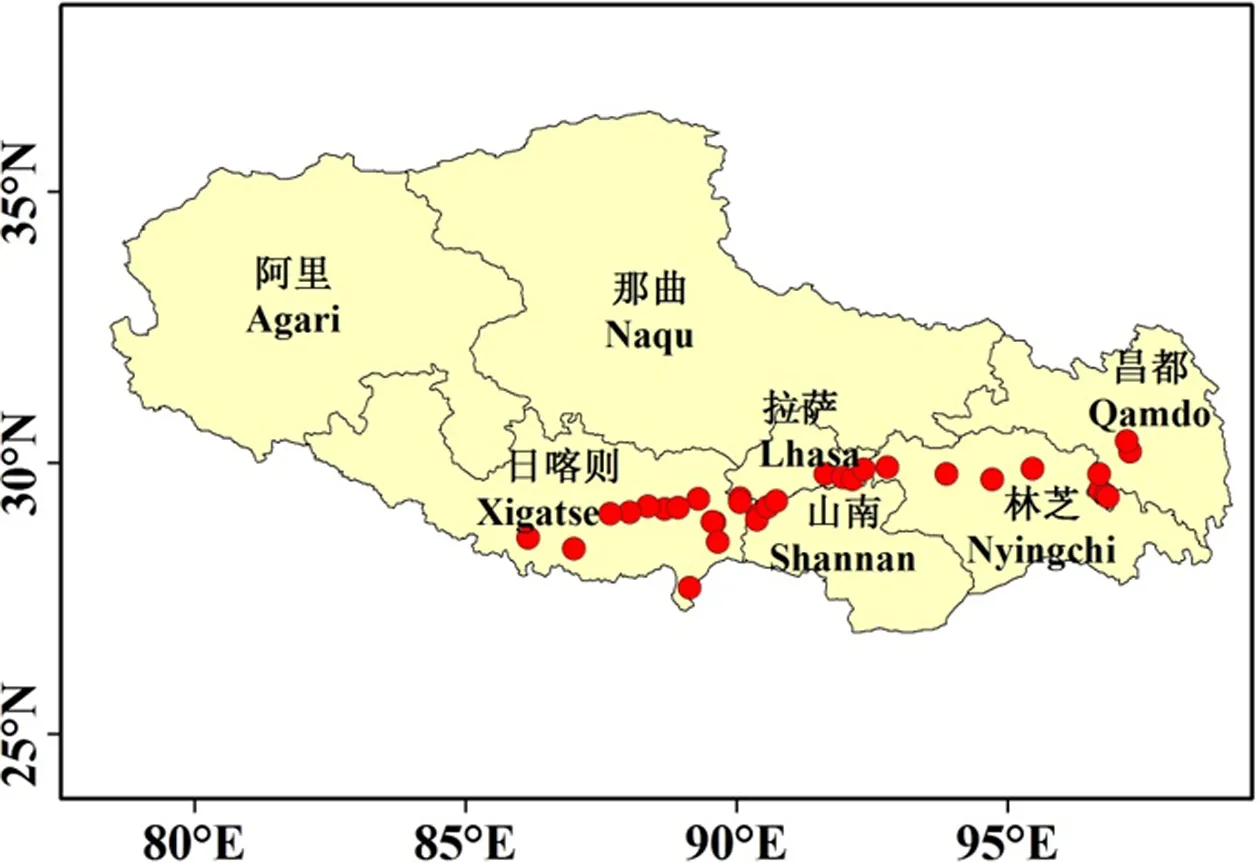
图1 西藏农田土壤和农作物采样点的分布Fig. 1 Sampling sites from the Tibetan agricultural regions
集农田土壤样品32个,同步采集青稞(Hordeum vulgare Linn. var. nudum Hook. f.)样品32个,随机采集油菜(Brassica campestris L.)样品4个,采样点详见图1。
1.2 样品的提取和分析方法
30 g新鲜农田土壤和30 g无水硫酸钠的混合,用200 mL二氯甲烷(DCM)索式提取16 h,并加入2 ng回收率指示物质(PCB-30和Mirex)。经浓缩后,用氧化铝硅胶柱(柱子内自上而下填充:2 g无水硫酸钠,10 g氧化铝,9 g硅胶)净化,并用180 mL体积比为1:1的DCM:正己烷(hexane)混合溶液洗脱柱子。淋洗液浓缩至5 mL后用浓硫酸进行酸解,过凝胶色谱柱(GPC)。用46 mL DCM:hexane (1:1, V/V)洗脱液淋洗GPC柱,舍弃前16 mL洗脱液,只收集后30 mL溶液。将收集的洗脱液加入含2 ng内标物质(PCB-209和 PCNB)定容至100 μL。农作物的前处理方法与土壤相同,所用样品量为20 g新鲜农作物样品。实验用DCM和Hexane均为HPLC级,购自J.T.Baker公司;无水硫酸钠(优级纯)、层析用的中性氧化铝和硅胶的生产商为国药集团化学试剂有限公司。
化合物测定使用热电公司(Thermo Electron Corporation)生产的离子阱气相色谱-质谱/质谱联用仪(GC-MS-MS,Finnigan Trace GC/PolarisQ)。载气为氦气,流量为1 mL·min-1,进样方式为不分流进样。色谱柱为直径250 μm、长50 m的CP-Sil 8 CB柱。进样口和传输线温度分别为250 ℃和280 ℃。色谱的升温程序为:100 ℃保持2 min,以20 ℃·min-1的速率升到140 ℃,以4 ℃·min-1升温到200 ℃并保持10 min,之后以4 ℃·min-1升温到300 ℃,保持17 min。目标化合物为6种指示性PCB (indicator PCBs),包括PCB-28,52,101,153,138和180。
1.3 质量控制
实验室前处理过程遵循严格的质量控制标准。样品处理过程中设置了实验室流程空白(即只用无水硫酸钠进行提取),每5个样品设置一个实验室空白。空白的前处理流程与样品完全一致。在实验室空白中未检出目标化合物,表明样品在分析过程中未受到污染。鉴于此,仪器检出限使用工作曲线最低浓度点的信噪比进行折算,设检出限的信噪比为10。基于26 g农田土壤和13 g农作物干重(dw)样品,PCBs的检出限分别为0.002~0.004 pg·g-1dw和0.001~0.002 pg·g-1dw。农田土样品的回收率为60%~121%(PCB-30)和71%~133%(Mirex);农作物样品的回收率为49%~94%(PCB-30),54%~79%(Mirex)。
1.4 土壤模型简介
土壤模型(Soil model,version 3.0)来自加拿大特伦特大学环境模型中心[32],该模型基于逸度的原理,以空气、水、有机质、矿物质和植物根系为模拟介质,假设根系作为土壤的一部分与其他相之间处于交换平衡状态,进而模拟表层土壤中化学物质挥发、降解、淋溶等环境过程。本研究将借助该模型模拟PCBs在表层土壤中的挥发、降解和淋溶的速率及进入土壤的PCB向植物根系的传输量。
2 结果与讨论(Results and discussion)
2.1 西藏农田土壤和农作物PCBs的残留状况及浓度水平
西藏农田土壤和农作物样品中均有PCBs检出,检出率最高的化合物为五氯PCB(PCB-101),检出率分别为98%和100%;检出率最低的化合物均为七氯PCB(PCB-180),检出率分别为40%和20%。从样品中PCBs质量的相对组成看,农田土壤中三氯、四氯PCB(PCB-28和PCB-52)分别占PCBs总质量的30%和16%;农作物中这些化合物所占的比重分别为29%和33%。西藏农田土壤和农作物PCBs的组成以小分子的多氯联苯为主,这与西藏表土、牧草及全国背景土壤PCBs的组成是相似的[29, 33, 34]。
青藏高原农田土壤和农作物(包括青稞和油菜)PCBs浓度的统计数据见表1。农田土壤6种PCBs的浓度范围为1.9~13.2 pg·g-1dw,平均浓度为(5.1±2.9) pg·g-1dw(表1)。与长江三角洲(3.6×10⁴pg·g-1dw)、太湖区域(1.1×10³pg·g-1dw)及山东潍坊(5.9×10³pg·g-1dw)等中国东部地区农田相比[35-37],西藏农田土壤PCBs浓度低3~4个数量级。在国外农田中,巴基斯坦、瑞典的农田土壤PCBs浓度分别为9.4×10³pg·g-1dw和1.6×10³pg·g-1dw[38-39],亦比西藏农田土壤PCBs高近3个数量级。从全球来看,西藏农田PCBs的浓度较低,与全球背景土壤的浓度(9~51.2×10³pg·g-1dw)[5]的低值相接近。
青稞是西藏的主要农作物,是当地藏民的主食之一。除青稞外,西藏还有少量的蔬菜种植。为了比较青稞和蔬菜PCBs的浓度水平,本研究随机选择4个采样点采集了青稞和油菜(蔬菜主要品种)样品。这些采样点青稞和油菜PCBs的浓度分别为4.5~15 pg·g-1dw和5.8~16 pg·g-1dw (表1)。经配对双样本t检验,结果显示两组数据的平均值不存在显著的差异(P>0.05)。这说明西藏青稞和油菜PCBs的浓度水平相当。因而,青稞PCBs的浓度能够反映西藏农作物PCBs的浓度水平。西藏32个青稞样品PCBs的浓度范围为2.4~28.6 pg·g-1dw,平均值为(13.5±7.6) pg·g-1dw (表1)。这与纳木错野生牧草PCBs (16.8 pg·g-1dw)的浓度水平相当[29]。青稞是青藏高原的特有物种,与其他地区的主食农作物相比,青稞PCBs的浓度比巴基斯坦的大米(1.1×10³pg·g-1dw)和小麦(0.8×10³pg·g-1dw)[38]及广州的大米(0.8×10³pg·g-1dw)[8]低约2个数量级。
综上所述,青藏高原农田土壤和农作物PCBs的浓度均显著低于全球其他农田地区。
2.2 西藏农田土壤和农作物PCBs的空间分布特征
西藏农田分布区土壤和农作物PCBs的空间分布如图2所示。在几个行政区中,昌都地区的农田土壤PCBs浓度最高(平均为6.0 pg·g-1dw,图2a)。研究发现土壤有机碳(SOC)对PCBs有较强的吸附能力,是影响土壤PCBs空间分布的重要因素[12]。昌都地区农田土壤有机碳的含量高达3.5%,是其他区域的2~3倍,高含量的SOC促使更多的PCBs富集在土壤中。此外,Wang等[33]认为昌都地区相对较高的降雨量(特别是降雪)加速了大气PCBs的沉降。高含量的SOC和湿沉降的共同作用使昌都农田土壤PCBs的浓度高于其他地区。林芝地区的农田土壤PCBs浓度为几个行政区中的最低值(平均3.0 pg·g-1dw,图2a)。拉萨、日喀则和山南地区PCBs浓度则介于以上两者之间,且浓度水平相差并不大(图2a)。西藏农田土壤PCBs高低值仅有2倍之差。这说明西藏地区农田土壤PCBs的空间差异较小。
鉴于油菜的样品数量较少,本文只讨论了青稞PCBs的空间分布(图2b)。西藏青稞PCBs的浓度水平依次为日喀则>山南>林芝>拉萨>昌都。总体上,青藏高原南部与南亚接壤行政区中的青稞PCBs含量稍高,这与农田土壤PCBs的空间分布特征(图2a)差异较大。植物和土壤都能够从大气中吸收污染物,在根系从土壤中吸收污染物的同时,植物也在叶片接收大气沉降的PCBs[40]。大气对农作物PCBs的贡献可能是引起土壤和农作物PCBs空间分布差异的原因。此外,农作物对PCBs的吸收过程只发生在当年生长季,而土壤中的PCBs是多年累积的结果。这也可能是引起两者空间分布特征不同的原因。
2.3 农作物的生物富集
植物从其生长环境中富集污染物的程度,可以用生物富集因子(biological concentration factor, BCF)来表示,即植物与其生长环境中污染物浓度的比值。若BCF>1,则说明污染物在植物体内发生了生物富集。

表1 青藏高原农田土壤和农作物PCBs浓度(pg·g-1 dw)统计数据
注:*样品量为32个;**样品量为4个;Min:最小值;Max:最大值;Mean:平均值;Std:标准偏差;BDL:低于检测限。
Note: *Thirty two samples; **Four samples; Min: Minimum; Max: Maximum; Mean: Mean values; Std: Standard deviation; BDL: Below detection limit.
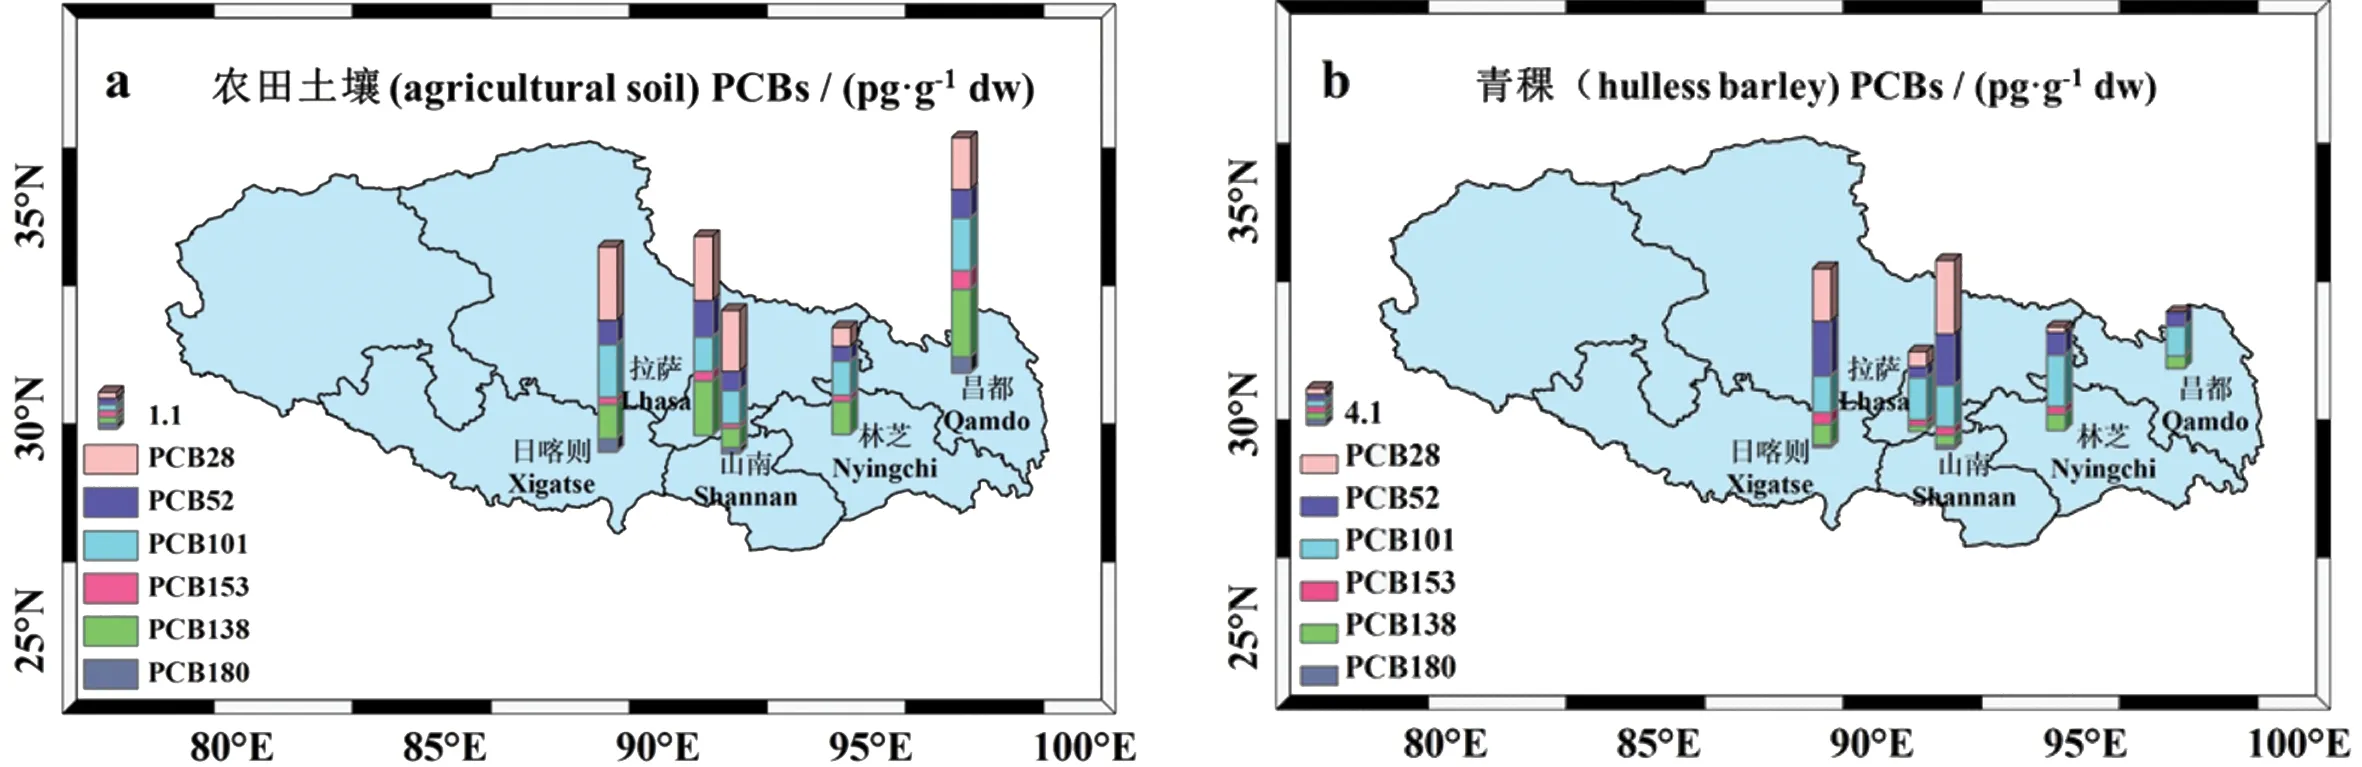
图2 西藏(a)农田土壤和(b)青稞PCBs的空间分布特征Fig. 2 The spatial distribution of PCBs in (a) agricultural soil and (b) hulless barley of the Tibet
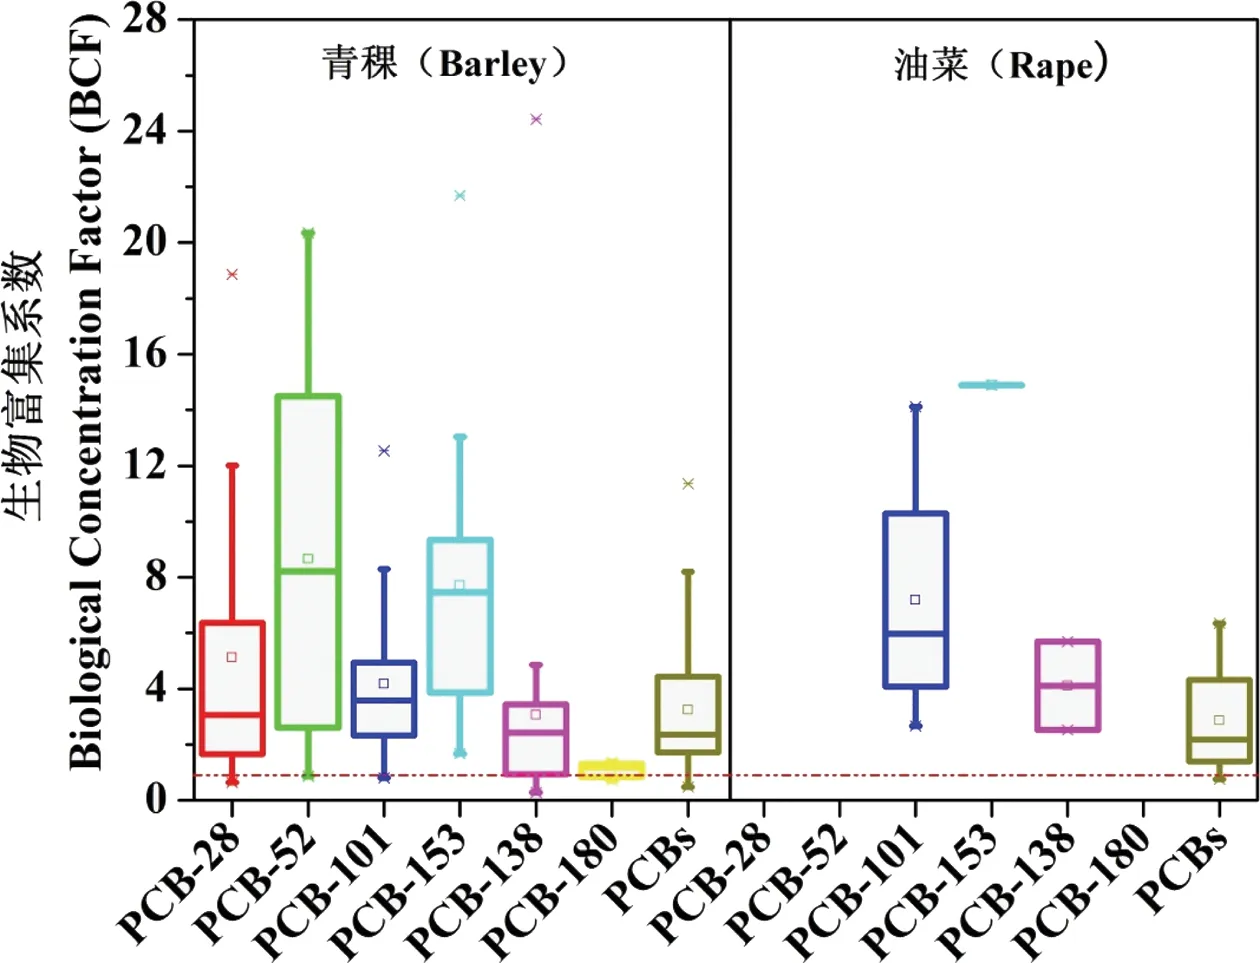
图3 西藏青稞和油菜PCBs的生物富集系数 注:图中长方形的上下两条边分别表示上和下四分位数,星号表示最大最小值,横线表示中位数,小方框表示平均值,红色虚线表示生物富集系等于1。Fig. 3 The bioaccumulation factor of PCBs for highland barley and rape in the Tibet Note:The box is defined by the 25th and 75th percentiles, whiskers mark the maximum and minimum, the median is represented by a horizontal line, the mean by a square, the values of BCF=1 is represented by a red broken line.
西藏青稞和油菜中PCBs的BCF值75%以上都大于1(图3),说明大部分PCBs在农作物中都发生了生物富集。青稞中PCB-52及PCB-153的生物富集系数较高。就平均值而言,青稞BCF的顺序是PCB-153 ≈ PCB-52 > PCB-101≈ PCB-28。虽然土壤和青稞中PCB-153和 -101的浓度和所占的百分含量都不高,但这些大分子PCBs较稳定,因而其生物富集系数也较高。由于PCB-28、-52和-180未在土壤和油菜样品中同时被检出,故油菜中这些化合物的生物富集系数无法进行表示。与青稞相比,油菜PCB-101,-153和-138的生物富集系数略高于青稞(图3)。

图4 西藏农田表层土壤PCB-52和PCB-153的环境行为Fig. 4 The environmental behaviour of PCB-52 and PCB-153 in the surface agricultural soil from the Tibet
2.4 农田土壤PCBs的环境行为模拟
进入农田土壤的PCBs不断与土壤各介质进行交换。青藏高原农田表层土壤PCBs具有怎样的环境行为?本研究选择土壤中含量较高的小分子PCB-52及生物富集系数较大的PCB-153作为被试化合物,借助土壤模型模拟了西藏农田表层土壤(面积1 ha,厚度0.1 m)PCBs的环境行为,结果如图4所示。
表层土壤PCBs的损失包括挥发、降解和淋溶3个过程。模拟结果显示,西藏农田表层土壤PCB-52和153的淋溶和挥发速率较小,比降解速率低3~4个数量级。这说明表层土壤中的PCBs输出主要以降解为主,而淋溶和挥发的贡献很小。就相分配而言,所有介质中,西藏农田土壤有机质富集的PCBs最多,占土壤PCBs总量的99.6%(图4)。植物根系吸收的PCBs(2.26×10⁻³g·m-2)比土壤有机质中PCBs含量(2.6×10⁻²g·m-2)低一个数量级(图4)。这表示植物根系从土壤中吸收的PCBs极少。此外,土壤空气、空隙水及矿物质对PCBs的储存能力也非常有限(图4)。因此,西藏农田土壤中的PCBs可能主要存储在有机质中,这与先前的很多研究结果是一致的[10, 12]。2种PCBs化合物相比,大分子PCB-153的挥发、降解、淋溶速率都低于小分子PCB-52(图4)。大分子PCBs相对稳定的理化性质可能是其在土壤中长期停留的主要原因。
将PCBs环境行为、生物富集和空间分布结合在一起,我们发现由根系向青稞传输PCB-153不是青稞中积累PCB-153的主要途径,然而青稞中PCB-153的生物富集因子却较大。植物具有有机蜡质表面能够直接吸收大气中的有机污染物,因此,青稞直接从大气中吸收PCBs可能是其对PCBs积累和富集的主要途径。在前文空间分布的研究中,青藏高原南部与南亚临近地区的青稞中有较高含量的PCBs。这种离南亚越近PCBs含量越高的现象也表明青稞能直接吸收大气中的PCBs污染物。
2.5 PCBs的食物摄入风险
PCBs进入农作物是其进入人类食物链的一种方式。此外其被牧草吸收,牦牛通过食用牧草而将PCBs摄入体内,而人类又通过食用牦牛奶和肉等制品而摄入PCBs为其进入人类食物链的另外一种方式。研究发现,由于生物富集作用,牦牛肉、奶等制品中的PCBS含量往往比牧草中高于牧草中相应污染物的含量[31],因而,即便在污染状况很低的青藏高原地区,依然有必要评估人类的PCBs食物摄入风险。
本文使用联合国粮农组织(FAO)和世界卫生组织(WHO)提出的个体食物暴露评估方法[41]计算了西藏人群的指示性PCBs摄入风险:
式中,Cij为个体i摄入的食物量(g·d-1),Tj为食品j中PCBs浓度(mg·kg-1鲜重),Wi为个体i的体重(本文假设为60 kg)。考虑到藏民族的食品结构,本文选择青稞、牛肉、牛奶和酥油计算PCBs摄入量。食品人均消费量来自于西藏自治区700户居民抽样调查数据[42]。青稞和蔬菜PCBs数据来自于本研究,牛奶数据来自于文献[31],酥油数据则取文献[29]和[30]的平均值。牛肉中PCBs浓度低于检出限[31],故计算过程中未考虑牛肉对PCBs摄入量的贡献。
目前尚无指示性PCBs摄入量的安全标准,Arnich等[43]综合考虑了PCBs的毒性阈值、环境分布等因素,认为10 ng·kg-1bw·d-1可作为PCBs摄入量的安全阈值。经计算,西藏居民的平均PCBs摄入量为0.75 ng·kg-1bw·d-1,较安全阈值低至少一个数量级,即PCBs食物摄入对西藏居民健康的影响较小。青稞、蔬菜、牛奶、酥油的贡献分别为0.07、0.02、0.01和0.66 ng·kg-1bw·d-1。可见,酥油可能是西藏居民摄入PCBs的主要食品。而青稞和蔬菜的贡献仅占总摄入量的9.3%和1.3%,这表明农田污染并非西藏人群摄入PCBs的主要途径。
综上可知,青藏高原虽自身污染排放有限但其却毗邻于印度等主要的南亚污染国家。南亚污染物在印度季风驱动下传输至青藏高原已经是不争的事实[22, 24, 44-45]。在此基础上,本研究确认了农作物吸收南亚排放PCBs的方式为直接从大气吸收而不是由根系从土壤中吸收。本研究估算了藏族同胞通过食用农作物和牦牛肉、奶而可能的食用风险,发现藏族同胞对PCBs的摄入风险较小。基于较低的大气、土壤及农作物浓度与较低的摄入风险可以初步判断南亚排放PCBs对西藏生态系统的影响较小,但是,鉴于南亚电子垃圾焚烧与拆卸有持续的趋势,PCBs对西藏生态系统的影响,尤其是对藏南与南亚接壤地区的生态系统的影响也将是持续的。藏南生态类型多样,包括森林、草甸、湖泊与农田等,未来的工作应当着重关注南亚污染物在藏南森林、草甸和湖泊生态系统中的积累和生态风险。
[1] United Nations Environment Programme. Regionally based assessment of persistent toxic substances: Central and North East Asia region [R]. Nairobi, Kenya: UNEP, 2001
[2] Sobek A, McLachlan M S, Borga K, et al. A comparison of PCB bioaccumulation factors between an arctic and a temperate marine food web [J]. Science of the Total Environment, 2010, 408(13): 2753-2760
[3] Safe S H. Polychlorinated biphenyls (PCBs): Environmental impact, biochemical and toxic responses, and implications for risk assessment [J]. Critical Reviews in Toxicology, 1994, 24(2): 87-149
[4] Lohmann R, Breivik K, Dachs J, et al. Global fate of POPs: Current and future research directions [J]. Environmental Pollution, 2007, 150(1): 150-165
[5] Meijer S N, Ockenden W A, Sweetman A, et al. Global distribution and budget of PCBs and HCB in background surface soils: Implications or sources and environmental processes [J]. Environmental Science & Technology, 2003, 37(4): 667-672
[6] Breivik K, Sweetman A, Pacyna J M, et al. Towards a global historical emission inventory for selected PCB congeners - A mass balance approach 1. Global production and consumption [J]. Science of the Total Environment, 2002, 290(1-3): 181-198
[7] Solorzano-Ochoa G, de la Rosa D A, Maiz-Larralde P, et al. Open burning of household waste: Effect of experimental condition on combustion quality and emission of PCDD, PCDF and PCB [J]. Chemosphere, 2012, 87(9): 1003-1008
[8] Zhang Y, Luo X J, Mo L, et al. Bioaccumulation and translocation of polyhalogenated compounds in rice (Oryza sativa L.) planted in paddy soil collected from an electronic waste recycling site, South China [J]. Chemosphere, 2015, 137: 25-32
[9] Martinez A, Erdman N R, Rodenburg Z L, et al. Spatial distribution of chlordanes and PCB congeners in soil in Cedar Rapids, Iowa, USA [J]. Environmental Pollution, 2012, 161: 222-228
[10] Dalla Valle M, Jurado E, Dachs J, et al. The maximum reservoir capacity of soils for persistent organic pollutants:Implications for global cycling [J]. Environmental Pollution, 2005, 134(1): 153-164
[11] Nam J J, Gustafsson O, Kurt-Karakus P, et al. Relationships between organic matter, black carbon and persistent organic pollutants in European background soils: Implications for sources and environmental fate [J]. Environmental Pollution, 2008, 156(3): 809-817
[12] Sweetman A J, Dalla Valle M, Prevedouros K, et al. The role of soil organic carbon in the global cycling of persistent organic pollutants (POPs): Interpreting and modelling field data [J]. Chemosphere, 2005, 60(7): 959-972
[13] Ockenden W A, Breivik K, Meijer S N, et al. The global re-cycling of persistent organic pollutants is strongly retarded by soils [J]. Environmental Pollution, 2003, 121(1): 75-80
[14] Moeckel C, Nizzetto L, Strandberg B, et al. Air-boreal forest transfer and processing of polychlorinated biphenyls [J]. Environmental Science & Technology, 2009, 43(14): 5282-5289
[15] Li Y F, Harner T, Liu L, et al. Polychlorinated biphenyls in global air and surface soil: Distributions, air-soil exchange, and fractionation effect [J]. Environmental Science & Technology, 2010, 44(8): 2784-2790
[16] Ilyina T, Lammel G, Pohlmann T. Mass budgets and contribution of individual sources and sinks to the abundance of γ-HCH, α-HCH and PCB 153 in the North Sea [J]. Chemosphere, 2008, 72(8): 1132-1137
[17] Komprda J, Komprdova K, Sanka M, et al. Influence of climate and land use change on spatially resolved volatilization of persistent organic pollutants (POPs) from background soils [J]. Environmental Science & Technology, 2013, 47(13): 7052-7059
[18] Bozlaker A, Odabasi M, Muezzinoglu A. Dry deposition and soil-air gas exchange of polychlorinated biphenyls (PCBs) in an industrial area [J]. Environmental Pollution, 2008, 156(3): 784-793
[19] 中国科学院青藏高原综合考察队. 西藏农业地理[M]. 北京: 科学出版社, 1984: 1-980
[20] Garlapati V K. E-waste in India and developed countries: Management, recycling, business and biotechnological initiatives [J]. Renewable and Sustainable Energy Reviews, 2016, 54: 874-881
[21] Iqbal M, Breivik K, Syed J H, et al. Emerging issue of e-waste in Pakistan: A review of status, research needs and data gaps [J]. Environmental Pollution, 2015, 207: 308-318
[22] Sheng J J, Wang X P, Gong P, et al. Monsoon-driven transport of organochlorine pesticides and polychlorinated biphenyls to the Tibetan Plateau: Three year atmospheric monitoring study [J]. Environmental Science & Technology, 2013, 47(7): 3199-3208
[23] Gong P, Wang X P, Sheng J J, et al. Variations of organochlorine pesticides and polychlorinated biphenyls in atmosphere of the Tibetan Plateau: Role of the monsoon system [J]. Atmospheric Environment, 2010, 44(21-22): 2518-2523
[24] Ren J, Wang X P, Xue Y G, et al. Persistent organic pollutants in mountain air of the southeastern Tibetan Plateau: Seasonal variations and implications for regional cycling [J]. Environmental Pollution, 2014, 194: 210-216
[25] Wang P, Zhang Q, Wang Y, et al. Altitude dependence of polychlorinated biphenyls (PCBs) and polybrominated diphenyl ethers (PBDEs) in surface soil from Tibetan Plateau, China [J]. Chemosphere, 2009, 76(11): 1498-1504
[26] Gai N, Pan J, Tang H, et al. Selected organochlorine pesticides and polychlorinated biphenyls in atmosphere at Ruoergai high altitude prairie in eastern edge of Qinghai-Tibet Plateau and their source identifications [J]. Atmospheric Environment, 2014, 95: 89-95
[27] Xiao H, Kang S, Zhang Q, et al. Transport of semivolatile organic compounds to the Tibetan Plateau: Monthly resolved air concentrations at Namco [J]. Journal of Geophysical Research, 2010, 115: D16310
[28] Wang X P, Gong P, Yao T D, et al. Passive air sampling of organochlorine pesticides, polychlorinated biphenyls, and polybrominated diphenyl ethers across the Tibetan Plateau [J]. Environmental Science & Technology, 2010, 44(8): 2988-2993
[29] Wang C F, Wang X P, Yuan X H, et al. Organochlorine pesticides and polychlorinated biphenyls in air, grass and yak butter from Namco in the central Tibetan Plateau [J]. Environmental Pollution, 2015, 201: 50-57
[30] Wang Y, Yang R, Wang T, et al. Assessment of polychlorinated biphenyls and polybrominated diphenyl ethers in Tibetan butter [J]. Chemosphere, 2010, 78(6): 772-777
[31] Pan J, Gai N, Tang H, et al. Organochlorine pesticides and polychlorinated biphenyls in grass, yak muscle, liver, and milk in Ruoergai high altitude prairie, the eastern edge of Qinghai-Tibet Plateau [J]. Science of The Total Environment, 2014, 491-492: 131-137
[32] The Canadian Centre for Environmental Modelling and Chemistry. Development and application of models of chemical fate in Canada:Modelling guidance document [EB/OL]. (May 2005). http://www.trentu.ca/academic/aminss/envmodel/CEMNReport200501.pdf
[33] Wang X P, Sheng J J, Gong P, et al. Persistent organic pollutants in the Tibetan surface soil: Spatial distribution, air-soil exchange and implications for global cycling [J]. Environmental Pollution, 2012, 170: 145-151
[34] Ren N Q, Que M, Li Y F, et al. Polychlorinated biphenyls in Chinese surface soils [J]. Environmental Science & Technology, 2007, 41(11): 3871-3876
[35] 滕应, 郑茂坤, 骆永明, 等. 长江三角洲典型地区农田土壤多氯联苯空间分布特征 [J]. 环境科学, 2008, 29(12): 3477-3482
Teng Y, Zheng M K, Luo Y M, et al. Spatial distribution of soil PCBs congeners in typical area of Yangtze River Delta region [J]. Environmental Science, 2008, 29(12): 3477-3482 (in Chinese)
[36] Wang H, An Q, Dong Y H, et al. Contamination and congener profiles of polychlorinated biphenyls from different agricultural top soils in a county of the Tai Lake region, China [J]. Journal of Hazardous Materials, 2010, 176(1-3): 1027-1031
[37] Zhu Z C, Chen S J, Zheng J, et al. Occurrence of brominated flame retardants (BFRs), organochlorine pesticides (OCPs), and polychlorinated biphenyls (PCBs) in agricultural soils in a BFR-manufacturing region of North China [J]. Science of the Total Environment, 2014, 481: 47-54
[38] Mahmood A, Syed J H, Malik R N, et al. Polychlorinated biphenyls (PCBs) in air, soil, and cereal crops along the two tributaries of River Chenab, Pakistan: Concentrations, distribution, and screening level risk assessment [J]. Science of the Total Environment, 2014, 481: 596-604
[39] Armitage J M, Hanson M, Axelman J, et al. Levels and vertical distribution of PCBs in agricultural and natural soils from Sweden [J]. Science of the Total Environment, 2006, 371(1-3): 344-352
[40] Mikes O, Cupr P, Trapp S, et al. Uptake of polychlorinated biphenyls and organochlorine pesticides from soil and air into radishes (Raphanus sativus) [J]. Environmental Pollution, 2009, 157(2): 488-496
[41] FAO/WHO. Food comsumption and exposure assessment of chemicals. Report of a FAO/WHO consultation, 10-14 February [R]. Geneva, Switzerland: FAO/WHO, 1997
[42] 刘键, 李祥妹, 钟祥浩. 西藏自治区居民食品消费结构与粮食对策[J]. 山地学报, 2004, 22(3): 286-291
Liu J, Li X, Zhong X. Consumption structure of food and the countermeasure of grain in Tibet [J]. Journal of Mountain Science, 2004, 22(3): 286-291 (in Chinese)
[43] Arnich N, Tard A, Leblanc J C, et al. Dietary intake of non-dioxin-like PCBs (NDL-PCBs) in France, impact of maximum levels in some foodstuffs [J]. Regulatory Toxicology and Pharmacology, 2009, 54(3): 287-293
[44] Xu B Q, Cao J J, Hansen J, et al. Black soot and the survival of Tibetan glaciers [J]. Proceedings of the National Academy of Sciences, 2009, 106: 22114-22118
[45] Cong Z Y, Kang S C, Kawamura K, et al. Carbonaceous aerosols on the south edge of the Tibetan Plateau: Concentrations, seasonality and sources [J]. Atmospheric Chemistry and Physics, 2015, 15: 1573-1584
◆
Distribution,Environmental Behavior, and Health Risks of Polychlorinated Biphenyls in the Tibetan Agricultural Soil and Crops
Wang Chuanfei1,2, Gong Ping1,2, Wang Xiaoping1,2,*, Yao Tandong1,2
1. Key Laboratory of Tibetan Environmental Changes and Land Surface Process, Institute of Tibetan Plateau Research, Chinese Academy of Sciences, Beijing 100101, China 2. CAS Center for Excellence in Tibetan Plateau Earth Sciences, Beijing 100101, China
Polychlorinated biphenyls (PCBs) emitted in South Asia can undergo long-range atmospheric transport to reach the southern Tibetan Plateau. Once PCBs are deposited into the agricultural soil of this region they have the potential to accumulate in the human body via food chains, and ultimately increase the health risk for those consuming the produce from these lands. However, despite this important issue, few studies have examined the environmental processes involved, or assessed the health risk, of PCBs in agricultural soil and crops. In the present study, agricultural soil and crops were collected from the southern Tibetan Plateau. The average concentrations of PCBs in the soil, in hulless barley (Hordeum vulgare L. var nudum Hook. f), and in rape (Brassica campestris L.) were found to be 5.1, 13.5 and 10.9 pg·g-1dw, respectively, which are at the low end of global levels. The bio-concentration factors of all the vegetation were greater than 1, suggesting PCB accumulation. Results from a fugacity model showed that 99.6% of soil PCBs accumulated in the soil organic matter, while only 0.38% of PCBs were taken up by the roots of crops, implying that the main source of PCBs in the crops was atmospheric deposition. The dietary intake of non-dioxin-like PCBs in the southern Tibetan Plateau was found to be 0.75 ng·kg-1bw·d-1, which is more than one order of magnitude lower than the “guidance value”. In conclusion, the health risks of PCBs via dietary exposure in the southern Tibetan Plateau are low.
polychlorinated biphenyls (PCBs); Tibet; spatial distribution; fugacity model; health risk
10.7524/AJE.1673-5897.20151202003
国家自然科学基金(41222010, 41571463)
王传飞(1987- ),女,博士,研究方向为青藏高原环境污染,E-mail: wangchuanfei@itpcas.ac.cn
*通讯作者(Corresponding author), E-mail: wangxp@itpcas.ac.cn
2015-12-02 录用日期:2016-01-02
1673-5897(2016)2-339-08
X171.5
A
简介:王小萍(1976-),女,博士,研究员,主要研究方向为青藏高原环境污染与变化。
王传飞, 龚平, 王小萍, 等. 西藏农田土和农作物中多氯联苯的分布、环境行为和健康风险评估[J]. 生态毒理学报,2016, 11(2): 339-346
Wang C F, Gong P, Wang X P, et al. Distribution, environmental behavior, and health risks of polychlorinated biphenyls in the tibetan agricultural soil and crops [J]. Asian Journal of Ecotoxicology, 2016, 11(2): 339-346 (in Chinese)
