Does more data mean higher efficiency? An experience from pre- and post-treatment study with missing data
2016-12-09HongyueWANGJingPENGJuilaZHENGBokaiWANGTUChangyongFENG
Hongyue WANG, Jing PENG, Juila Z. ZHENG, Bokai WANG, J. X. TU, Changyong FENG,2,*
·Biostatistics in psychiatry (34)·
Does more data mean higher efficiency? An experience from pre- and post-treatment study with missing data
Hongyue WANG1, Jing PENG1, Juila Z. ZHENG3, Bokai WANG1, J. X. TU4, Changyong FENG1,2,*
paired t-test; likelihood ratio test; asymptotical relative efficiency
1. Introduction
It is well known in data analysis that more data usually offer more information to make statistical inferences.For example, suppose we want to find the average body weight of 2-year-old boys in New York City. For this purpose, we can randomly select 100 boys from the targeted population, obtain their individual body weight,and calculate the average body weight and the standard deviation. If possible, we can also randomly select 10,000 boys and do the same calculations. Usually, the average weights in both cases are very similar. However,the standard deviation of the latter is only about 10% of the former one.
Student’s t-test[1]is one of the most popular statistical tools used to compare the mean value with continuously distributed data. Let be a random sample from a population of interest with mean value µ and variance σ2. The sample mean and sample variance are

which are unbiased estimators of µ and σ2,respectively[2]. A widely used method to test the hypothesis H0: µ=µ0is the test statistic defined by

If the data follows normal distribution, then under the null hypothesis H0, the test statistic T in (1) has a t-distribution with n-1 degrees of freedom[3]. If the data is not normally distributed, the exact distribution of T is usually not available. However, as long as the sample size n is large enough, we can use the standard normal distribution to approximate the distribution of T,which is the direct result of the central limit theorem in probability theory[4]. The test statistic in (1) is also called the one-sample t-test in statistics[3].
Now consider the case of two independent samples. Suppose Xi1, Xi2, …, Xin, i=1,2 are data from two independent populations with means µiand variances σi2, i=1, 2. Letand Si2be the sample means and sample variances in these two samples. The widely used test statistic for testing the hypothesis is H0: µ1=µ2is

If data are normally distributed in both samples and σ12=σ22, under H0, T in (2) has a t-distribution with degrees of freedom n1+ n2− 2. If σ12≠σ22, the distribution of T in (2) is not so straightforward. This is the well-known Behrens-Fisher problem[3]in statistics and is out of the scope of this paper. However, if both n1and n2are large enough, we can still use the standard normal distribution to approximate the distribution of T.The test statistic in (2) is also called the two-sample t-test in statistics[3]. In two-sample t-test, the groups usually have different sample sizes.
Consider another scenario. Suppose we have a set of randomly selected, matched pair observations(Xi1, Xi2), i=1, . . .n, from a study population. This kind of data is very typical in pre- and post- treatment study.For example, in a hypertension study, Xi1and Xi2are the blood pressure of patient i before and after the treatment. This is different from the two independent samples considered above. For matched pair data, Xi1and Xi2are correlated as they are two measurements on the same individual. Suppose in the study population,the mean blood pressures before and after the treatment are µ1and µ2, respectively. The treatment effect can be measured by µ1- µ2. Let Yi=Xi1− Xi2, the difference of measurements before and after treatment.Let Y and SY
2be the sample mean and sample variance of Yi, i=1, ... n. The test statistic widely used in statistics to test the hypothesis H0: µ1=µ2is

If (Xi1, Xi2) has a bivariate distribution[2], the test statistic in (3) has t-distribution with degrees of freedom n − 1,and is called the paired t-test in statistics[3].
Note that the two-sample t-test and the paired t-test can be written in the same form

In this paper we focus on the matched pair data.In the construction of test statistic (3) we assume that the pre- and post-treatment data are available for each individual. The power of the test increases with the sample size. However, missing data is very typical for pre- and post-treatment studies. Usually the pretreatment measurement is available for each individual.However, the post-treatment data may be missing for some individuals. This puts some challenges on the data analysis. For example, to test the hypothesis of no treatment effect, we may construct the test statistics of the same structure as (4). However, for the estimation of the mean value of the pre-treatment measurements,should we use all individuals, or only the individuals with complete pairs? What is the relative efficiency of the test statistics based these two different estimations?
The paper is organized as follows. Section 2 introduces two widely used moment-based test statistics, and calculates their relative efficiency. In Section 3 we construct a test which is more powerful that the tests in Section 2, and is equivalent to the likelihood ratio test when the data is from bivariate normal distribution. In Section 4, we do some simulation studies to compare the powers of these tests. Our conclusion and further discussion are reported in Section 5.
2. Two moment-based tests and their relative efficiency
Suppose the full data is (Xi1, Xi2), i=1, . . . n, where Xi1and Xi2are pre- and post-treatment measurements,respectively. The pre-treatment measurement is observed for every individual. However, for some individuals, the post-treatment measurements are not observed. For individual i, we define an indicator Ri,with Ri=1 if Xi2is observed, and Ri=0 otherwise. Hence the number of complete pairs (i.e. both pre- and posttreatment measurements are observed) isData can be missing in very complicated patterns in biomedical research, especially in longitudinal followup studies. See Rubin[5], Little and Rubin[6]for more theoretical discussions about the missing patterns.In this manuscript, we consider a very simple missing patter where the post-treatment is assumed to be missing completely at random (MCAR)[5,6], which means that the probability that Xi2is missing does not dependent on Xi1. This is a strong assumption. For example, suppose Xi1and Xi2are the blood pressures before and after the treatment. If the patient skips the post-treatment because he accidently forgets the appointment, the MCAR assumption is satisfied.However, if the patient thinks his blood pressure at the first appointment is in the normal range and he doesn’t want to waste time to do the second measurement, the MCAR assumption is invalid in this case as the missing depends on the first measurement.2
We assume the mean and variance of Xijare µjand σj, j=1, 2. Since Xi1and Xi2are from the same individual,they are usually correlated (assuming their correlation coefficient is ρ). Given the data, these parameters need to be estimated in order to make appropriate statistical inference. With MCAR data-consistent estimators can be easily obtained for all these parameters.
For the pre- and post-treatment data, we are interested in the treatment effect which can be measured by µ1−µ2. Statistically, the hypothesis for no treatment effect is the same as H0: µ1=µ2.
2.1 Test statistic based on all available data
From formula (4) we know that test statistic depends on the estimation of the pre- and post- treatment means and the (estimator of) the variance of the sample mean difference. In this section, the sample mean (denoted by) of the pre-treatment measurement is calculated based on all individuals, and the sample mean (denoted by) of the post-treatment is calculated only based on the post-treatment measurements, i.e.

The t-test based on all available data is

The exact distribution of TAis difficult to calculate.However, under MCAR, when sample size n is large enough, the normal distribution can b[3].used to appropriate the asymptotic distribution of TA
2.2 Test statistic based on complete pairs
In this method, the sample mean (denoted by)of the pre-treatment measurement is only based on individuals with complete pairs, i.e.

The t-test is exactly the paired t-test

Similarly, under MCAR, the asymptotic distribution of TCcan be approximated by normal distribution for large sample size.
2.3 Asymptotic relative efficiency
The relative efficiency of two tests is used to characterize their powers[3]. Let rσ=σ1/σ2, the ratio of the standard deviations of the pre- and post-treatment measurements. Let π denote the probability that the post-treatment measurement is observed. It can be proved that the asymptotic relative efficiency of TCwith respect to TAis
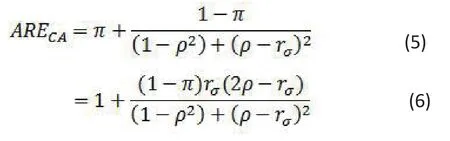
Here ARECA> (or <) 1 means that TCis more (or less)powerful than TAto detect the pre- and post- treatment difference if it exists. From formula (5) we can see that the relative efficiency depends on the proportion of missing (1 - π), the ratio of the variances of the pre- and post-treatment measurements, and their correlation.More speci fically, we have the following conclusions about ARECA:
(i) Formula (5) shows that ARECAis always greater than π.This is very intuitive as π is the proportion of patients without missing data.
(ii) If rσ ≥ 2, TAis more powerful than TC.
(iii) If rσ /2 ≤ ρ < 1, TCis more powerful than TA.
(iv) If −1 ≤ ρ < rσ /2 < 1, TAis more powerful than TC.
(v) If rσ1, i.e. σ1=σ2, then . This means that for highly(positively) correlated data, TCis more powerful than TA.
It is interesting to see that TAis not always more powerful than TC, as one would have expected since the former test is based on more data than the latter one. When σ1< 2σ2, TCis actually more efficient than TAif rσ/2 ≤ ρ ≤ 1. In addition, in the special case of σ1=σ2,TCcan be much more efficient than TAif the pre- and post-treatment measurements are highly correlated.
3. An optimal combination of moment-based tests
Section 2 shows that although TAand TCare the same when data is not missing; none of them is uniformly more powerful than the other when data is missing completely at random. A very intuitive idea to find an intermediate point between those two tests which may be at least as powerful as both of them. More precisely,consider the following set

Each element in F is a valid test, and TAand TCare two special elements in this family.
Theorem 1. Among all tests defined in (7), T(λo) is the most powerful one, where

and

The proof of this theorem is out of the scope of this paper, but it is available from the authors upon request.Remark: It is well known that if the data is from bivariate normal distribution, the likelihood ratio test(LRT) is the most efficient test[3]. We can prove that T(λo) in Theorem 1 is equivalent to the likelihood ratio test for bivariate normal data. It only depends on the first two moments of the data, is easy to use, and is more powerful than currently widely used two tests TA and TC. Same idea of combination has been used in other area of statistics. For example, Oakes and Feng[7]constructed of an optimal linear combination of the stratified and unstratified log-rank tests[8].
4. Simulation results
In this section we compare the empirical power of TA,TCand T(λo) for different sample sizes and different parameters in the distribution of the data. The significance level was set at 5% for all cases. About 30%of the post-treatment data is missing. For each test statistic T, we first standardize it to make its (asymptotic)variance equal 1. The empirical power is obtained from 10, 000 Monte Carlo replications. The empirical power is the proportion of times that |T|>1.96.
Case 1. Bivariate normal data
In this case, the matched pair (Xi1, Xi2) are generated from bivariate normal distribution[2]. We report the powers of TA, TC, T(λo) and LRT. The result is in Table 1.

Table 1: Comparison of powers of test statistics (bivariate normal data)
(1) As expected, given the parameters in the distribution of the data, the power of each test increases with the sample size.
(2) For TAand TC, none of them is always more powerful than the other. For example, given sample size n=200, when µ1=0, µ2=0.5, σ1=3.0, σ2=1.0, and ρ=0.6, the powers of TAand TCare 0.77 and 0.65,respectively. However, when µ1=0, µ2=0.5, σ1=1.0,σ2=2.0, and ρ=0.6, their powers are 0.93 and 0.95,respectively.
(3) In any scenario, T(λo) is more powerful than TAand TCeven when sample size is relatively small (e.g. n=50),and it always has the same power as the likelihood ratio test.
Case 2. Mixed normal-exponential data
The data is generated in the following form:

where Xi11, Xi21, and Xi12are independent random variables; Xi11and Xi21have normal distribution, and Xi12has exponential distribution. In this case, the data does not have bivariate normal distribution. However,as long as the sample size is large enough, we can still use the t-test to compare the pre- and post-treatment mean values. Table 2 reports the empirical powers of TA, TC, and T(λo). It shows that neither TAnor TCis more powerful than the other in all situations. However, T(λo)is always more powerful than both of them.

Table 2. Comparison of powers of test statistics (mixed normal-exponential data)
5. Conclusion
In the pre- and post-treatment studies, if the data is missing completely at random, we can construct test statistics either using all available data or using the complete pairs. These two methods only use the first two moments of the data and are very easy to implement. However, none of these two methods is uniformly better than the other in all cases. The relative efficiency of these two methods depends on the proportion of missing, the ratio of the variances,and the correlation of two measurements on the same individuals. In this paper, we propose a databased method which is more powerful than those two methods. In fact, it is the most efficient test when data has bivariate normal distribution.
Missing data is a typical problem in pre- and posttreatment studies, and the missing pattern may be very complicated. MCAR is an over-simplified assumption.Another more realistic and still mathematically tractable missing pattern is missing at random (MAR).Generalizing our method to MAR data is in progress.
Acknowledgements
This study was supported by a pilot grant (PI: Feng) from the Clinical and Translational Sciences Institute at the University of Rochester Medical Center.
Conflict of interest statement
The authors report no conflict of interest related to this manuscript.
Author’s contribution
Hongyue Wang, Bokai Wang, and Changyong Feng:theoretical derivation and revision. Julia Zheng, Jing Peng, and J. X. Tu: Simulation manuscript drafting
1.Student. The probable error of a mean. Biometrika. 1908;6(1): 1-25
2.Lehmann EL. Theory of Point Estimation. New York:Springer-Verlag; 1983
3.Lehmann EL. Testing Statistical Hypotheses (2nd ed). New York: Springer-Verlag; 1982
4.Durrett R. Probability: Theory and Examples (4th ed). New York: Cambridge University Press; 2010
5.Rubin DB. Inference and missing data. Biometrika. 1976;63(3): 581-592. doi: http://dx.doi.org/10.2307/2335739
6.Little RJA, Rubin DR. Statsitical Analysis with Missing Data(2nd ed). New York: Wiley; 2002
7.Oakes D, Feng C. Combining stratified and unstratified log-rank tests in paired survival data. Stat Med. 2010;29(16):1735-1745. doi: http://dx.doi.org/10.1002/sim.3921
8.Andersen PK, Borgan Ø, Gill RD, Keiding N. Statistical Models Based on Counting Processes. New York: Springer; 1993

Dr. Hongyue Wang obtained her BS in Scientific English from the University of Science and Technology of China (USTC) in 1995, and PhD in Statistics from the University of Rochester in 2007. She is a Research Associate Professor in the Department of Biostatistics and Computational Biology at the University of Rochester Medical Center. Her research interests include longitudinal data analysis,missing data, survival data analysis, and design and analysis of clinical trials. She has extensive and successful collaboration with investigators from various areas, including Infectious Disease, Nephrology,Neonatology, Cardiology, Neurodevelopmental and Behavioral Science, Radiation Oncology, Pediatric Surgery, and Dentistry. She has published more than 70 statistical methodology and collaborative research papers in peer-reviewed journals.
更多的数据意味着更高的效率吗?治疗前后缺失数据的研究经验
H WANG, J PENG, JZ ZHENG, B WANG, JX TU, C FENG
配对t检验,似然比检验,渐近相对效率
In this paper we compare two moment-based methods which have been widely used to test the hypothesis of no treatment effect in pre- and post-treatment studies with data missing completely at random. Our theoretical derivation and simulation results show that the method based on all available data is not necessarily more efficient than the method that uses only complete data pairs. We propose an optimal linear combination of these two methods which turns to be more powerful in all cases.
[Shanghai Arch Psychiatry. 2016; 28(4): 235-240.
http://dx.doi.org/10.11919/j.issn.1002-0829.216058]
1Department of Biostatistics and Computational Biology, University of Rochester, Rochester, NY
2Department of Anesthesiology, University of Rochester, Rochester, NY
3Department of Microbiology and Immunology, McGill University, Montreal, QC
4State University of New York Upstate Medical University, Syracuse, NY
*correspondence: Dr. Changyong Feng. Mailing address: Department of Biostatistics and Computational Biology, University of Rochester, 601 Elmwood Ave., Box 630, Rochester, NY, USA. Postcode: NY 14642. E-mail: Changyong_feng@urmc.rochester.edu
概述:在本文中,我们比较两个以时间为基础的方法,这两个方法已被广泛用于治疗前后随机缺失数据的研究中来测试没有治疗效果的假设。我们的理论推导和模拟结果表明,基于所有可用的数据的方法并不比使用完整配对数据更有效。我们提出了一个合并这两个方法最佳的线性组合使其在所有案例中更有效。
猜你喜欢
杂志排行

上海精神医学的其它文章
- Primary delusion and the sociopolitical milieu in India - A case report & short review
- Malignant syndrome or withdrawal reaction?
- A case report of psychoactive drugs aggravating and alleviating Meige syndrome
- The prospects for the clinical application of exploratory eye movement among patients with psychotic disorders
- Repetitive transcranial magnetic stimulation combined with venlafaxine and lorazepam for treatment of generalized anxiety
- A comparison study of Quetiapine and Risperidone’s effectiveness and safety on treating alcohol-induced mental disorder