晚期青光眼患者光学相干断层扫描检测的视网膜神经纤维层厚度与视野缺损的相关性研究
2016-12-06易湘龙
钱 一, 易湘龙
(新疆医科大学第一附属医院眼科, 乌鲁木齐 830054)
·临床医学研究·
晚期青光眼患者光学相干断层扫描检测的视网膜神经纤维层厚度与视野缺损的相关性研究
钱 一, 易湘龙
(新疆医科大学第一附属医院眼科, 乌鲁木齐 830054)
目的 探讨基于光学相干断层扫描( OCT)检测晚期青光眼患者视网膜神经纤维层(RNFL)厚度的应用价值及其与患者视野缺损的相关性。方法 选择2014年4月-2015年12月新疆医科大学第一附属医院收治的青光眼患者90例(90眼)为研究对象,按照临床分期分成早中期组40例(40眼)、晚期组50例(50眼),采用OCT 检测及比较两组患者RNFL厚度与视野缺损值,并分析其相关性。结果 早中期组患者的平均眼内压(IOP)为(30.284±2.452)mmHg, 低于晚期组患者的平均IOP(34.453±3.568)mmHg(P<0.05);早中期组患者的垂直杯盘比值为(0.441±0.076),低于晚期组患者垂直杯盘比值(0.873±0.065)(P<0.05);早中期组患者平均视网膜神经纤维层厚度(RNFL) 厚度值、 上方平均 RNFL 厚度值、下方平均 RNFL 厚度值均高于晚期组患者(P<0.05);早中期组患者全视野 MD 值、 上方半侧视野MD值、下方半侧视野MD值均低于晚期组患者(P<0.05)。早中期组患者平均 RNFL 厚度与全视野 MD 值、上方半侧视野MD值、下方半侧视野MD值均呈负相关(分别为r=-0.448,r=-0.581,r=-0.634,P均<0.05);晚期组患者平均 RNFL 厚度与全视野 MD 值、上方半侧视野 MD 值、下方半侧视野 MD 值均无相关性。结论 晚期青光眼患者相对早中期患者RNFL更薄,但是视野损伤程度更严重;早中期患者 的RNFL 厚度和视野缺损具有负相关性, 而晚期患者的RNFL 厚度和视野缺损的相关性不是很明显。
晚期; 青光眼患者; 光学相干断层扫描; 视网膜神经纤维层厚度; 视野缺损
青光眼属于临床比较常见的一种疑难眼病,此病发病急骤,危险性比较大,容易致盲。青光眼患者在急性发作期1~2 d就可以完全失明[1]。假如患者没有得到及时有效的治疗,则视野会完全丧失而导致失明。由于青光眼患者在早期一般没有自觉症状,导致难以早诊断、早发现,而一经确诊大部分是处于中晚期,此时已经丧失了最佳的临床治疗时机[2]。光学相干断层扫描(OCT) 的出现,为临床定量分析青光眼患者视网膜神经纤维层( RNFL) 的厚度提供了基础[3-5]。早中期、晚期青光眼患者的RNFL厚度与视野缺损的关系是近年来研究的一个热点。本研究旨在探讨基于光学相干断层扫描( OCT)检测晚期青光眼患者视网膜神经纤维层厚度的应用价值及其与患者视野缺损的相关性,现报道如下。
1 资料与方法
1.1 一般资料 选取2014年4月-2015年12月新疆医科大学第一附属医院收治的青光眼患者90例(90眼)为研究对象,其中男性54例,女性36例;年龄21~76岁,平均年龄(60.5±4.7)岁;疾病类型:慢性原发性闭角型青光眼62例(62眼),原发性开角型青光眼28例(28眼)。入选的病例经视力、验光、眼内压等多项常规检测,符合青光眼诊断标准,不存在眼部刺激症状,没有眼部外伤史;排除干眼症患者、具有角膜接触镜佩戴史者等。按照临床视野平均缺损(MD) 分期分成早中期组40例(40眼)、晚期组50例(50眼),两组患者性别、 年龄等一般资料比较差异无统计学意义(P>0.05)。
1.2 方法
1.2.1 视野检查方法 运用IVS全自动电脑视野仪(重庆上邦医疗设备有限公司)对患者的视野进行检查。受试对象视野自然瞳孔,对于屈光不正及老视者则配戴近用眼镜接受检查。接受检查之前让患者进行暗适应约10 min。将侧眼给予遮盖,并距离固视点约33 cm。运用G2程序,光标为Ⅲ号,4 asb的背景光,视标持续的时间约100 ms, 用感光元件CCD进行监测固视。所检测的每一个视野都是检测其中央30°范围的59个检测点(图1)。为使研究结果更准确,去除视野对比结果图中的中央注视点,采用水平中线作为界点,将视野结果分成上半侧视野与下半侧视野,然后算出每半侧视野之算术平均值。

图1 环行断层扫描
1.2.2 OCT 检查方法 采用眼科光学相干断层扫描仪(深圳市斯尔顿科技有限公司)检测患者的RNFL厚度与视盘有关的形态参数,比如平均RNFL厚度、上方与下方平均RNFL厚度。RNFL厚度平均分析程序报告图见图2。OCT检测扫描位置、RNFL成像及测量位置、扫描质量见图3。

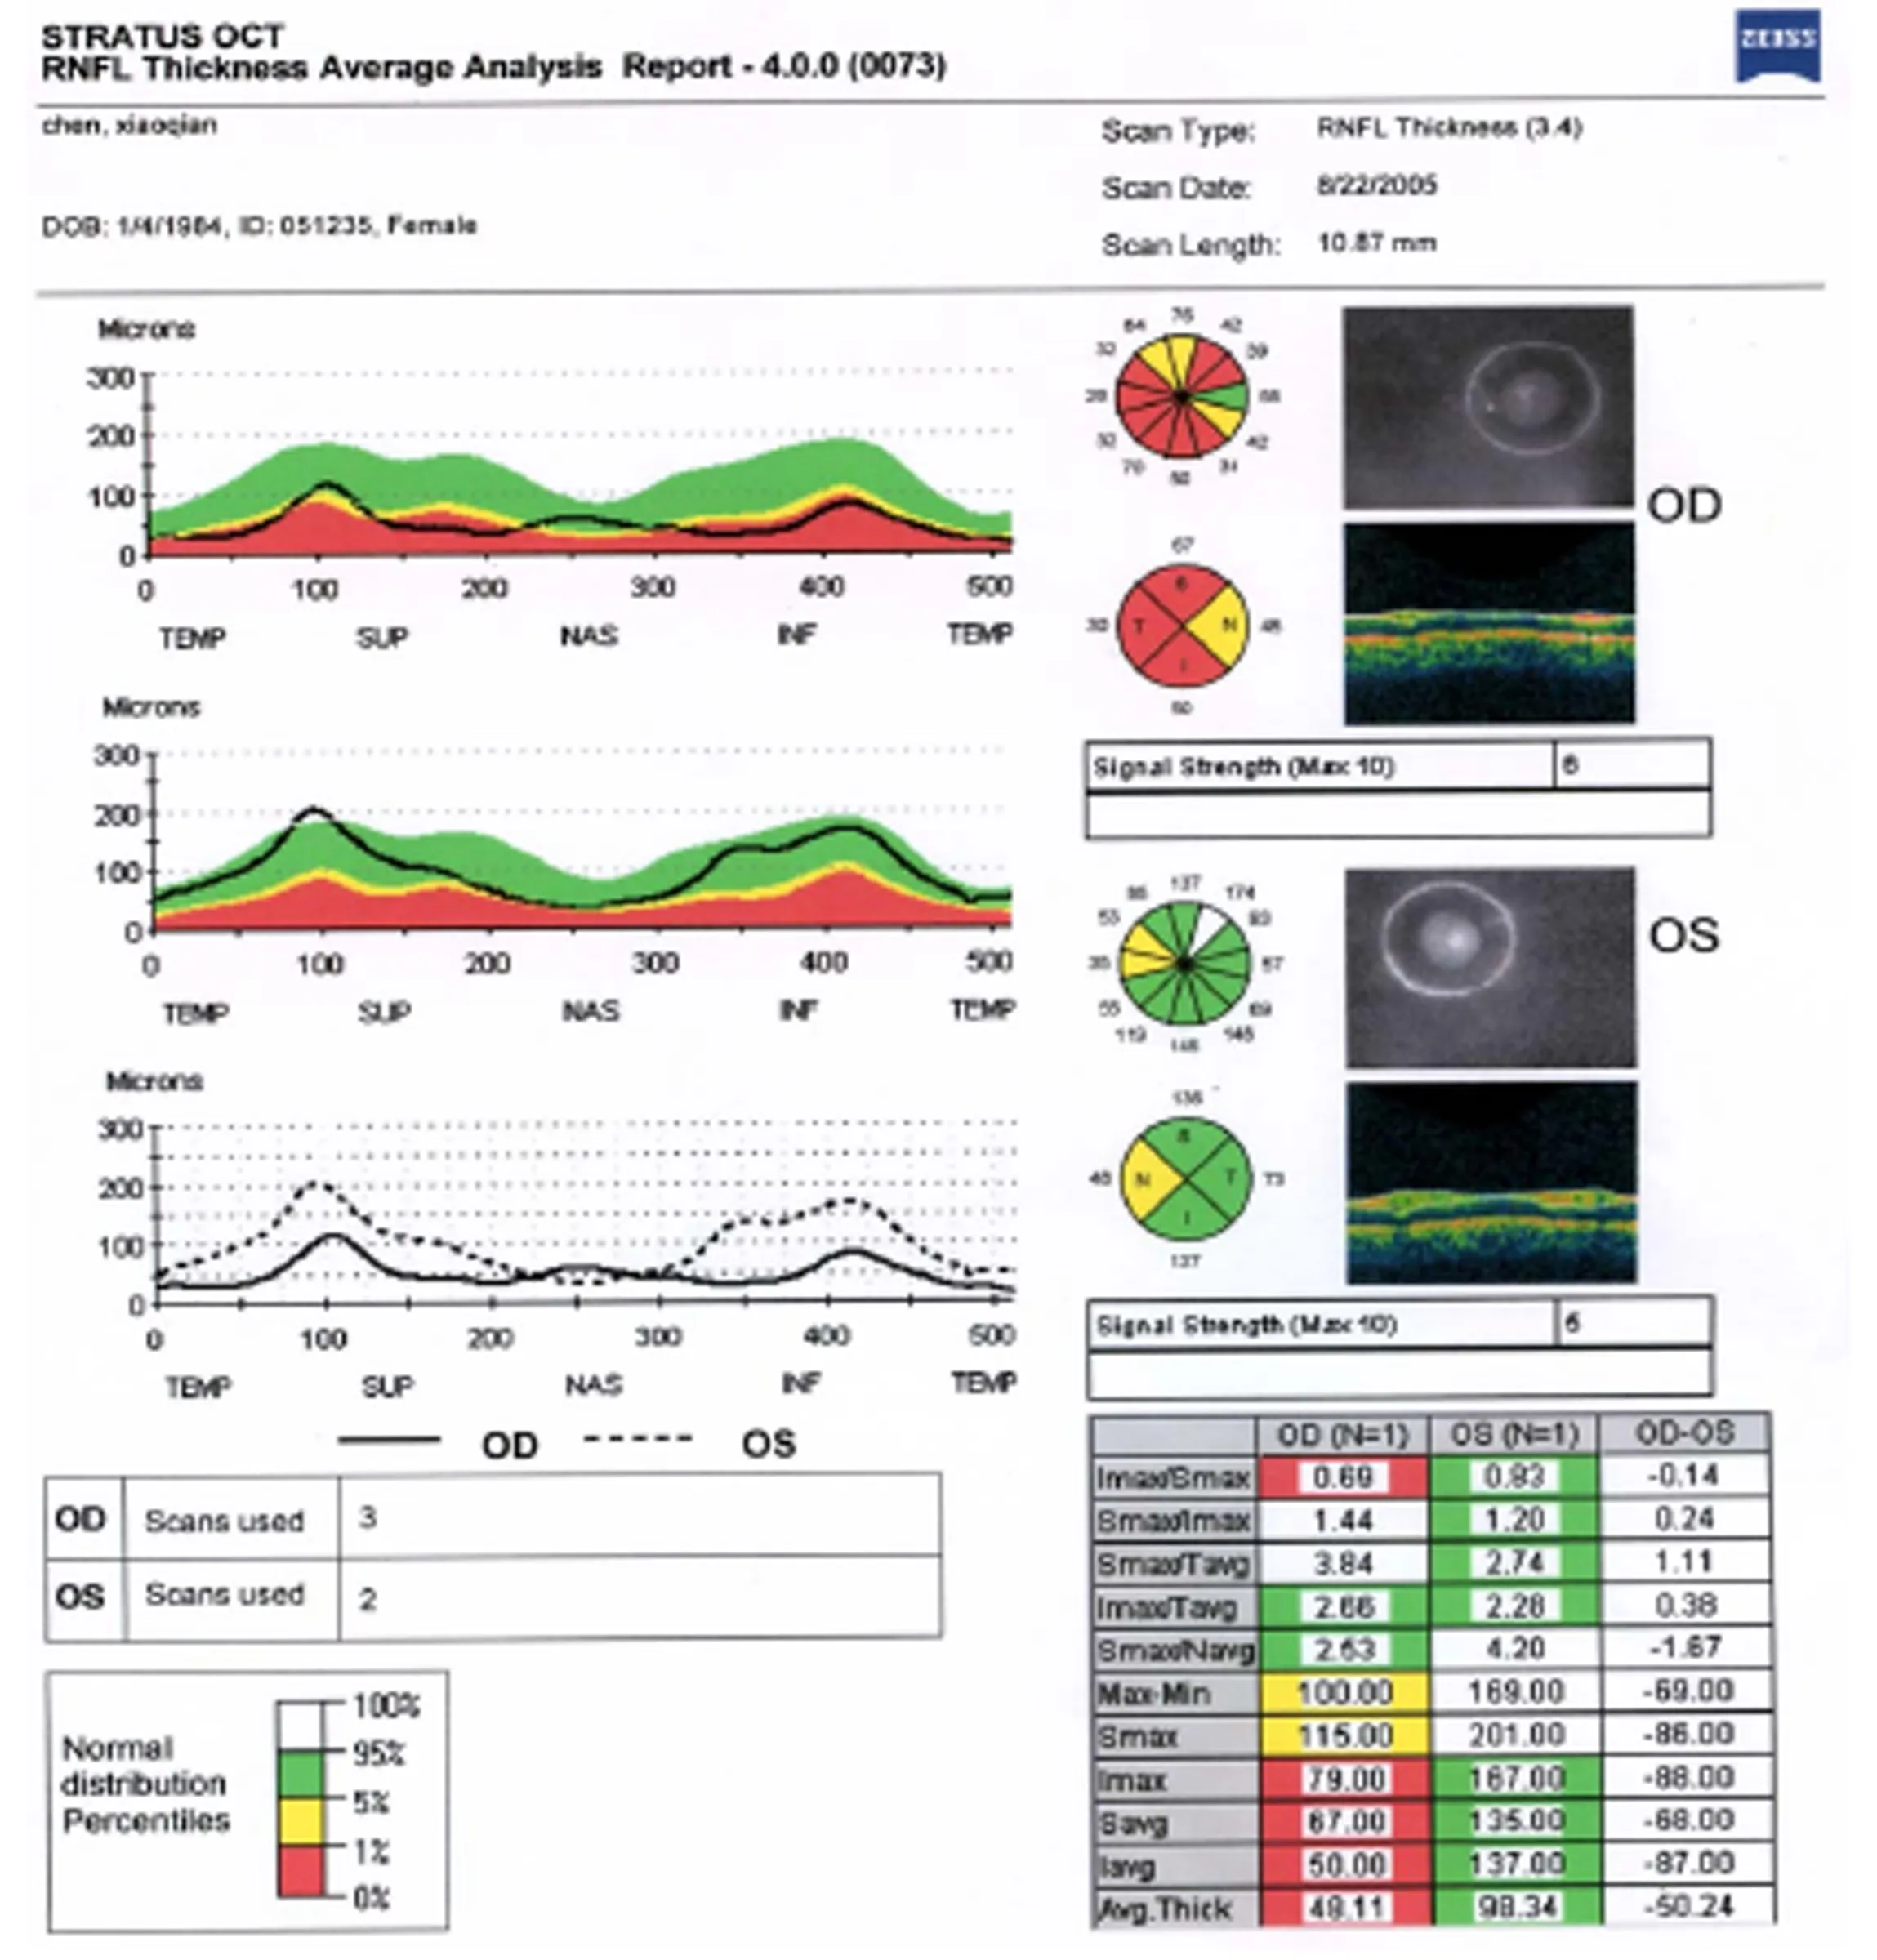
图2 RNFL 厚度平均分析程序报告图
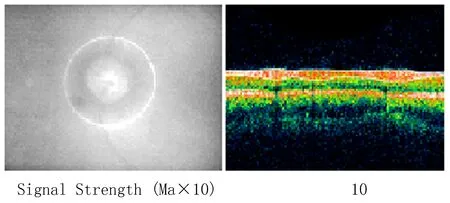
图3 OCT检测扫描位置、RNFL成像及测量位置、扫描质量
2 结果
2.1 两组平均IOP与垂直杯盘比值比较 早中期组患者的平均IOP为(30.284±2.452)mmHg,低于晚期组患者的平均IOP(34.453±3.568)mmHg (P<0.05),见图4。早中期组患者垂直杯盘比值为(0.441±0.076),低于晚期组患者垂直的杯盘比值(0.873±0.065)(P<0.05),见图5。

图4 两组平均IOP比较
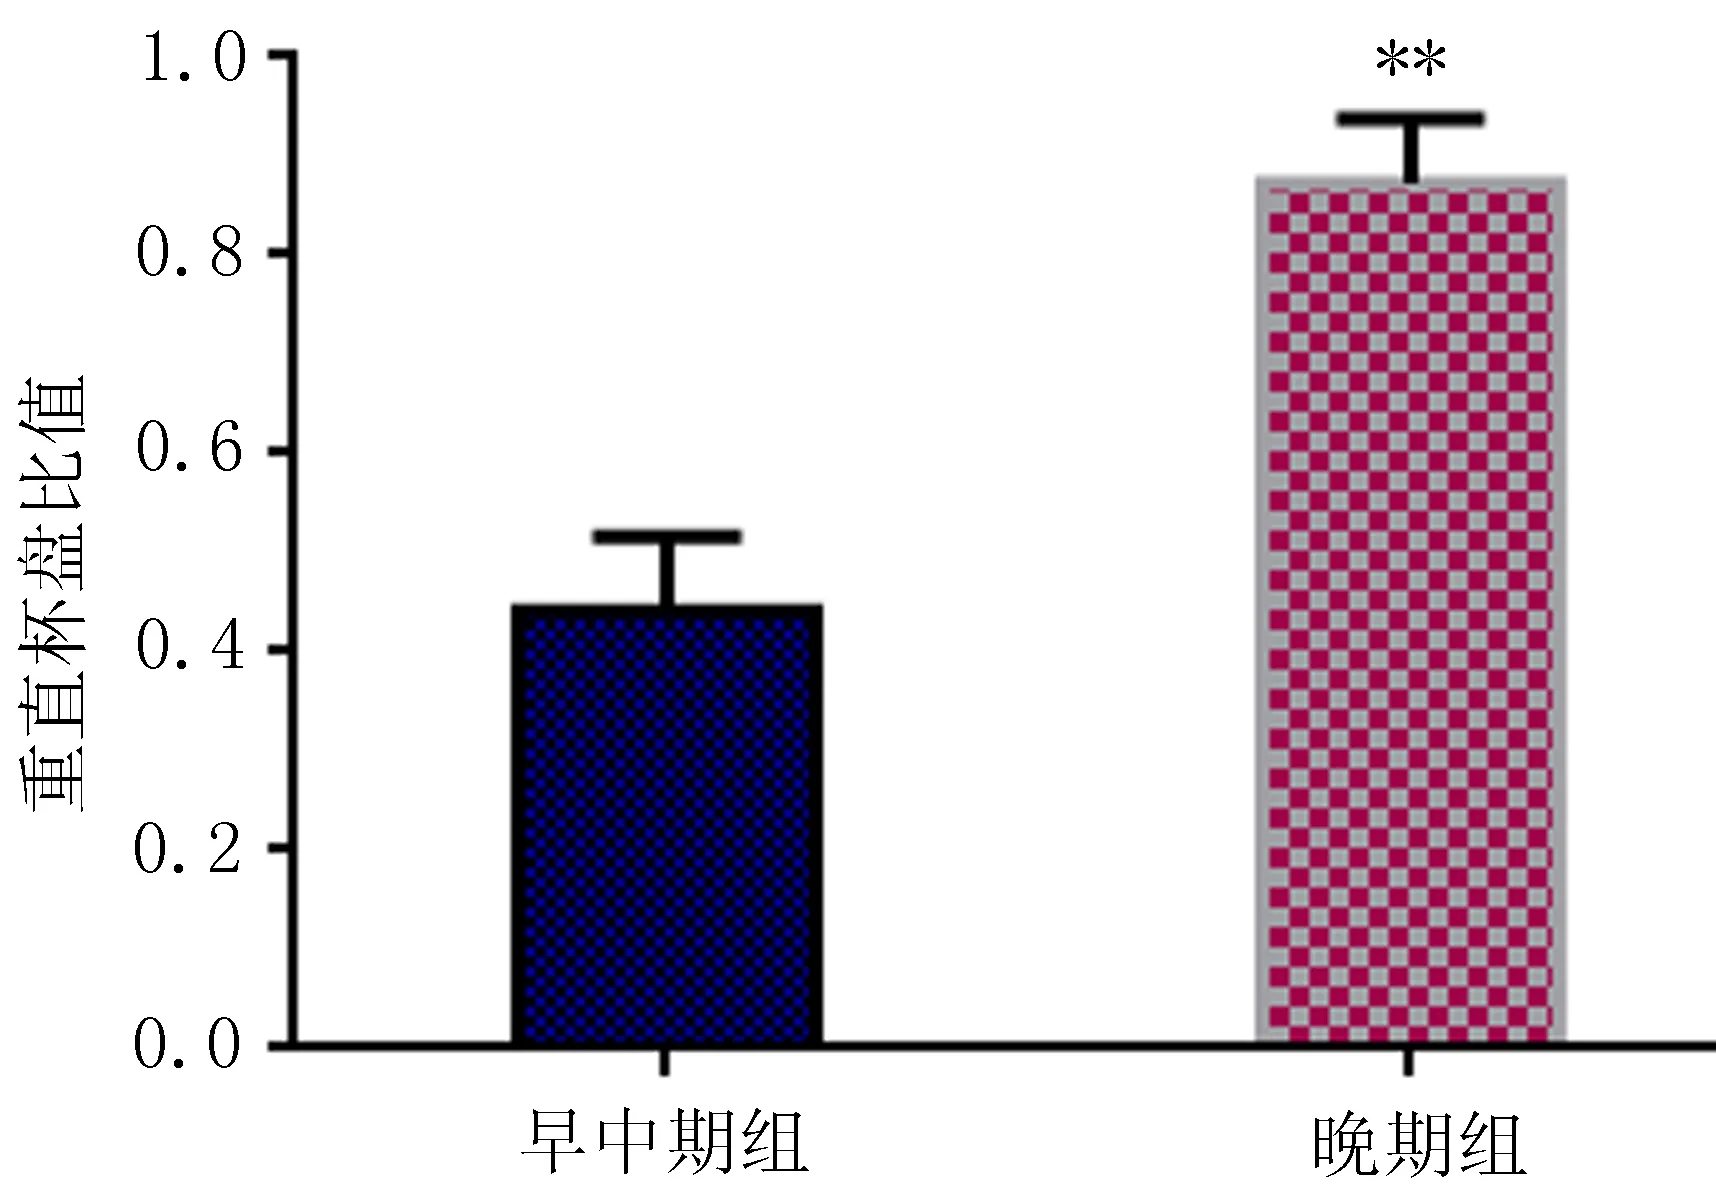
图5 两组垂直杯盘比值比较
2.2 两组RNFL厚度及视野缺损值比较 早中期组患者平均RNFL厚度值、上方平均RNFL厚度值、下方平均RNFL厚度值均高于晚期组患者(P<0.05);早中期组患者全视野的视野平均缺损值(MD)值、上方半侧视野MD值、下方半侧视野MD值均低于晚期组患者(P<0.05),见表1。

表1 两组患者RNFL厚度值与视野缺损值比较
注: 与早中期组比较,*P<0.05。
2.3 RNFL厚度和视野缺损的相关性分析 早中期组患者平均RNFL厚度与全视野MD值呈负相关(r=-0.448,P<0.05),见图6;早中期组患者上方平均RNFL厚度与上方半侧视野MD值呈负相关(r=-0.581,P<0.05),见图7;早中期组患者下方平均RNFL厚度与下方半侧视野MD值呈负相关(r=-0.634,P<0.05),见图8。晚期组患者平均RNFL厚度与全视野MD值无相关性,晚期组患者上方平均RNFL厚度与上方半侧视野MD值、下方平均RNFL厚度与下方半侧视野MD值无相关。
3 讨论
青光眼损害一个比较明显的特征是神经纤维层变薄,此项特征的发生早于视野及视乳头损害[6-8]。人体视网膜的光敏感度一旦减少5 dB时,则有一部分视网膜神经节细胞会发生死亡[9-10]。所以,与视野检测比较,检测RNFL厚度变化能够更早地发现青光眼组织的病理变化。OCT 是近年来新兴起来的一种光学成像技术,具有无创、非侵入性、分辨率高、成像速度快、不受屈光不正等影响的特点[11-13],可以定量分析RNFL 厚度变化及缺损,进而在临床诊断青光眼中日益受到人们的青睐。
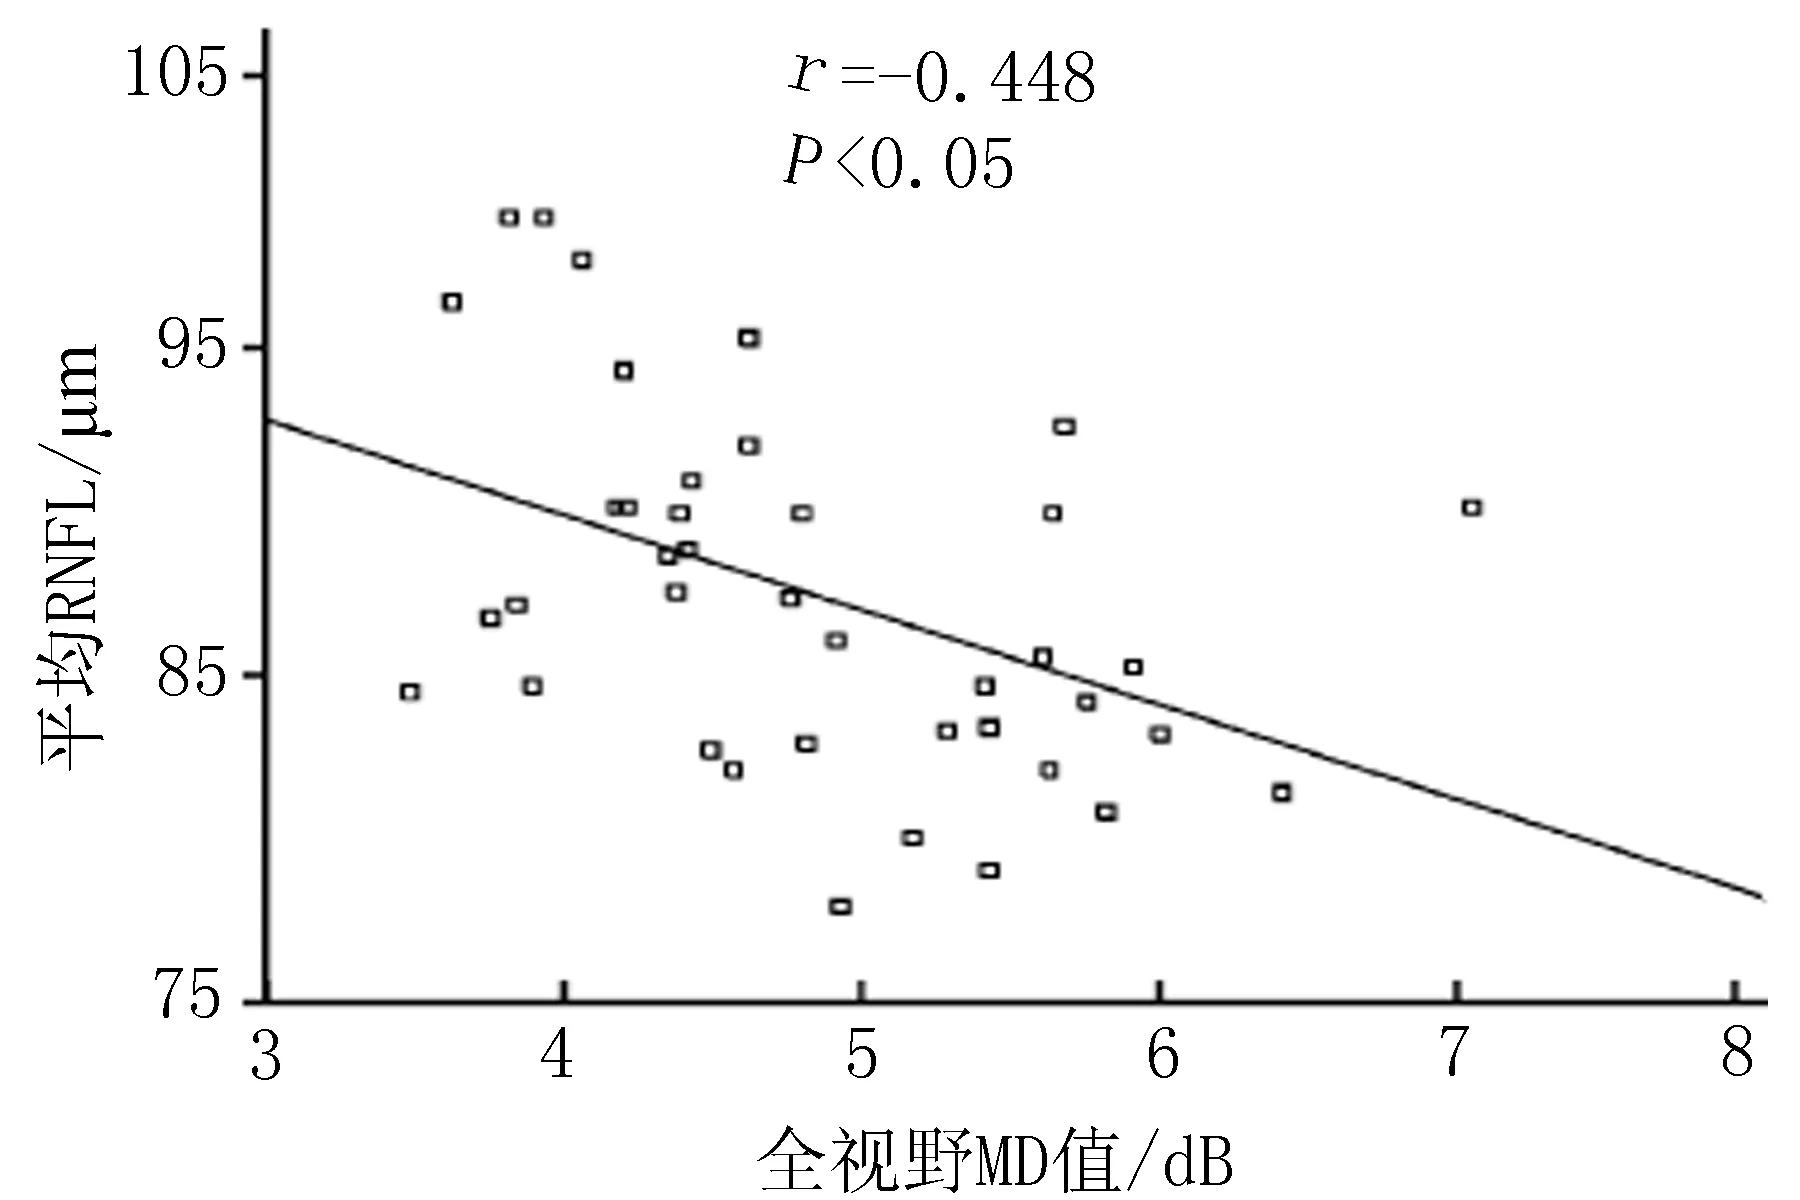
图6 早中期组患者平均 RNFL 厚度与全视野MD值相关性
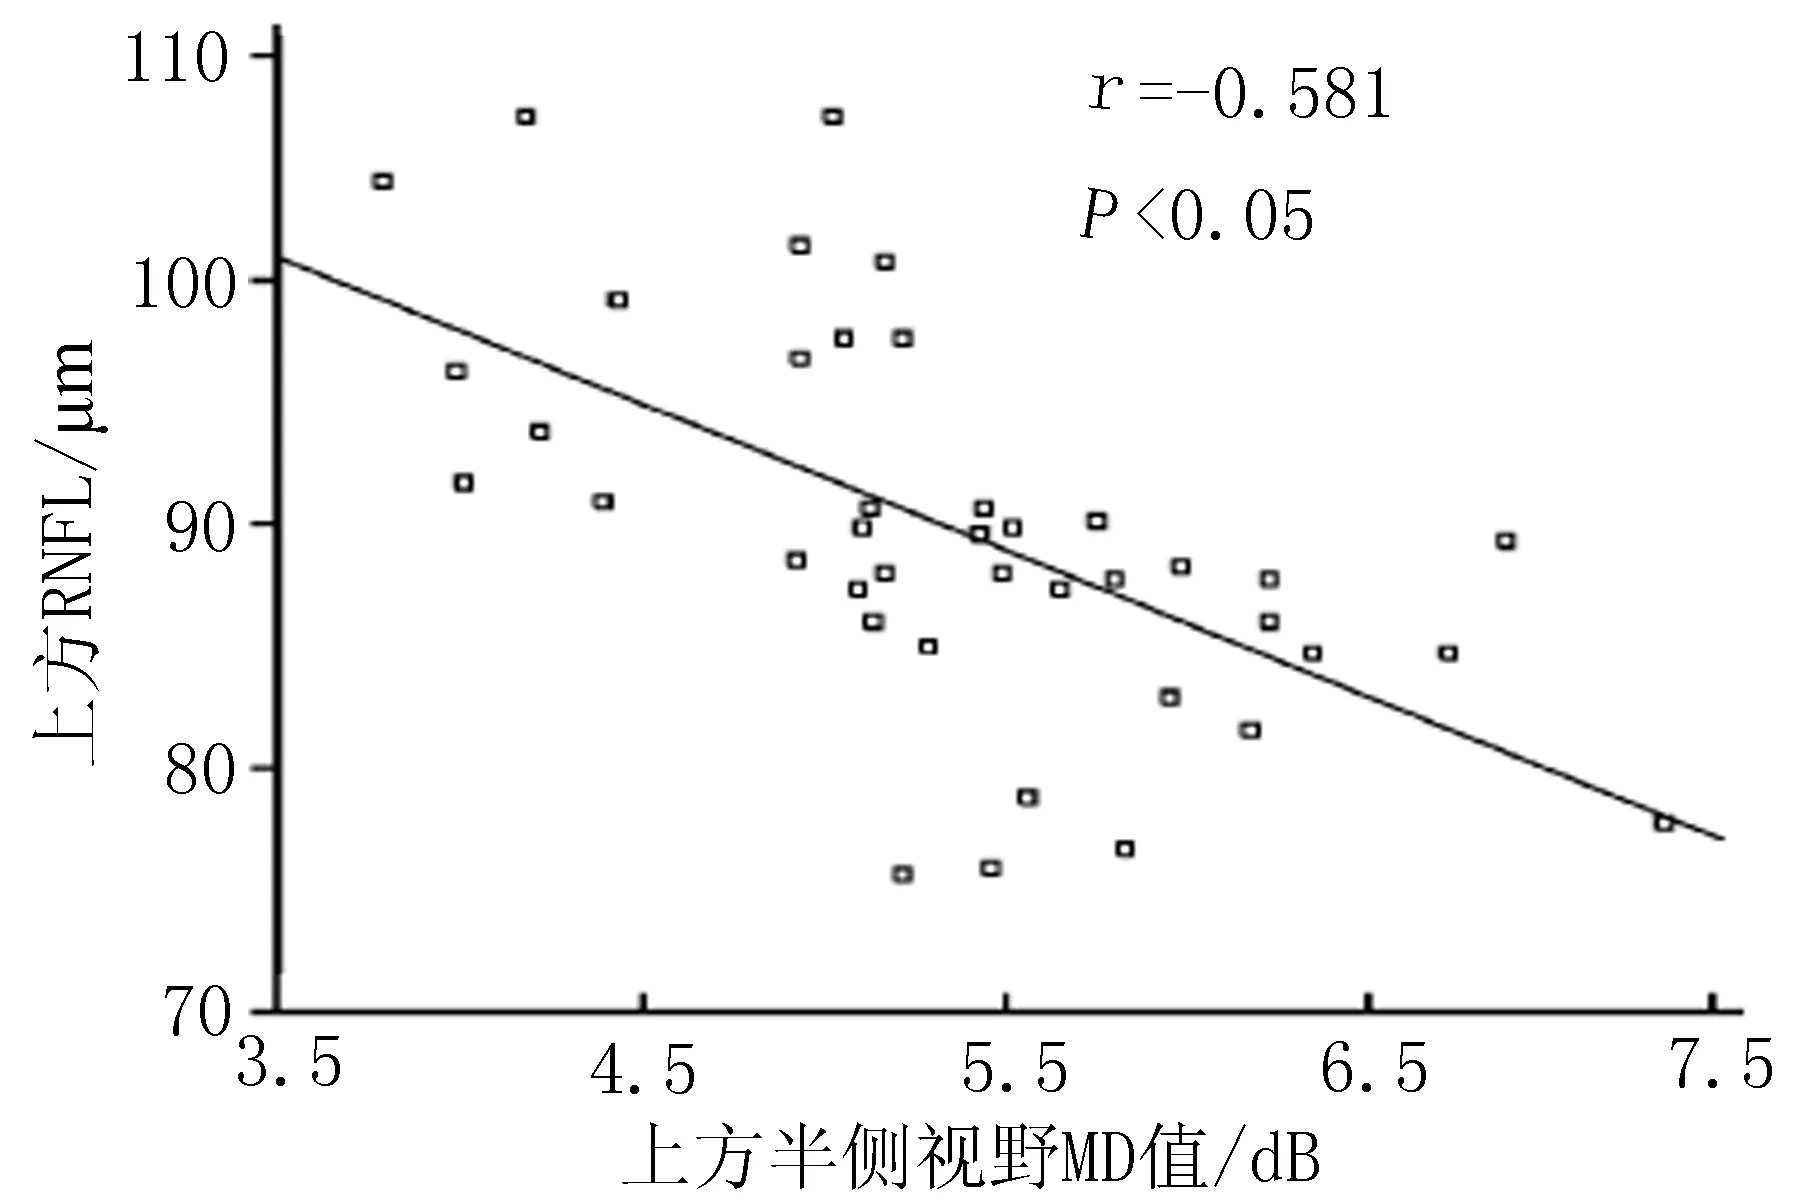
图7 早中期组患者上方RNFL厚度与上方半侧视野MD值相关性

图8 早中期组患者下方RNFL厚度与下方半侧视野MD值相关性
本研究发现,早中期组患者的平均IOP低于晚期组患者的平均IOP;早中期组患者垂直杯盘比值低于晚期组患者的垂直杯盘比值,这与国外学者Kim等[14]的研究观点一致。本研究对早中期及晚期青光眼患者的RNFL 厚度变化进行了比较分析,研究结果显示,早中期组患者平均 RNFL 厚度值、上方平均 RNFL 厚度值、下方平均 RNFL 厚度值均高于晚期组患者(P<0.05)。说明随着青光眼患者的病情的加重,其RNFL 厚度会逐渐变薄[15-16]。
对于青光眼患者而言,眼视功能发生变化的起初表现为视野改变。MD 是视野损害的一种量化指标,可反映出视野损害的程度,一般视野损害程度越大,则MD 值越大[17-19]。本研究显示,早中期组患者全视野MD值、上方半侧视野MD值、下方半侧视野MD值均低于晚期组患者(P<0.05)。可见,随着青光眼病情的加重,MD 值增大。本研究结果提示,假如不能有效控制青光眼患者的病情,视野 MD 值则会逐渐加大,患者眼压一直处于比较高的状态,并使得RNFL厚度会持续被损害,致使加重视野缺损,这和国外Mi等[ 20]的研究也是一致的。
Chen等[21]通过OCT检测早期原发性开角型青光眼患者发现,患者RNFL厚度和MD值呈明显的相关性。本研究显示,早中期组患者平均RNFL厚度与全视野MD值、上方半侧视 MD值、下方半侧视野MD值均呈负相关(P<0.05),本研究观点也与上述学者的观点一致。说明早中期青光眼患者随视神经病变程度的加重,其视野损害也逐渐变得更加严重。
本研究进一步分析发现,晚期组患者平均 RNFL 厚度与全视野MD值无相关性,晚期组患者上方平均 RNFL 厚度与上方半侧视野MD值无相关性,晚期组患者下方平均RNFL厚度与下方半侧视野 MD 值无相关性。研究提示,青光眼病情进入晚期,患者的视神经改变与视野损害的进展步调不一致,即便在绝对期视力功能完全丧失,视神经结构有可能没有完全损害,其视力也有可能可以恢复[22-23]。
综上所述,晚期青光眼患者相对早中期患者RNFL更薄,但是视野损伤程度更严重;早中期患者 的RNFL 厚度和视野缺损具有负相关性, 而晚期患者的RNFL 厚度和视野缺损的相关性不是很明显。本研究结果可为临床早诊断及早治疗青光眼提供有价值的参考依据。
[1] Geng W,Qiu KL, Xie HL, et al. The effect of myopia on retinal nerve fibre layer measurement: a comparative study of spectral-domain optical coherence tomography and scanning laser polarimetry[J]. British Journal of Ophthalmology, 2011,95(2):255-260.
[2] Horn FK, Mardin CY, Laemmer R,et al. Correlation between local glaucomatous visual field defects and loss of nerve fiber layer thickness measured with polarimetry and spectral domainoct[J]. Investigative Ophthalmology & Visual Science, 2009,50(5):1971-1977.
[3] Xu JL,Fan L,Wen LM.Retinal nerve fibre layer thickness and macular thickness in patients with esotropic amblyopia[J]. Clinical & Experimental Optometry,2013, 96(3): 267-271.
[4] Yoon SW, Park WH, Baek SH,et al. Thicknesses of macular retinal layer and peripapillary retinal nerve fiber layer in patients with hyperopic anisometropic amblyopia[J]. Korean Journal of Ophthalmology,2005, 19(1):62-67.
[6] Fjeldstad C,Bemben M,Pardo G. Reduced retinal nerve fiber layer and macular thickness in patients with multiple sclerosis with no history of optic neuritis identified by the use of spectral domain high-definition optical coherence tomography[J]. Journal of Clinical Neuroscience Official Journal of the Neurosurgical Society of Australasia, 2011,18(11):1469-1472.
[7] Wangsupadilok B,Orapiriyakul L.Correlation between central corneal thickness and visual field defect, cup to disc ratio and retinal nerve fiber layer thickness in primary open-angle glaucoma patients[J]. Journal of the Medical Association of Thailand Chotmaihet Thangphaet, 2014,97(7):751-757.
[8] Hwang JH, Kim JS, Lee JH. Correlation between central corneal thickness and retinal nerve fiber layer thickness in normal tension glaucoma[J]. Journal of the Korean Ophthalmological Society, 2010,51(1):63-69.
[9] Tenkumo K, Hirooka K,Baba T,et al. Evaluation of relationship between retinal nerve fiber layer thickness progression and visual field progression in patients with glaucoma[J]. Japanese Journal of Ophthalmology, 2013,57(5);451-456.
[10] Chang YC, Tsai RK. Correlation between quadrant specific automatic visual field defect and retinal nerve fiber layer thickness as measured by scanning laser polarimetry in patients with primary open angle glaucoma[J]. Kaohsiung Journal of Medical Sciences, 2008,24(5):233-239.
[11] Kang EM., Hong S, Kim CY, et al. Relationship between peripapillary retinal nerve fiber layer thickness measured by optical coherence tomography and visual field severity indices[J]. Korean Journal of Ophthalmology,2015, 29(4):263-269.
[12] Alpay A, Guney T, Unal A, et al. Comparison of retinal nerve fibre layer thickness with visual evoked potential and visual field in patients with multiple sclerosis[J]. Clinical & Experimental Ophthalmology, 2012,40(1):25-31.
[13] Ajtony C,Balla Z,Somoskeoy S,et al. Relationship between visual field sensitivity and retinal nerve fiber layer thickness as measured by optical coherence tomography[J]. Investigative Ophthalmology & Visual Science, 2007,48(1):258-263.
[14] Kim TW,Zangwill LM,Bowd C,et al. Retinal nerve fiber layer damage as assessed by optical coherence tomography in eyes with a visual field defect detectedby frequency doubling technology perimetry but not by standard automated perimetry[J]. Ophthalmology, 2007,114(6):1053-1057.
[15] Grewal DS, Sehi M,Paauw JD,et al. Detection of progressive retinal nerve fiber layer thickness loss with optical coerence tomography using 4 criteria for functional progression[J]. Journal of Glaucoma, 2012,21(4):214-220.
[16] Yang Z,Tatham AJ,Zangwill LM.,et al. Diagnostic ability of retinal nerve fiber layer imaging byswept-source optical coherence tomography inglaucoma[J]. American Journal of Ophthalmology, 2015,159(1):193-201.
[17] Wang XL,Yu T,Xia DZ,et al. Measurement of retinal nerve fiber layer thickness in optic atrophy eyes of patients with optic neuritis using optical coherence tomography[J]. Albrecht Von Graes Archiv Für Ophthalmologie, 2010,248(7):1013-1018.
[18] Choi JA,Park HY,Jung KI,et al. Difference in the properties of retinal nerve fiber layer defect between superior and inferior visual field loss in glaucoma[J]. Investigative Ophthalmology & Visual Science, 2013,54(10):6982-6990.
[19] Pérez AL,Soto AO,Rahhal MS,et al. Relationship between visual field sensitivity and retinal nerve fiber layer thickness measured by scanning laser polarimetry and optical coherence tomography in normal, ocular hypertensive and glaucomatous eyes[J]. Journal of Optometry,2009,2(1):39-50.
[20] Mi JK, Park KH, Yoo BW, et al. Comparison of macular GCIPL and peripapillary RNFL deviation maps for detection of glaucomatous eye with localized RNFL defect[J]. Acta Ophthalmologica, 2015, 93(1):22-28.
[21] Chen HY, Wang TH, Lee YM, et al. Retinal nerve fiber layer thickness measured by optical coherence tomography and its correlation with visual field defects in early glaucoma[J]. Journal of the Formosan Medical Association, 2005, 104(12):927-934.
[22] Yu M,Lin C,Weinreb RN,Let al. Risk of visual field progression in glaucoma patients with progressive retinal nerve fiber layer thinning: a 5-year prospective study[J]. Ophthalmology, 2016,123(6):1201-1210.
[23] Gupta P, Cheung CY, Baskaran M, et al. Relationship between peripapillary choroid and retinal nerve fiber layer thickness in a population-based sample of nonglaucomatous eyes[J]. American Journal of Ophthalmology, 2016,161(1):4-11.
(本文编辑 张巧莲)
The correlation between retinal nerve fiber layer thickness and visual field defects in late primary open angle glaucoma
QIAN Yi, YI Xianglong
(DepartmentofOphthalmology,theFirstAffiliatedHospitalofXinjiangMedicalUniversity,Urumqi830054,China)
Objective To study the changes of retinal nerve fiber layer (RNFL) thickness of late primary open angle glaucoma (POAG) by optical coherence tomography (OCT), and to explore the correlation between the RNFL thickness and the visual field defect. Methods A total of 90 cases (90 eyes) with POAG in our hospital from April 2014 to 2015 December were chosen, in which 40 cases (40 eyes) with early and middle POAG went into early and middle groups and 50 cases (50 eyes) with late POAG went into late group. RNFL thickness of two groups was measured by OCT,and the visual field defect was examined by computer visual field analyzer. Results In the early and middle group, the mean intraocular pressure (IOP) was (30.284±2.452) mmHg, which was lower than that in the late group (34.453±3.568 mmHg, P<0.05). Vertical cup to disc ratio in the early and middle group was (0.441±0.076), which was lower than that in the late group (0.873±0.065, P<0.05). RNFL thickness value, above average RNFL thickness value and below average RNFL thickness value in the early and middle group were higher than the patients in the late group (P<0.05); full field MD, above the half side of the MD value and below half side of the MD value in the early and middle group were lower than that in the late group (P<0.05). RNFL thickness and full field MD value, above the half side of the MD values and beneath the half side of the MD value in the early and middle group all showed negative correlations (r=-0.448, r=-0.581, r=-0.63, and all P<0.05); the mean RNFL thickness and full field MD, above the half side of the MD values and beneath the half side of the MD value in the late group had no correlation. Conclusion OCT scanning can reflect the changes of RNFL thickness of POAG patients. For early and middle stage glaucoma patients, RNFL thickness was negative correlated with visual field defect. The correlation between RNFL thickness and visual field defect in patients with late stage was not very obvious.
Late primary open angle glaucoma; Optical coherence tomography; Retinal nerve fiber layer thickness; Visual field defect
国家自然科学基金(81260150,81560161)
钱 一(1960),本科,副主任技师,研究方向:眼底疾病的诊断及检查,E-mail:2362978928@qq.com。
易湘龙,男,博士,主任医师,副教授,硕士生导师,研究方向:屈光不正的手术矫正,眼底病,角膜移植,E-mail: xly1010@sina.com。
R77
A
1009-5551(2016)12-1507-05
10.3969/j.issn.1009-5551.2016.12.006
2016-08-10]
