Change of Tropical Cyclone Heat Potential in Response to Global Warming
2016-11-24RanLIUChanglinCHENandGuihuaWANGStateKeyLaboratoryofSatelliteOceanEnvironmentDynamicsSecondInstituteofOceanographyStateOceanicAdministrationHangzhou310012
Ran LIU,Changlin CHEN,and Guihua WANGState Key Laboratory of Satellite Ocean Environment Dynamics,Second Institute of Oceanography, State Oceanic Administration,Hangzhou 310012
Change of Tropical Cyclone Heat Potential in Response to Global Warming
Ran LIU,Changlin CHEN∗,and Guihua WANG
State Key Laboratory of Satellite Ocean Environment Dynamics,Second Institute of Oceanography, State Oceanic Administration,Hangzhou 310012
Tropical cyclone heat potential(TCHP)in the ocean can affect tropical cyclone intensityand intensif cation.In this paper, TCHP change under global warming is presented based on 35 models from CMIP5(Coupled Model Intercomparison Project, Phase 5).As the upper ocean warms up,the TCHP of the global ocean is projected to increase by 140.6%in the 21st century under the RCP4.5(+4.5 W m−2Representative Concentration Pathway)scenario.The increase is particularly signif cant in the western Pacif c,northwestern Indian and western tropical Atlantic oceans.The increase of TCHP results from the ocean temperature warming above the depth of the 26◦C isotherm(D26),the deepening of D26,and the horizontal area expansion of SST above 26◦C.Their contributions are 69.4%,22.5%and 8.1%,respectively.Further,a suite of numerical experiments with an Ocean General Circulation Model(OGCM)is conducted to investigate the relative importance of wind stress and buoyancy forcing to the TCHP change under global warming.Results show that sea surface warming is the dominant forcing for the TCHP change,while wind stress and sea surface salinity change are secondary.
tropical cyclone heat potential,global warming,CMIP5,OGCM
1.Introduction
The upper ocean sustains tropical cyclone(TC)development by providing a considerable amount of heat and mitigating the sea surface cooling induced by the TC through upwelling and turbulent mixing(Gray,1979;Mei et al.,2015). Tropical cyclone heat potential(TCHP)(Leipper and Volgenau,1972)is a measure of the ocean heat content from the surface down to the depth of the 26◦C isotherm(hereafter, D26).Manystudies havereportedthat theTCHP in theocean can affect TC intensity and intensif cation(e.g.,Wada and Usui,2007;Wada and Chan,2008;Goni et al.,2009).The larger the TCHP,the more favorable the ocean conditions are for TC intensif cation(Shay et al.,2000;Lin et al.,2008; Goni et al.,2009;Wada et al.,2012).
The upper ocean heat content has been shown to have increased in recent decades(Palmer et al.,2007;Domingues et al.,2008;Ishii and Kimoto,2009;Levitus et al.,2012).Levitus et al.(2012)reported that the heat content of the global ocean for the 0-700 m layer increased by 16.7±1.6×10²²J during 1955-2010.Consistently,using satellite measurements,Pun et al.(2013)found the TCHP has increased by 10.0%due to the increase in D26 duringthe past two decades inthe westernNorthPacif c Ocean.Ina warmingclimate,the upper ocean could take up half of the heat from the surface to 700 m by the end of the 21st century(Collins et al.,2013). Thus,we expect an increase in TCHP in a warming climate. The structure of the TCHP change,and what determines that change,however,remains unknown.
In this study,the TCHP change under global warming is analyzed based on 35 models from CMIP5(Coupled Model Intercomparison Project,Phase 5).Then,a suite of numerical experiments with an OGCM is conducted to investigate the relative importance of wind stress and buoyancy forcing for the TCHP change under global warming.
2.Data and method
2.1.CMIP5 model outputs
Themodeloutputsusedinthis studyarefromtheCMIP5. CMIP5 offers a multi-modelperspectiveof simulatedclimate variability and change(Taylor et al.,2012).Historical and RCP4.5(+4.5 W m−2Representative Concentration Pathway)simulations are used to describe the present-dayclimate and warmer climate,respectively.
Climate change is represented by the difference in the climatological mean between the last 25 years of the 21st century(2076-2100;hereafter,RCP)and the last 25 years of the 20th century(1976-2000;hereafter,HIS).The calculation is similar to that used in previousstudies(e.g.,Sobel and Camargo,2011).A total of35 CMIP5 modelsare used in this study(Table 1).Only one member run(“rlilp1”)is selectedfor each model.We use all 35 models to calculate the multimodel average of each physical parameter.Each model is re-gridded to a common grid before the multi-model average is calculated.The common grid has a uniform 0.5◦×0.5◦resolution horizontally,and 50 levels vertically.
©Institute of Atmospheric Physics/Chinese Academy of Sciences,and Science Press and Springer-Verlag Berlin Heidelberg 2016
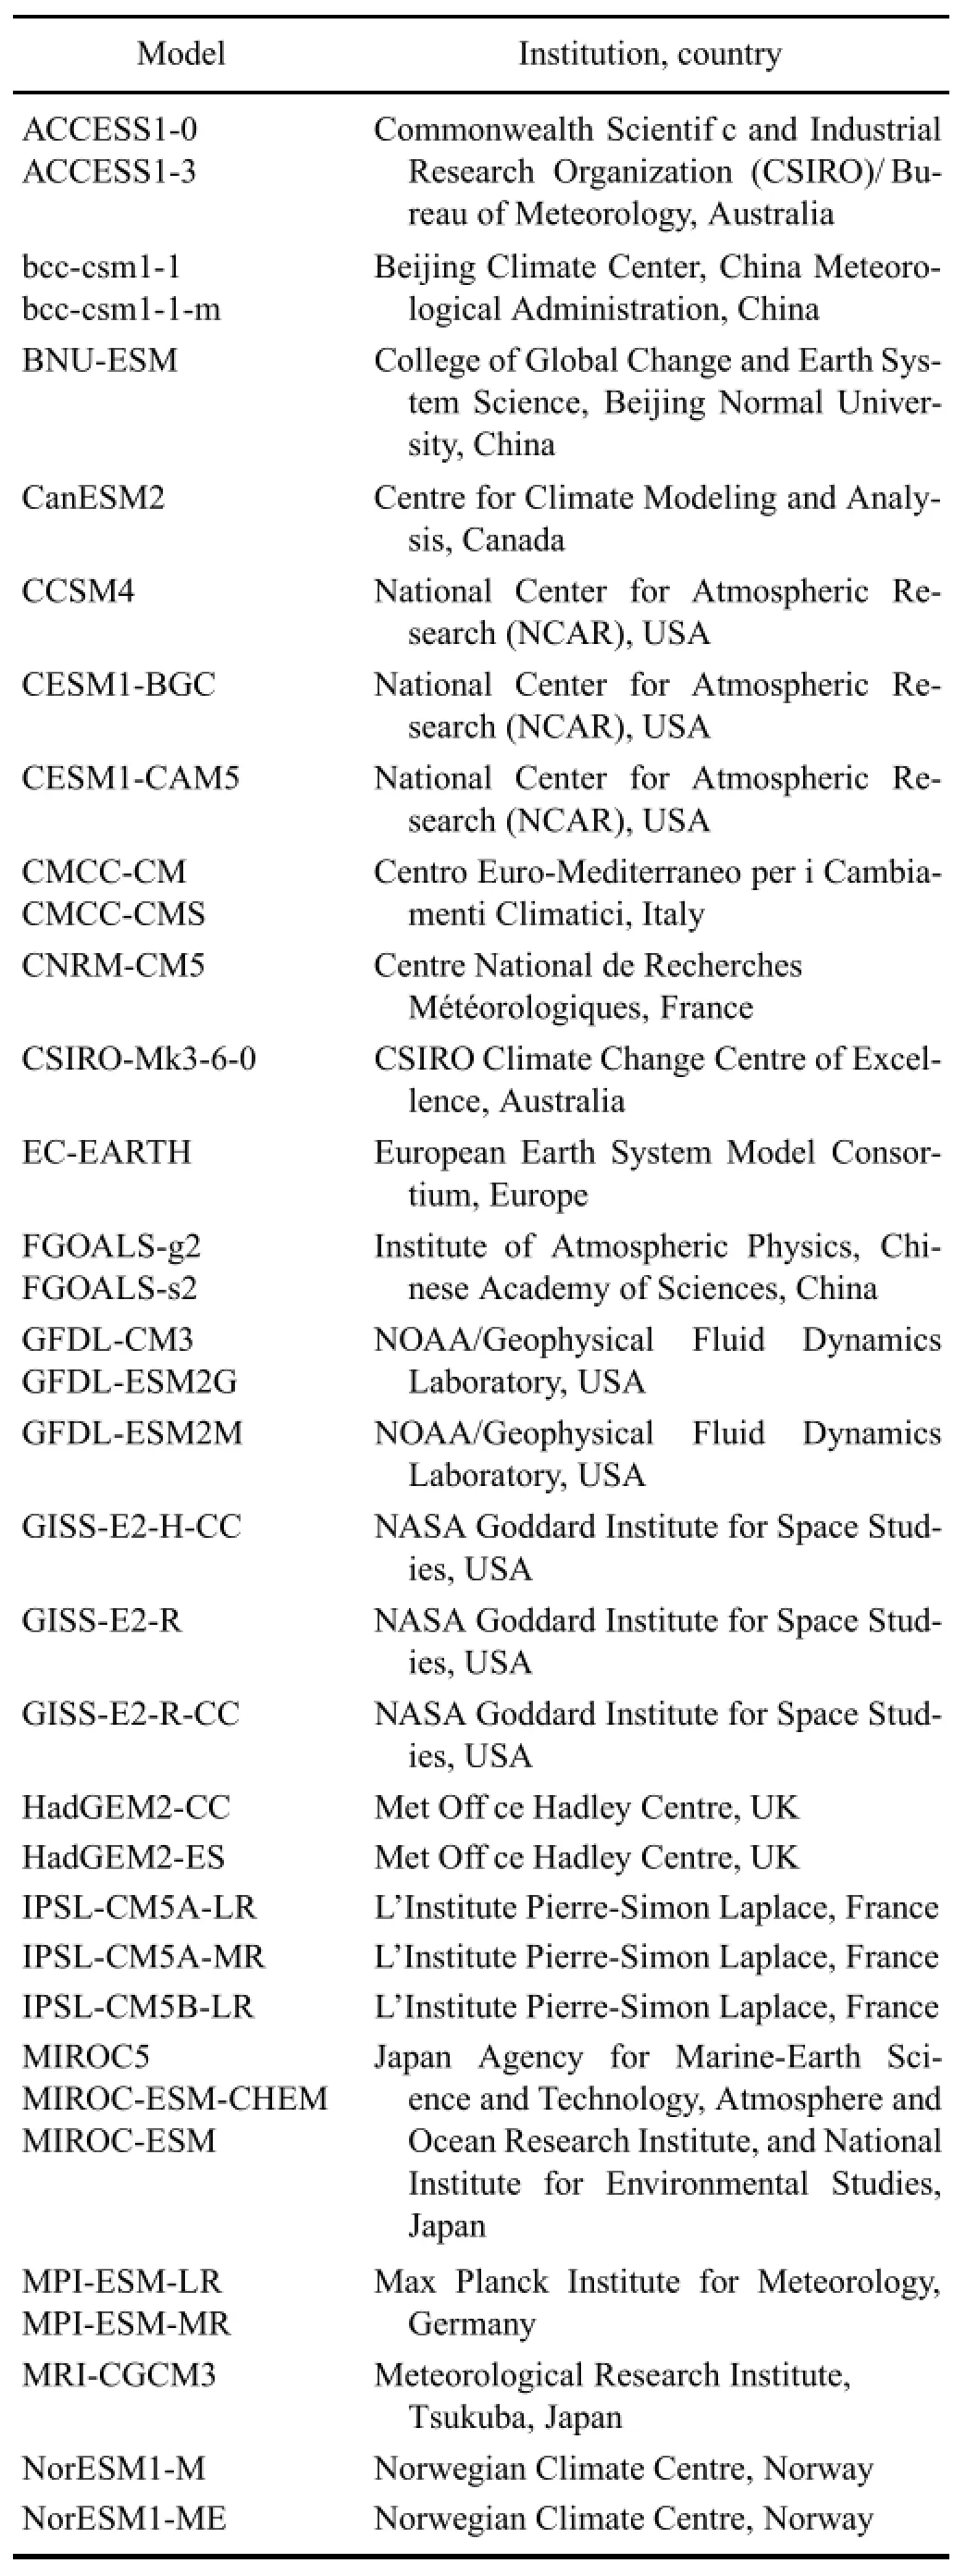
Table 1.The 35 CMIP5 models used in this study.
2.2.OGCM
The OGCM is the OPA(Oc´ean Parall´elis´e)component of the NEMO(Nucleus for European Modeling of the Ocean)modelingframework(Madec,2008).It is a dynamicthermodynamicmodel specif cally designed for climate studies,with a global 1◦resolution and a tropical ref nement to 1/3◦.The model has 46 levels in the vertical direction,with the layer thickness ranging from 6 m at the surface to 250 m at the bottom.The model integration time step is 1 h.
To reach the quasi-equilibrium state,the model is f rst integrated for 100 years using the forcing of climatological monthly CORE2(Coordinated Ocean-ice Reference Experiments,version 2)data(Large and Yeager,2009).Then, the monthly wind stress,SST,and sea surface salinity(SSS) f elds from 1976to 2100,fromthe CMIP 35-modelensemble mean,are used to drive the ocean model.The SST and SSS are strongly restored toward the CMIP5 f elds,with a relaxation time scale of 20 days(for a 50 m layer).Five experiments are conducted in the study(Table 2).The average of the last 25 years of each experiment is used for analysis.The differences between the four sensitivity experiments and the control experiment are used to represent the TCHP change forced by(1)the combined effects of wind stress,SST and SSS change,(2)the effect of wind stress change,(3)the effect of SST change,and(4)the effect of SSS change,respectively.
2.3.Method
In this study,TCHP is def ned as follows,as in Leipper and Volgenau(1972):

whereρhis the potential density of the sea water in each layer,cpis the specif c heat capacity at constant pressure,This the ocean temperature in each layer,∆Zhis the thickness of each layer,H is D26,and h is the number of a particular verticallayer.WhenThis below26◦C,the TCHP in that layer is assumed to be zero.
3.Results
3.1.Projected changes of TCHP in CMIP5
Figure1ashowstheclimatologicaldistribution(contours) of the TCHP in the WOA13(World Ocean Atlas,2013) dataset(Locarnini et al.,2013).The TCHP is high in the Indo-Pacif c warm pool area,with the maximum in the tropical central Pacif c Ocean.The TCHP in the tropical Atlantic Ocean is smaller than that in the tropical Pacif c Ocean.Figure 1b shows the climatological distribution of the TCHP inHIS of CMIP5(contours).Generally,the TCHP distribution from CMIP5(Fig.1b)is similar to the observation(Fig. 1a),althoughtheirdifferencesaresignif cantinsomeregions. Their spatial correlation reaches 0.88.The TCHP magnitude in CMIP5 is smaller than that in WOA13 in most regions (Fig.1a,shading),especially in the areas where the climatological TCHP is large,e.g.,the Indo-Pacif c warm pool area and the western tropical Atlantic Ocean.Smaller TCHP in CMIP5 is also found in the Northwest Pacif c Ocean around 15◦N.Globally,the TCHP in CMIP5 underestimates the observed TCHP by 9.8%.This underestimation may be partially due to the cold SST bias in the tropical ocean in CMIP5 (Wang et al.,2014).

Table 2.Forcing set for the NEMO-OPA experiments.An overbar means the monthly climatology from CMIP5 historical experiments (1976-2000),and a prime means the change of each variable in each year from 1976 to 2100 with respect to the mean of 1976-2000.
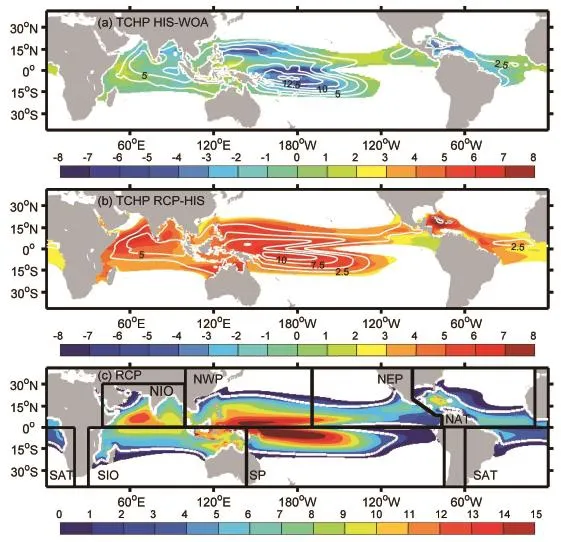
Fig.1.(a)The TCHP(units:108J m−2)in WOA13 data(white contours)and the difference in TCHP between the ensemble mean of the CMIP5 HIS simulation and WOA13(color shading).(b)The TCHP in the HIS simulation(white contours)and the change in TCHP(color shading).(c)The TCHP in RCP (color shading),and the white contour lines of SST for 26◦C in the HIS simulation.Basin classif cation is represented by black boxes.The seven ocean basins are:the North Indian Ocean(NIO);Northwest Pacif c(NWP);Northeast Pacif c(NEP);North Atlantic(NAT);South Atlantic(SAT);South Indian Ocean(SIO);South Pacif c(SP).
The high correlation between the historical experiments and observations suggests that the ensemble mean of the CMIP5 models can be a useful dataset for the projection ofTCHP under climate change.Figure 1b shows the TCHP change in CMIP5 between the RCP and HIS simulations (shading).As the upperoceanwarms up,the TCHP increases globally.The increase is particularly signif cant in the western Pacif c,northwestern Indian,and western tropical Atlantic oceans.Globally,the TCHP increases by 129.4%.The changemagnitudevaries with ocean basin.The magnitudeof increase for the North Atlantic and South Atlantic oceans can reach 312.9%and 287.1%,respectively.The South Pacif c Ocean has the smallest magnitude of increase,at 104.4%. The magnitudes of TCHP change in the rest of the basins areas follows:NortheastPacif c(163.3%);NorthwestPacif c (108%);North Indian Ocean(136.1%);South Indian Ocean (122.1%).Figure 1c shows the TCHP in RCP.As the SST warms up,the 26◦C SST contour line extends a few degrees poleward.The horizontal area of SST above 26◦C increases by30.7%in RCP with respecttoHIS.Addingtheareaexpansion part,the TCHP of the global ocean increases by 140.6% in RCP with respect to HIS.
To better understand the TCHP change under global warming,we decompose it into three parts(Fig.2)as follows:

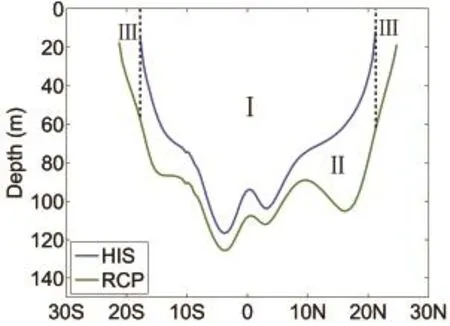
Fig.2.D26 distributions(units:m)along 160◦E in the HIS and RCP simulations.The numerals I-III indicate the three parts of TCHP change:the ocean temperature warming above D26, the deepening of D26,and the horizontal area expansion of SST above 26◦C.
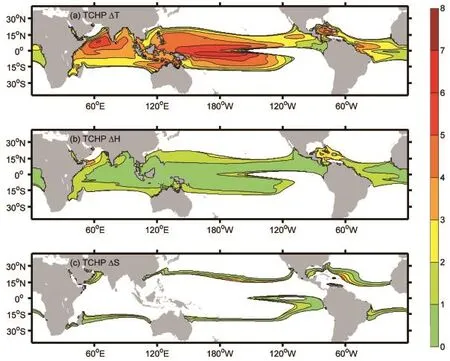
Fig.3.TCHPchange(units:108Jm−2)due to(a)theocean temperature warmingabove D26,(b)thedeepening of D26,and(c)the horizontal area expansion of SST above 26◦C.
The three parts describe the TCHP change due to temperature change above D26(term I),the D26 deepening(term II),and the horizontal area change(term III).Figure 3 shows the three parts of the TCHP change.The TCHP increases signif cantly due to the ocean warming above D26(Fig.3a). The spatial pattern is very similar to the total TCHP change (Fig.1b),characterized by a signif cant increase in the western Pacif c,northwestern Indian,and western tropical At-lantic oceans.On average,this part of the TCHP change accounts for 69.4%of the total TCHP change,suggesting ocean warming above D26 is the most important part in total TCHP change.The warmingof ocean temperaturealso deepens D26,and enlarges the horizontal area of SST above 26◦C (Figs.3b and c).The TCHP changes due to the deepening of D26 and due to the area expansion account for 22.5%and 8.1%of the total TCHP change,respectively.
Although the ensemble mean provides some useful information on TCHP change,it is necessary to examine the TCHP change in individual models.Figure 4 shows the globaltotalTCHPandits changesbasedontheresultsofboth individual models and their ensemble mean.The ensemblemean TCHP is close to the observation,although the former is relatively smaller than the latter(also shown in Fig.1a). For individual models,the TCHP ranges from 1.30×10²²J (EC-EARTH)to 5.89×10²²J(CESM1-BGC).As the global ocean warms up,the TCHP is projected to increase in all models.Generally,the TCHP change is proportional to the total TCHP,with a linear f t slope of 0.4.We also calculated the TCHP and its change in individual ocean basins for these models.All ocean basins demonstrate similar features(not shown).
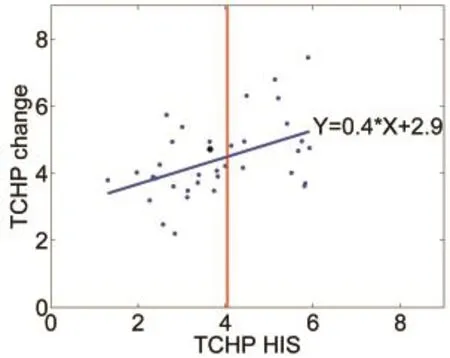
Fig.4.Scatterplot betweentheglobaltotalTCHP(units:1022J) and its change for the 35 CMIP5 models.The ensemble mean is plotted as a black dot.The red line indicates the total TCHP in WOA13.The blue line is the linear f t.
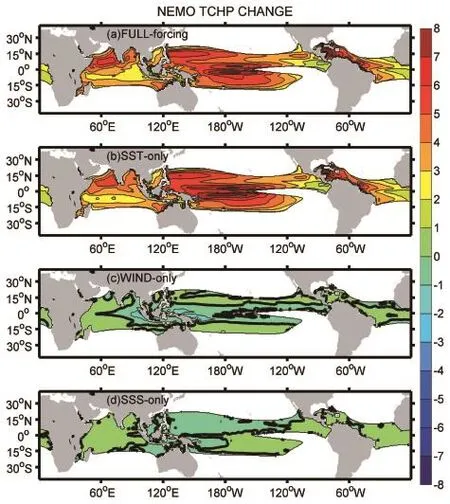
Fig.5.Changes of TCHP(units:108J m−2)in different OGCM experiments forced by(a)wind stress,SST and SSS change;(b)SST change only;(c)wind stress change only;and(d)SSS change only.
3.2.Forcing mechanisms
Here,we use an OGCM to test the impact of wind stress, SST andSSS onTCHP changeunderglobalwarming.Figure 5a shows the spatial pattern of TCHP change in the FULL-forcing experiment.The pattern is quite similar to the ensemble mean of CMIP5(Fig.1b).They both show that the TCHP increases in all regions,but with larger magnitudes in the western Pacif c,northwestern Indian,and western tropical Atlantic oceans.Generally,the OGCM captures the main features of the TCHP response to climate change in CMIP5. The OGCM experiment forced only by SST change(Fig.5b) also reproduces the results of the FULL-forcing experiment (Fig.5a).Their spatial correlation reaches 0.95,with almost the same magnitude.Compared to the SST-only experiment, the TCHP changes in the WIND-only and SSS-only experiments are weak(Figs.5c and d).The TCHP change in the four sensitivity experiments are 4.15×10²²J,4.24×1022J,−5.99×10²⁰J,and 2.47×10¹⁹J,respectively.These experiments highlight the dominant role of SST forcing in the TCHP response to global warming.
4.Summary and discussion
The TCHP change under future global warming was investigated based on 35 CMIP5 models.As the upper ocean warms up,the TCHP increases globally.The increase is particularly signif cant in the western Pacif c,northwestern Indian,and western tropical Atlantic oceans.The TCHP of the global ocean is projected to increase by 140.6%under the RCP4.5 scenario.Further analysis showed that the projected increase of TCHP mainly results from the ocean warming above D26,which accounts for 69.4%of the total change.
A suite of OGCM experiments was conducted to investigate the relative importance of wind stress and buoyancy forcing to the TCHP change under global warming.The experiments showed that SST forcing is dominant in the TCHP response to global warming.The effects of wind stress and SSS on TCHP change are secondary.
Although SST plays an important role in TC genesis,the ocean heat content,e.g.,TCHP,has been shown to play a more important role in TC intensity and intensif cation(Shay et al.,2000;Wada and Usui,2007;Goni et al.,2009).The projected increase of TCHP under global warming suggests the ocean may become more favorable for TC intensif cation, although it is still highly debated as to whether the accompanying changes in the ocean subsurface temperature prof le may partially oppose this effect(Knutson et al.,2013;Huang et al.,2015).Meanwhile,the long-term effect of increased TC intensity can in turn further strengthen the ocean warming by pumping heat into the ocean,possibly leading to positive feedback(Emanuel,2001;Sriver and Huber,2007;Mei, 2013).
Acknowledgements.This study was supported by the National Basic Research Program of China(Grant No.2012CB 955601),the National Natural Science Foundation of China(Grant Nos.41206021 and 41125019),and the Strategic Priority Research Program of the Chinese Academy of Sciences(Grant No.XDA11010103).The CMIP5 model outputs were obtained from the Program for Climate Model Diagnosis and Intercomparison(PCMDI)at the Lawrence Livermore National Laboratory (http://pcmdi9.llnl.gov).
REFERENCES
Collins,M.,and Coauthors,2013:Long-term climatechange:projections,commitments and irreversibility,1029-1136.Climate Change 2013:The Physical Science Basis.Contribution of Working Group I to the Fifth Assessment Report of the Intergovernmental Panel on Climate Change,T.F.Stocker,et al., Eds.,Cambridge University Press,Cambridge,United Kingdom and New York,NY,USA.
Domingues,C.M.,J.A.Church,N.J.White,P.J.Gleckler,S.E. Wijffels,P.M.Barker,and J.R.Dunn,2008:Improved estimates of upper-ocean warming and multi-decadal sea-level rise.Nature,453,1090-1093.
Emanuel,K.A.,2001:The contribution of tropical cyclones to meridional heat transport by the oceans.J.Geophys.Res., 106(D14),14 771-14 781.
Goni,G.,and Coauthors,2009:Applications of satellite-derived ocean measurements to tropical cyclone intensity forecasting. Oceanography,22,190-197.
Gray,W.M.,1979:Hurricanes:Their formation,structure,and likely role in the tropical circulation.Meteorology over the Tropical Oceans,D.B.Shaw,Eds.,James Glaisher House, 155-218.
Huang,P.,I.-I.Lin,C.Chou,and R.H.Huang,2015:Change in ocean subsurface environment tosuppress tropical cyclone intensif cation under global warming.Nature Communications, 6,7188,doi:10.1038/ncomms8188.
Ishii,M.,and M.Kimoto,2009:Reevaluation of historical ocean heat content variations with time-varying XBT and MBT depth bias corrections.Journal Oceanography,65,287-299.
Knutson,T.R.,and Coauthors,2013:Dynamical downscaling projections of twenty-f rst-century Atlantic hurricane activity:CMIP3 and CMIP5 model-based scenarios.J.Climate, 26,6591-6617.
Large,W.G.,and S.Yeager,2009:The global climatology of an interannually varying air-sea f ux data set.Climate Dyn.,33, 341-364,doi:10.1007/s00382-008-0441-3.
Leipper,D.F.,and L.D.Volgenau,1972:Hurricane heat potential of the Gulf of Mexico.J.Phys.Oceanogr.,2,218-224.
Levitus,S.,and Coauthors,2012:World ocean heat content and thermosteric sea level change(0-2000 m)1955-2010.Geophys.Res.Lett.,39,L10603.
Lin,I.-I.,C.-C.Wu,I.-F.Pun,and D.-S.Ko,2008:Upperocean thermal structure and the western North Pacif c category 5 typhoons.Part I:Ocean features and the category 5 typhoons'intensif cation.Mon.Wea.Rev.,136,3288-3306, doi:10.1175/2008MWR2277.1.
Locarnini,R.A.,and Coauthors,2013:World Ocean Atlas 2013, Vol.1:Temperature.S.Levitus,Ed.,A.Mishonov Technical Ed.;NOAA Atlas NESDIS 73,40 pp.
Madec,G.,2008:NEMO ocean engine.Note du Pˆole de mod´elisation,Institut Pierre-Simon Laplace(IPSL),France, No 27,ISSN No 1288-1619.
Mei,W.,F.Primeau,J.C.McWillams,and C.Pasquero,2013: Sea surface height evidence for long-term warming effects of tropical cyclones on the ocean.Proceedings of the National Academy of Sciences of the United States of America, 110(38),15 207-15 210.
Mei,W.,S.P.Xie,F.Primeau,J.C.McWilliams,and C.Pasquero,2015:Northwestern Pacif c typhoon intensity controlled by changes in ocean temperatures.Science Advances, 1,e1500014.
Palmer,M.D.,K.Haines,S.F.B.Tett,and T.J.Ansell,2007: Isolating the signal of ocean global warming.Geophys.Res. Lett.,34,L23610.
Pun,I.-F.,I.-I.Lin,and M.-H.Lo,2013:Recent increase in high tropical cyclone heat potential area in the Western NorthPacif cOcean.Geophys.Res.Lett.,40,4680-4884,doi: 10.1002/grl.50548.
Shay,L.K.,G.J.Goni,and P.G.Black,2000:Effects of a warmoceanic featureonhurricaneOpal.Mon.Wea.Rev.,128, 1366-1383.
Sobel,A.H.,and S.J.Camargo,2011:Projected future seasonal changes in tropical summer climate.J.Climate,24,473-487, doi:10.1175/2010JCLI3748.1.
Sriver,R.L.,and M.Huber,2007:Observational evidence for an ocean heat pump induced by tropical cyclones.Nature,447, 577-580.
Taylor,K.E.,R.J.Stouffer,and G.A.Meehl,2012:An overview of CMIP5 and the experiment design.Bull.Amer.Meteor. Soc.,93,485-498.
Wada,A.,and N.Usui,2007:Importance of tropical cyclone heat potential for tropical cyclone intensity and intensif cation in thewesternNorthPacif c.Journal ofOceanography,63,427-447,doi:10.1007/s10872-007-0039-0.
Wada,A.,and J.C.L.Chan,2008:Relationship between typhoon activityand upper ocean heat content.Geophys.Res.Lett.,35, L17603,doi:10.1029/2008GL035129.
Wada,A.,N.Usui,and K.Sato,2012:Relationship of maximum tropical cyclone intensity to sea surface temperature and tropical cyclone heat potential in the North Pacif c Ocean.J.Geophys.Res.,117,D11118,doi:10.1029/2012JD017583.
Wang,C.Z.,L.P.Zhang,S.-K.Lee,L.X.Wu,and C.R.Mechoso, 2014:A global perspective on CMIP5 climate model biases.Nature Climate Change,4,201-205,doi:10.1038/nclimate2118.
Liu,R.,C.L.Chen,and G.H.Wang,2016:Change of tropical cyclone heat potential in response to global warming.Adv.Atmos.Sci.,33(4),504-510,
10.1007/s00376-015-5112-9.
30 April 2015;revised 20 August 2015;accepted 21 August 2015)
∗Changlin CHEN
Email:clchen@sio.org.cn
杂志排行
Advances in Atmospheric Sciences的其它文章
- Indo-Western Pacific Ocean Capacitor and Coherent Climate Anomalies in Post-ENSO Summer:A Review
- Evaluating the Formation Mechanisms of the Equatorial Pacif c SST Warming Pattern in CMIP5 Models
- Role of Horizontal Density Advection in Seasonal Deepening of the Mixed Layer in the Subtropical Southeast Pacific
- Changes in Mixed Layer Depth and Spring Bloom in the Kuroshio Extension under Global Warming
- Historical Change and Future Scenarios of Sea Level Rise in Macau and Adjacent Waters
- The Positive Indian Ocean Dipole-like Response in the Tropical Indian Ocean to Global Warming
