Role of Horizontal Density Advection in Seasonal Deepening of the Mixed Layer in the Subtropical Southeast Pacific
2016-11-24QinyuLIUandYiqunLUPhysicalOceanographyLaboratoryQingdaoCollaborativeInnovationCenterofMarineScienceandTechnologyKeyLaboratoryofOceanAtmosphereInteractionandClimateinUniversitiesofShandongOceanUniversityofChinaQingdao266100
Qinyu LIUand Yiqun LUPhysical Oceanography Laboratory/Qingdao Collaborative Innovation Center of Marine Science and Technology, Key Laboratory of Ocean-Atmosphere Interaction and Climate in Universities of Shandong, Ocean University of China,Qingdao 266100
(Received 30 April 2015;revised 20 August 2015;accepted 27 August 2015)
Role of Horizontal Density Advection in Seasonal Deepening of the Mixed Layer in the Subtropical Southeast Pacific
Qinyu LIU∗and Yiqun LU
Physical Oceanography Laboratory/Qingdao Collaborative Innovation Center of Marine Science and Technology, Key Laboratory of Ocean-Atmosphere Interaction and Climate in Universities of Shandong, Ocean University of China,Qingdao 266100
(Received 30 April 2015;revised 20 August 2015;accepted 27 August 2015)
The mechanisms behind the seasonal deepening of the mixed layer(ML)in the subtropical Southeast Pacific were investigated using the monthly Argo data from 2004 to 2012.The region with a deep ML(more than 175 m)was found in the region of(22◦-30◦S,105◦-90◦W),reaching its maximum depth(~200 m)near(27◦-28◦S,100◦W)in September.The relative importance of horizontal density advection in determining the maximum ML location is discussed qualitatively.Downward Ekman pumping is key to determining the eastern boundary of the deep ML region.In addition,zonal density advection by the subtropical countercurrent(STCC)in the subtropical Southwest Pacific determines its western boundary,by carrying lighter water to strengthen the stratification and form a“shallow tongue”of ML depth to block the westward extension of the deep ML in the STCC region.The temperature advection by the STCC is the main source for large heat loss from the subtropical Southwest Pacific.Finally,the combined effect of net surface heat flux and meridional density advection by the subtropical gyre determines the northern and southern boundaries of the deep ML region:the ocean heat loss at the surface gradually increases from 22◦S to 35◦S,while the meridional density advection by the subtropical gyre strengthens the stratification south of the maximum ML depth and weakens the stratification to the north.The freshwater flux contribution to deepening the ML during austral winter is limited.The results are useful for understanding the role of ocean dynamics in the ML formation in the subtropical Southeast Pacific.
mixed layer,seasonal deepening,Southeast Pacific,heat flux,density advection
1.Introduction
The ocean mixed layer(ML)plays an important role in air-sea interactions and climate variability.The ML is characterized by its vertical homogeneity in temperature,salinity and density.The ML depth(MLD)determines the transfer of water mass,momentum,and energy between ocean and atmosphere(de Boyer Mont´eGut et al.,2004).The MLD is important for the subduction process from the surface layer to greater depths(Qiu and Huang,1995;Xie et al.,2011;Liu and Huang,2012),and the subduction process plays an important role in climate variability(Williams,1991;Deser et al.,1996;Sato and Suga,2009;Liu and Wang,2014).
Several mechanisms have been proposed to explain ML formation.Besides Ekman pumping and net surface heat flux,horizontal density advection can also induce change in stratification and MLD(de Boyer Mont´eGut et al.,2004). The Ekman drift in the upper fraction of the ML slides a different water mass over the lower ML,leading to vertical density convection,which,as a possible mechanism for vertical convection,can explain a strong horizontally densitycompensated front south of Australia in winter.Analysis of the seasonal variability of the upper-ocean stratification shows that a specific region with weak stratification in the upper ocean(“stability gap”)detected in the North Pacific central mode water formation region also provides a reliable answer for the“local feature”of the deep ML formation during winter.In addition,cold Ekman advection and warm geostrophic advection also play crucial roles in determining the eastern and western boundaries of the“stability gap”(Pan et al.,2008).
Besides the Antarctic circumpolar region and the North Atlantic deep-water formation region,it is clear that there are otherregionswithlocalmaximumMLD(>100m)inthesubtropical Southeast Pacific and South Atlantic,respectively, during austral winter,based on individual conductivitytemperature-depth(CTD)profiles(de BoyerMont´eGutetal., 2004,Fig.5).On the north side of the local maximum MLD in the Southeast Pacific,there is a strong MLD front and anobvioussubductionprocessinaustralwinter,wheretheSouth Pacific eastern subtropical mode water(SPESTMW)forms (Wong and Johnson,2003).After the SPESTMW is formed, it moves northwestward towards the equator,driven by the eastern component of the South Pacific subtropical gyre,and eventually joins the south equatorial current(Nishikawa and Kubokawa,2012).As the climate warms,the SPESTMW,in sharp contrast with the response to the North Pacific mode water,tends to extend southwestward and is significantly increased in volume,which mainly depends on an intensificationofthesoutheasterlytradewind(Luoetal.,2011).Acomparison of the MLD spatial patterns from a series of numerical ocean model experiments suggested that it is the intensified southeasterly trade wind,via generating a stronger buoyancy flux from the ocean to the atmosphere,that results in a deeper ML in the subtropical Southeast Pacific in a warmer climate(Luo et al.,2011).
It is well known that the MLD is mainly determined by vertical convection and turbulent mixing of the water mass due to wind stress and heat exchange at the air-sea surface (Kara et al.,2003).By using high-quality CTD sections and Argo profile data collected between 1991 and 1996,Wong and Johnson(2003)indicated that the destabilizing of the salinity gradient in the SPESTMW contributes to its formation,with its major subduction region east of 130◦W and north of 30◦S.The Argo profile data also captured the seasonal changes of the vertical gradients of temperature and salinity at the SPESTMW core with density of 24.5-25.8 kg m−3(Sato and Suga,2009).Although based on few CTD profiles,the seasonal variation of the MLD in the subtropical Southeast Pacific has been shown,but CTD data alone were insufficient and the formation mechanism with respect to a deep ML in subtropical Southeast Pacific has not been mentioned(de Boyer Mont´eGut et al.,2004).On the other hand, observations of net surface heat flux in the Southeast Pacific have been used for examining the heat budget of the upper 250 m in the ocean(Colbo and Weller,2007),indicating that the equatorward heat transport compensates for nearly half of the heat balance,while horizontal eddy heat flux divergence accounts for the rest,with Ekman transport and pumping being negligible.These studies did not directly estimate horizontal density advection,because the authors only focused on the heat budget.
In order to understand the seasonal deepening process of the ML in the subtropical Southeast Pacific,we set out to answer the following questions in the present study:When and where does the local maximum of the MLD in the subtropical Southeast Pacific appear?And what determines the location of the deep ML?As is well known,density is usually greater in the south than it is in the north,and the surface wind is southeasterly,in the subtropical Southeast Pacific. The southwestward Ekman flow and the eastward subtropical countercurrent(STCC)advecting low-density water are not conducive to ML deepening during austral winter.So,we hypothesized that the northwestward subtropical gyre current plays an important role in the seasonal deepening of the ML, because it should advect heavier water northwards from the south and weaken the upper-ocean stratification there.
In the remainder of the paper,we introduce the data in section 2.We show the location of the maximum MLD and seasonal evolution of the MLD,and discuss the relative importance of each factor in determining the maximum ML location,in section 3.Section 4 summarizes the study's key findings.
2.Data
When studying the ML and mode water subduction in the North Pacific,the use of reanalysis data produces different results to Argo data because eddy-resolving model results are closer than non-eddy resolving model results to Argo observations(Xu et al.,2014).The temperature and salinity data used in this study were from Argo profiling floats in the Pacific Ocean from January 2004 to December 2012.Each float descended to a preprogrammed parking depth(typically 1000 m),drifted freely at that depth,and then ascended to the surface at a predetermined interval(usually 10 days)after descendingtothemaximumpressure(2000m).Thesedatawere collected and quality-controlled before being made freely available by the International Argo Program and the national programs that contributed to it(http://www.argo.ucsd.edu, http://argo.jcommops.org).Only profiles with a quality flag of“1”and“2”,indicating“good data”and“probably good data”respectively,were used in this study,resulting in a total of 20 571 profiles in the Pacific region(40◦S-20◦N, 120◦E-60◦W)and 1425 profiles in the subtropical Southeast Pacific(20◦-40◦S,90◦-120◦W).Further quality control was conducted by the China Argo Real-time Data Center (http://www.argo.org.cn),including interpolating the profile data into vertical standard depths(of 48)by the Akima interpolation method,and then averaging in each 1◦×1◦bin. Good coverage of Argo floats ensured the viability of our study in this region.The potential temperature and density (called temperature and density henceforth)referred to the surface are calculated from the interpolated temperature and salinity data.
Themonthlynetsurfaceheatfluxdatafrom2004to2009, at 1◦×1◦resolution,were acquired from the Objectively Analyzed Air-Sea Fluxes(OAFlux)project at the Woods Hole Oceanographic Institution(Yu et al.,2006).The objective analysis method used in OAFlux combines optimal satellite measurements and model reanalysis data(Yu and Weller, 2007;Yu,2007).According to Large and Yeager(2008)and Liu et al.(2010),the net surface heat flux of OAFlux is overestimatedbyabout5-10Wm−2inthetropicalregion.Therefore,we first removed the extra heat flux from the shortwave radiation(keeping only 94.5%of its shortwave radiation)before we analyzed the net heat flux(Liu et al.,2010).
The OAFlux monthly 1◦×1◦evaporation data(in cm yr−1)from January 2004 to December 2009 were also used. Meanwhile,the monthly precipitation data(in mm d−1),on a 2.5◦×2.5◦grid,were from the CMAP dataset,which merges gauge data with five kinds of satellite estimates,from January 2004 to December 2009(Xie and Arkin,1997).
The Quick Scatterometer(QuikSCAT)winds were used to calculate the wind stress curl and Ekman pumping velocity.QuikSCAT consists of weekly-mean scalar ocean surface wind speed,ocean surface wind direction,and a rain flag/ collocated radiometer rain rate combination value,at a resolution of 0.25◦×0.25◦.For averaged QuikSCAT data,wind speeds are scalar-averaged,while wind directions are vectoraveraged.
The monthly-mean dynamic topography from 2004 to 2012 was obtained from the Archiving,Validation,and Interpretation of Satellite Oceanographic(AVISO)data(AVISO, 2008),whose horizontal resolution is 0.25◦×0.25◦.
The MLD was defined as the depth at which the ocean potential density is different from the 5-m density by 0.125 kg m−3,following de Boyer Mont´eGut et al.(2004).The geostrophic current and sea surface height were calculated using the monthly-mean Argo temperature and salinity data relative to 1200 m.
3.Seasonal deepening of the ML
3.1.Seasonal ML deepening processes and Ekman pumping
The climatology was defined using the average during the period 2004-12.Figure 1 shows the seasonal ML deepening processesinthesubtropicalSoutheastPacificfromaustralfall to spring.During austral fall(April and May),the MLD is only about 50-75 m(Figs.1a and b)in the whole subtropical South Pacific.The ML deepens gradually in the approximate area(20◦-30◦S,120◦-90◦W)during June to August,which is spatially non-uniform(Figs.1c-e).The deep ML(>175 m)islocatedinthearea(22◦-32◦S,105◦-90◦W),reachingits maximum(~200 m)near(27◦S,100◦W)in September(early austral spring)(Fig.1f).There is also a“shallow tongue”of the MLD(zonal band with shallow MLD)in the area (20◦-30◦N,180◦-120◦W)(Figs.2d-f).Similar features of the MLD seasonal cycle have been reported before,based on float observation data(Wong and Johnson,2003)and limited CTD data(de Boyer Mont´eGut et al.,2004).After September,the MLD becomes shallower,since the deep winter ML is quickly replaced by a shallow seasonal thermocline as the surface temperature rises.As indicated by Sato and Suga (2009),the northern part of the deepest MLD in the subtropical Southeast Pacific is the formation region of the South Pacific eastern subtropical mode water.
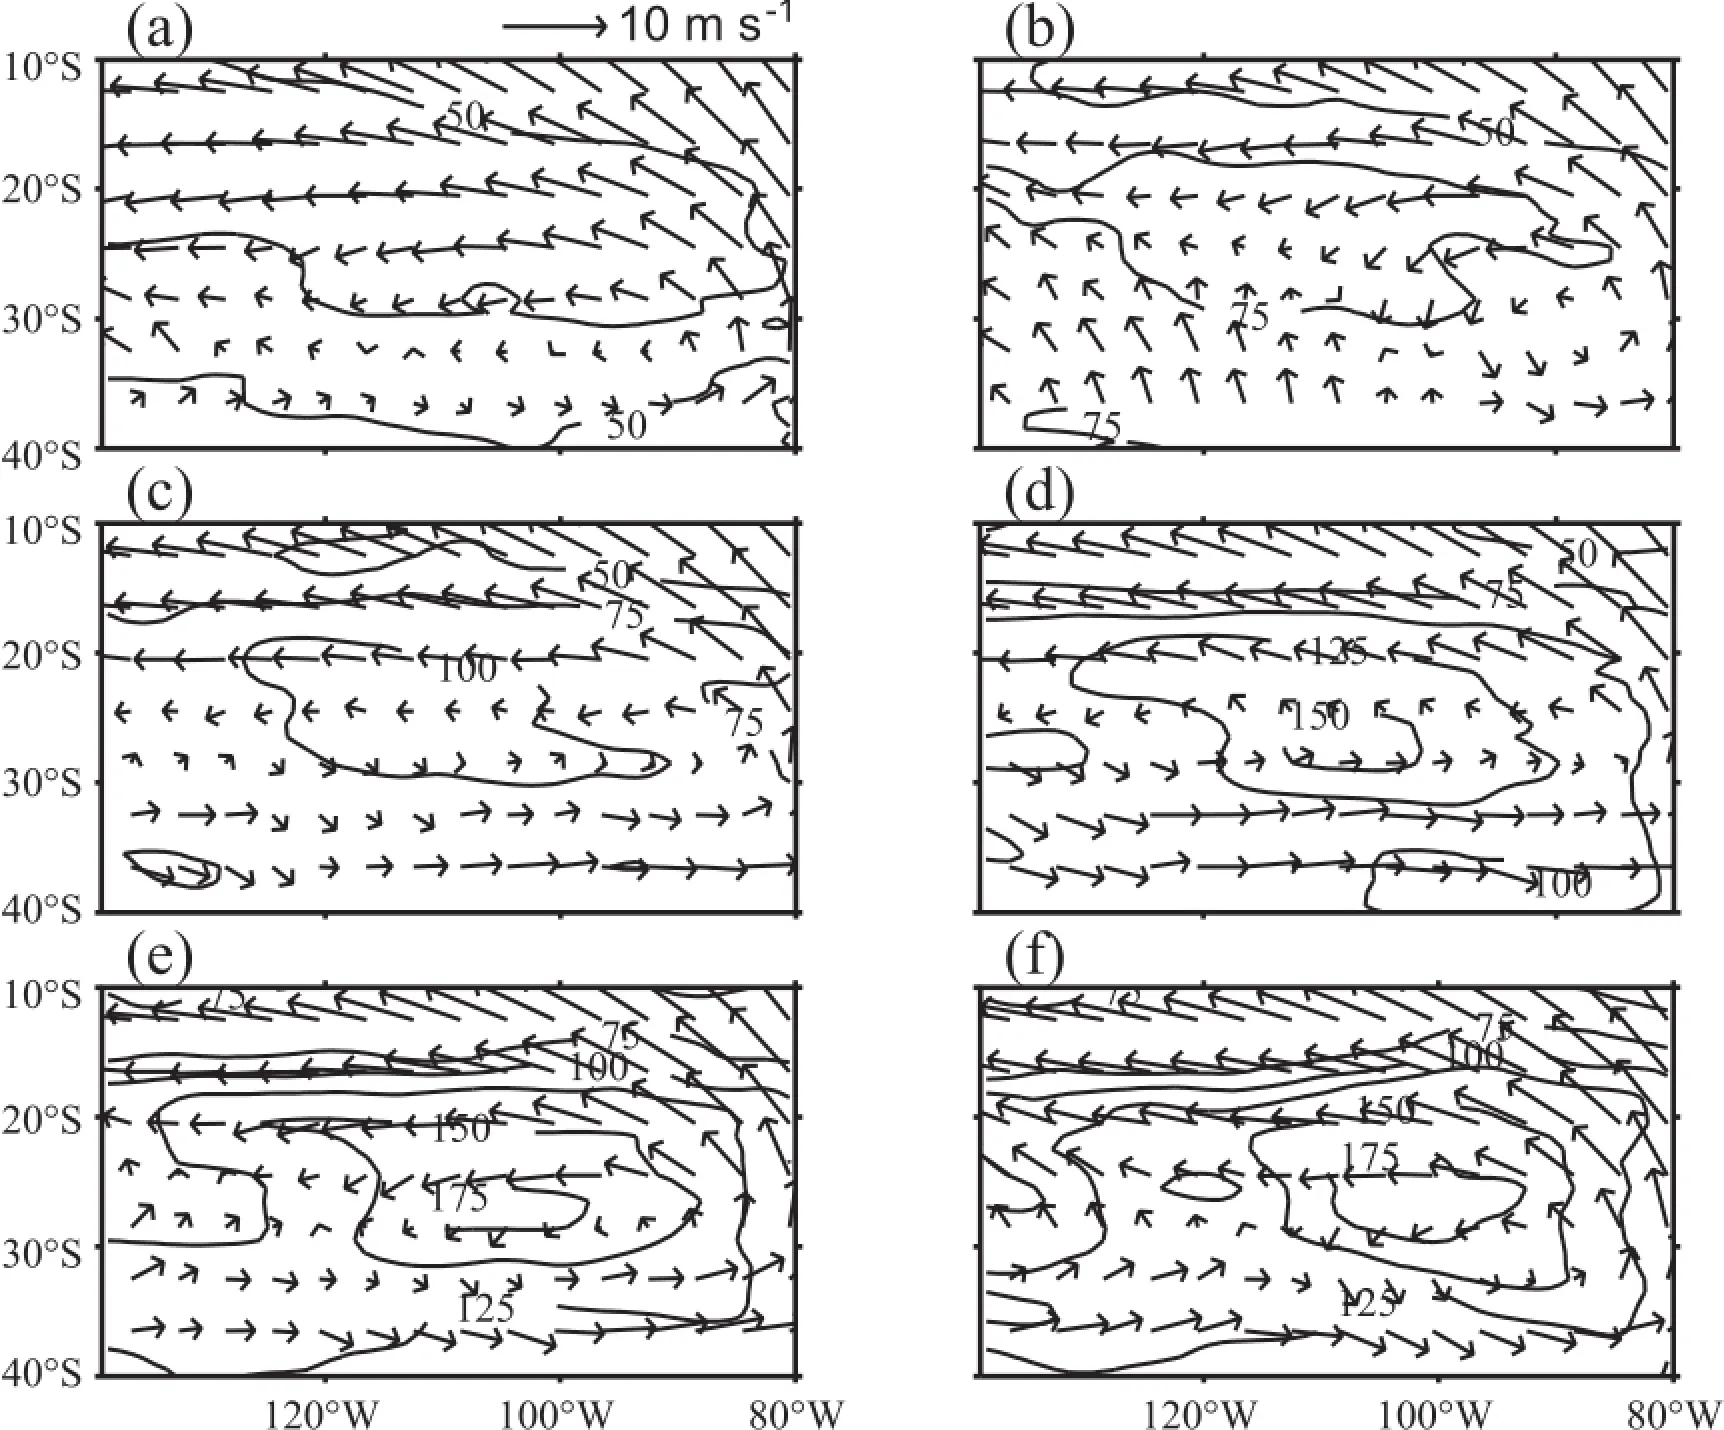
Fig.1.Climatology of monthly-mean MLD(showing contours of 50,75,100,125,150 and 175 m)and surface wind (arrows;m s−1)in(a)April,(b)May,(c)June,(d)July,(e)August,and(f)September.
Corresponding to the seasonal deepening of the ML,the sea surface wind is shown in Fig.1.There is a trade wind near the equator and a westerly jet in the middle latitudes in the subtropical South Pacific.There is negative(downwards) Ekman pumping in the whole basin,and larger absolute val-ues of negative Ekman pumping are located in the west and east of the subtropical South Pacific(about 20◦S),respectively.The negative Ekman pumping is key to determining the eastern boundary of the subtropical gyre,where the seasonal thermocline outcrops and the ventilated thermocline location is controlled by the Ekman pumping.Considering the upwelling near the west coast of South America,the Ekman pumpingisthemajorfactordeterminingtheeasternboundary of the deep ML region(Huang,2010).
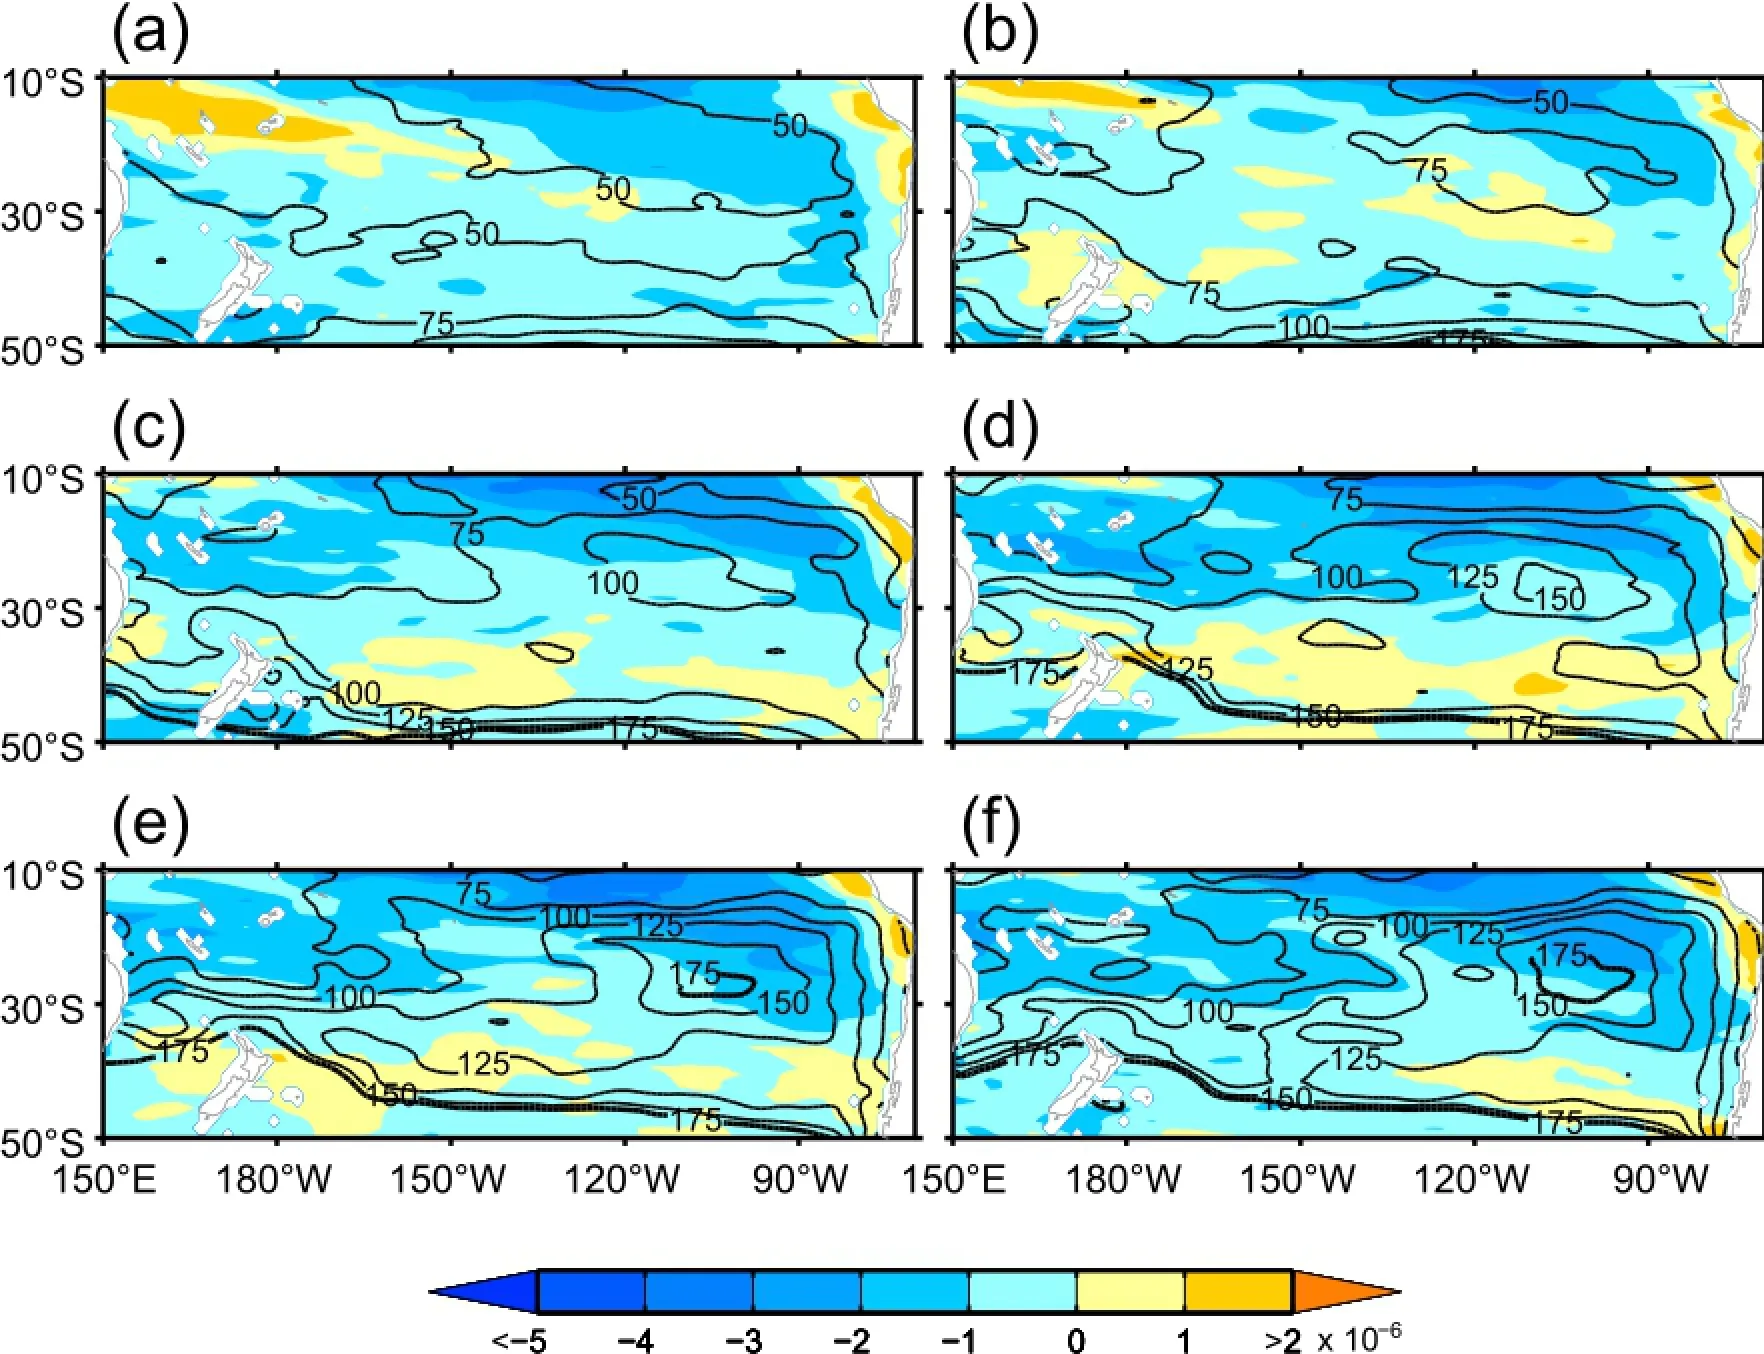
Fig.2.Climatology of Ekman pumping velocity(shading;positive upward;m s−1)and MLD(showing contours of 50, 75,100,125,150 and 175 m)in(a)April,(b)May,(c)June,(d)July,(e)August,and(f)September.
3.2.Net surface heat flux,freshwater flux and horizontal density advection
Ocean heat loss is an important factor for ML deepening. The negative net surface heat flux(ocean losing heat)during April to August is located between 22◦S and 50◦S,which contributes to deepening the ML in the whole ocean basin (Figs.3a-f).However,a larger absolute value of negative net surface heat flux with a zonal band pattern appears around the southwest of,rather than southeast of,the subtropical Pacific, and its pattern corresponds to a shallower ML,meaning there may be other processes supporting the loss of heat by the ocean in the subtropical Southwest Pacific.In the subtropical Southeast Pacific,the ocean surface heat loss increases gradually from 22◦S to 35◦S in May and June(Figs.3b and c), and the deepest ML(over 175 m)is located in the area(22◦-32◦S,105◦-90◦W).According to the above discussion,we can conclude that the deep ML is constricted to the south of 22◦S because the ocean heat loss occurs south of 22◦S(Figs. 3a-e)during May to August.Since the heat loss is larger in the south of the maximum MLD region than in the north (Figs.3b-e),itmeansthereareotherfactorsblockingtheconvective mixing process in the relatively shallow MLD region when the heat loss increases during June,July and August.
According to Figs.1c-e,the northward Ekman current corresponding to the westerly jet south of 30◦S carries denser ocean surface water northwards in the shallow surface(<50 m;not shown),which contributes to vertical mixing between 30◦S and 40◦S during June to August.Since the Ekman current is stronger in the south than it is in the north,it can be inferred that the Ekman current has a negative effect on the northward deepening of the MLD in the area(30◦-40◦S, 120◦-90◦W).On the other hand,the southwestward Ekman current corresponding to the trade wind north of 20◦S carries the light water southwestwards,which blocks the deepening of the ML south of 20◦S.Thus,according to the horizontal density advection by the Ekman currents,we are unable to explain why the local maximum of the MLD appears in the area(22◦-32◦S,105◦-90◦W).
As we know,the South Pacific convergence zone extends southeastward from Northeast Australia,which can inducea precipitation belt.In order to identify the freshwater flux contribution to ML deepening in austral winter,the freshwater flux(evaporation minus precipitation;E-P)is shown in Figs.3g-l.We can see that negative E-P flux,where fresher oceansurfacewaterweakenstheverticalmixingprocess,corresponds well to a shallower ML(Figs.3g-l).During austral winter(June to September),larger positive E-P flux,which gives denser ocean surface water and enhances the vertical mixing process,appears in the subtropical shallower ML region west of the dateline and north of 20◦S(Figs.3i-l). Therefore,the freshwater flux only contributes to determine the pattern of the ML during austral fall,and its contribution is limited during austral winter.
3.2.1.Role of the STCC in zonal density advection
Theroleofpotential-densityhorizontaladvection(PDHA) transported by the geostrophic currents is investigated in this section.PHDA is defined as

whereρis sea water potential density relative to the surface, ugand vgare the zonal and meridional components of the geostrophic current velocity,respectively.Note that negative (positive)PDHA means heavier(lighter)water replaces the local water via horizontal advection.
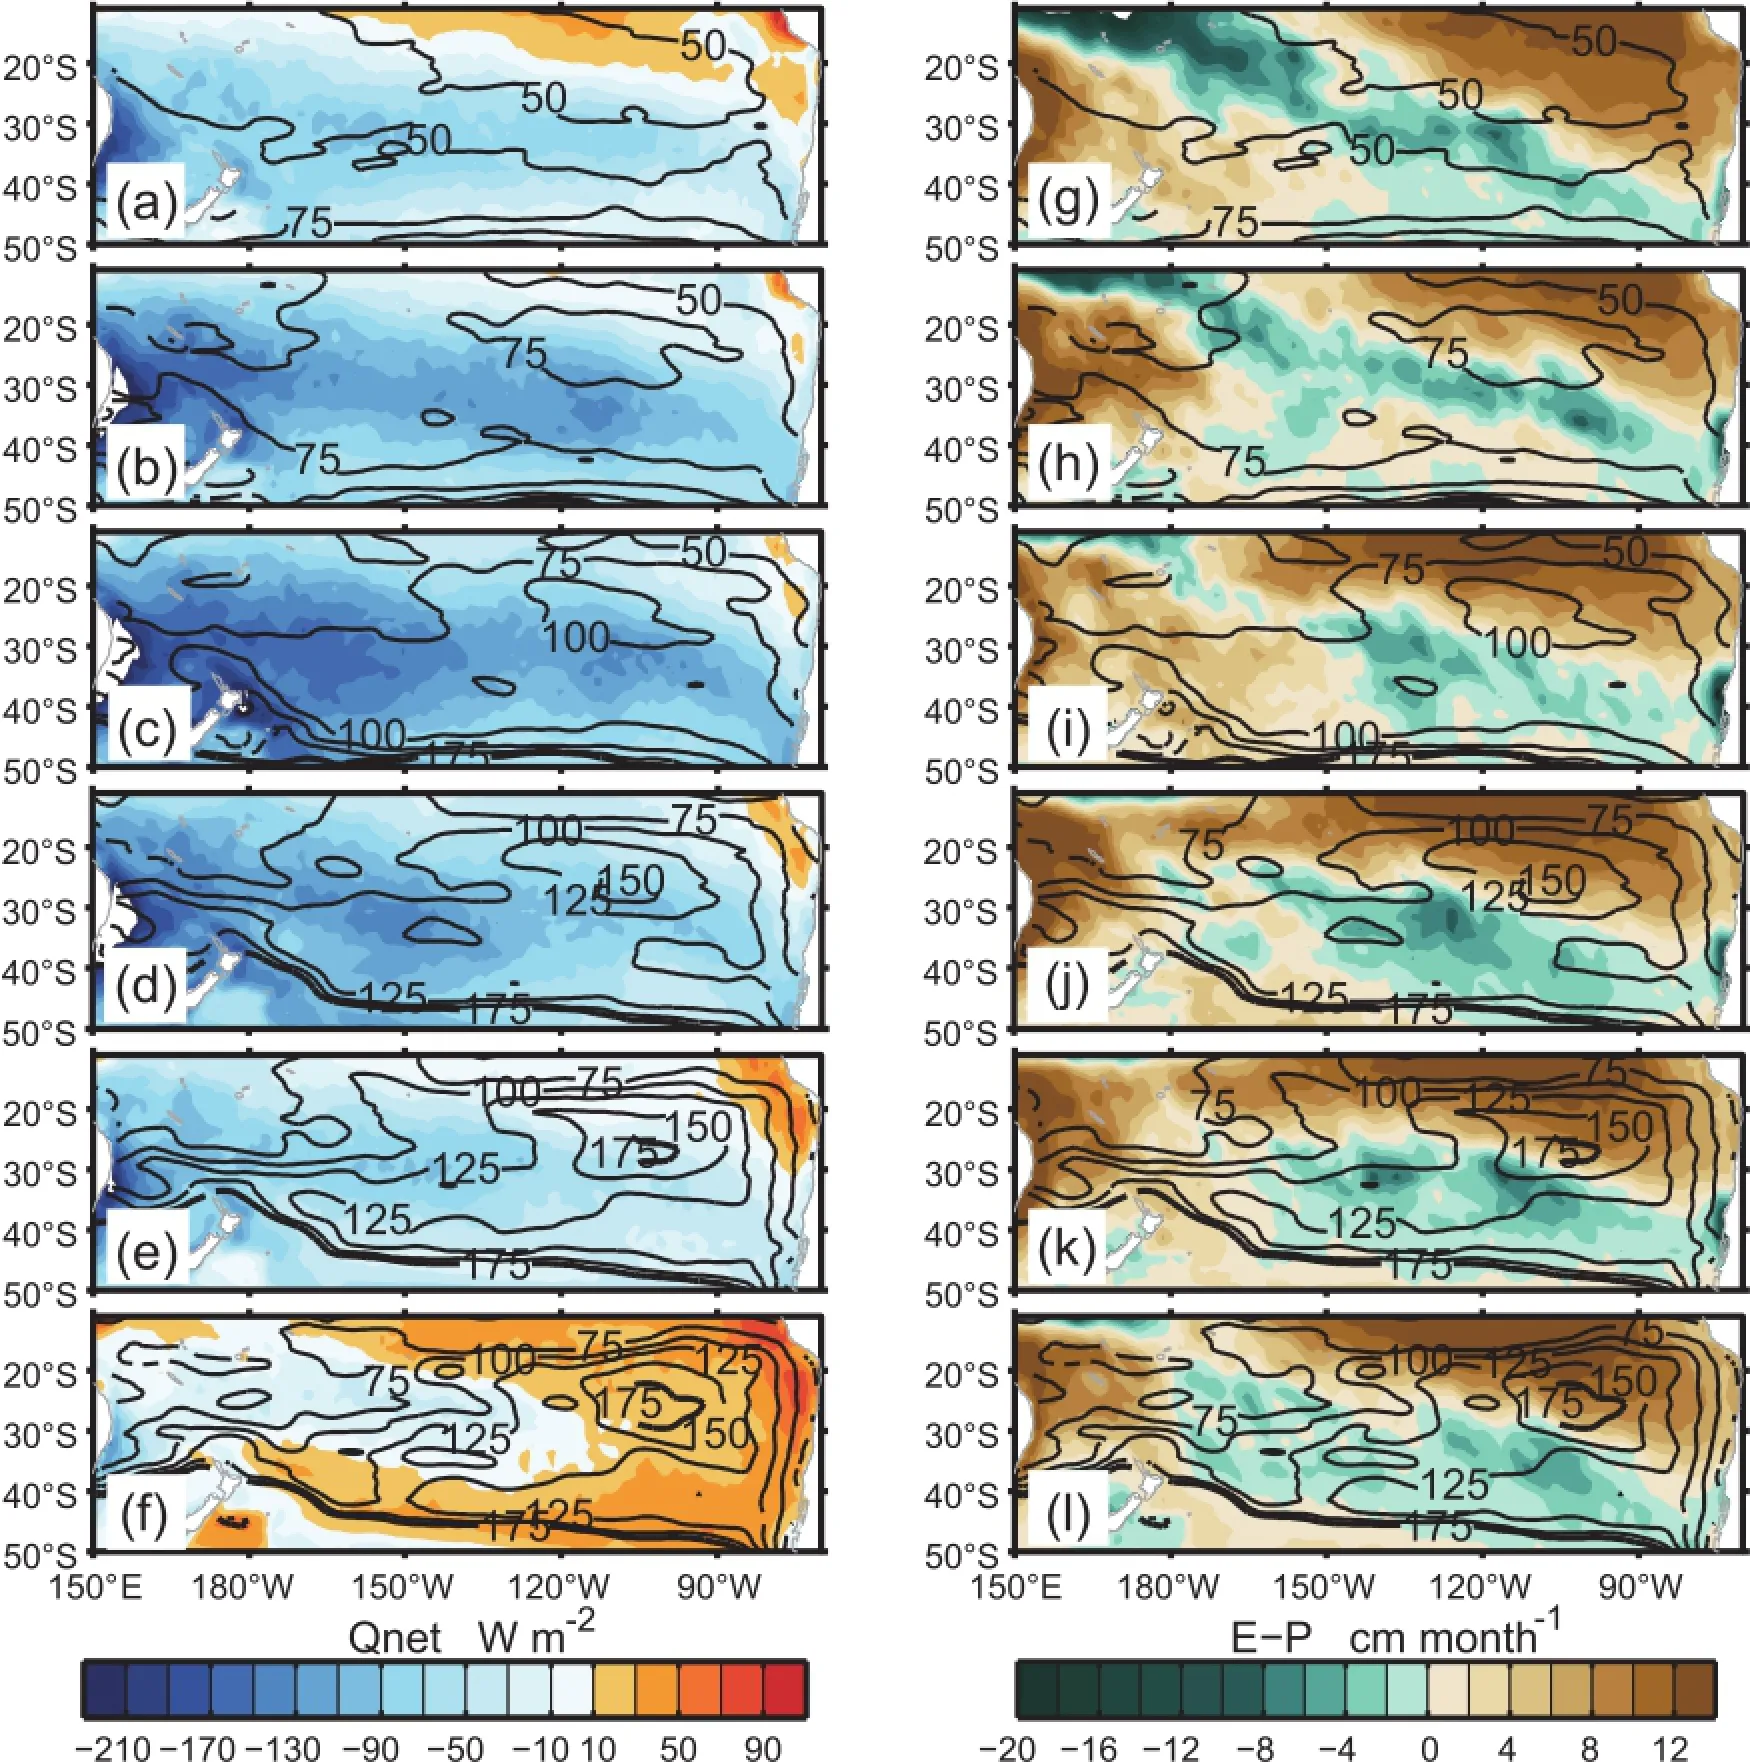
Fig.3.Climatology of monthly-mean(a-f)net surface heat flux(shading;positive downward;W m−2),(g-l)freshwater flux(shading;positive means evaporation is larger than precipitation),and MLD(as in Fig.2)in(a,g)April,(b,h) May,(c,i)June,(d,j)July,(e,k)August,and(f,l)September.
In order to show whether the zonal density advection by the STCC can induce the“shallow tongue”of the MLD,the geostrophic current(0-100 m)and the standard deviation of the surface steric height are shown in Fig.4.The STCC between 20◦S and 30◦S west of 100◦W takes the light water from the warm pool in the subtropical Southwest Pacific to the subtropical Southeast Pacific(positive zonal PDHA) in the upper 100 m between 22◦S and 30◦S,across 130◦-140◦W.It is worth noting that the larger PDHA is in the upper layer(Fig.5),which corresponds to a shallower ML,inducing a more stable stratification and weakening the mixing process.In addition,the positive advection in the upper layer contributes to the larger heat loss west of 100◦W than east of 100◦W between 22◦S and 30◦S,causing the maximum of negative net surface heat flux to locate around the subtropical Southwest Pacific.During austral winter,the MLD is deeperthan 80 m within 130◦-140◦W,which means the freshwater flux has a limited role(Figs.5c-f).
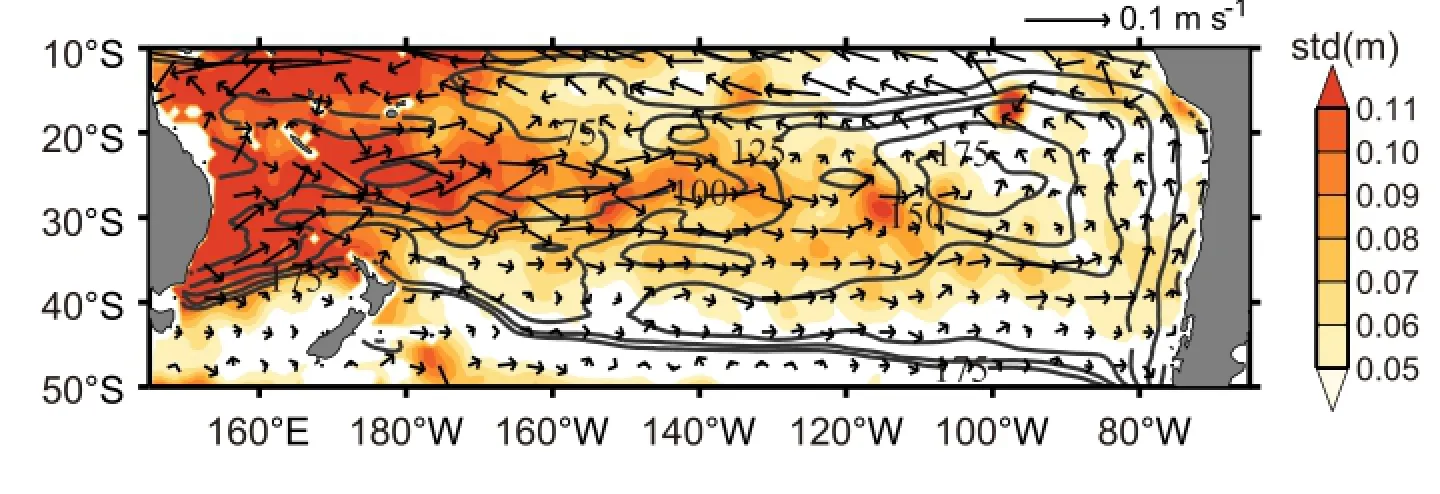
Fig.4.Map of MLD in September(as in Fig.2f),standard deviation of surface steric height (shading;units:m)and geostrophic current(averaged within 0-100 m,relative to 1200 m, vectors in m s−1)in the South Pacific Ocean.
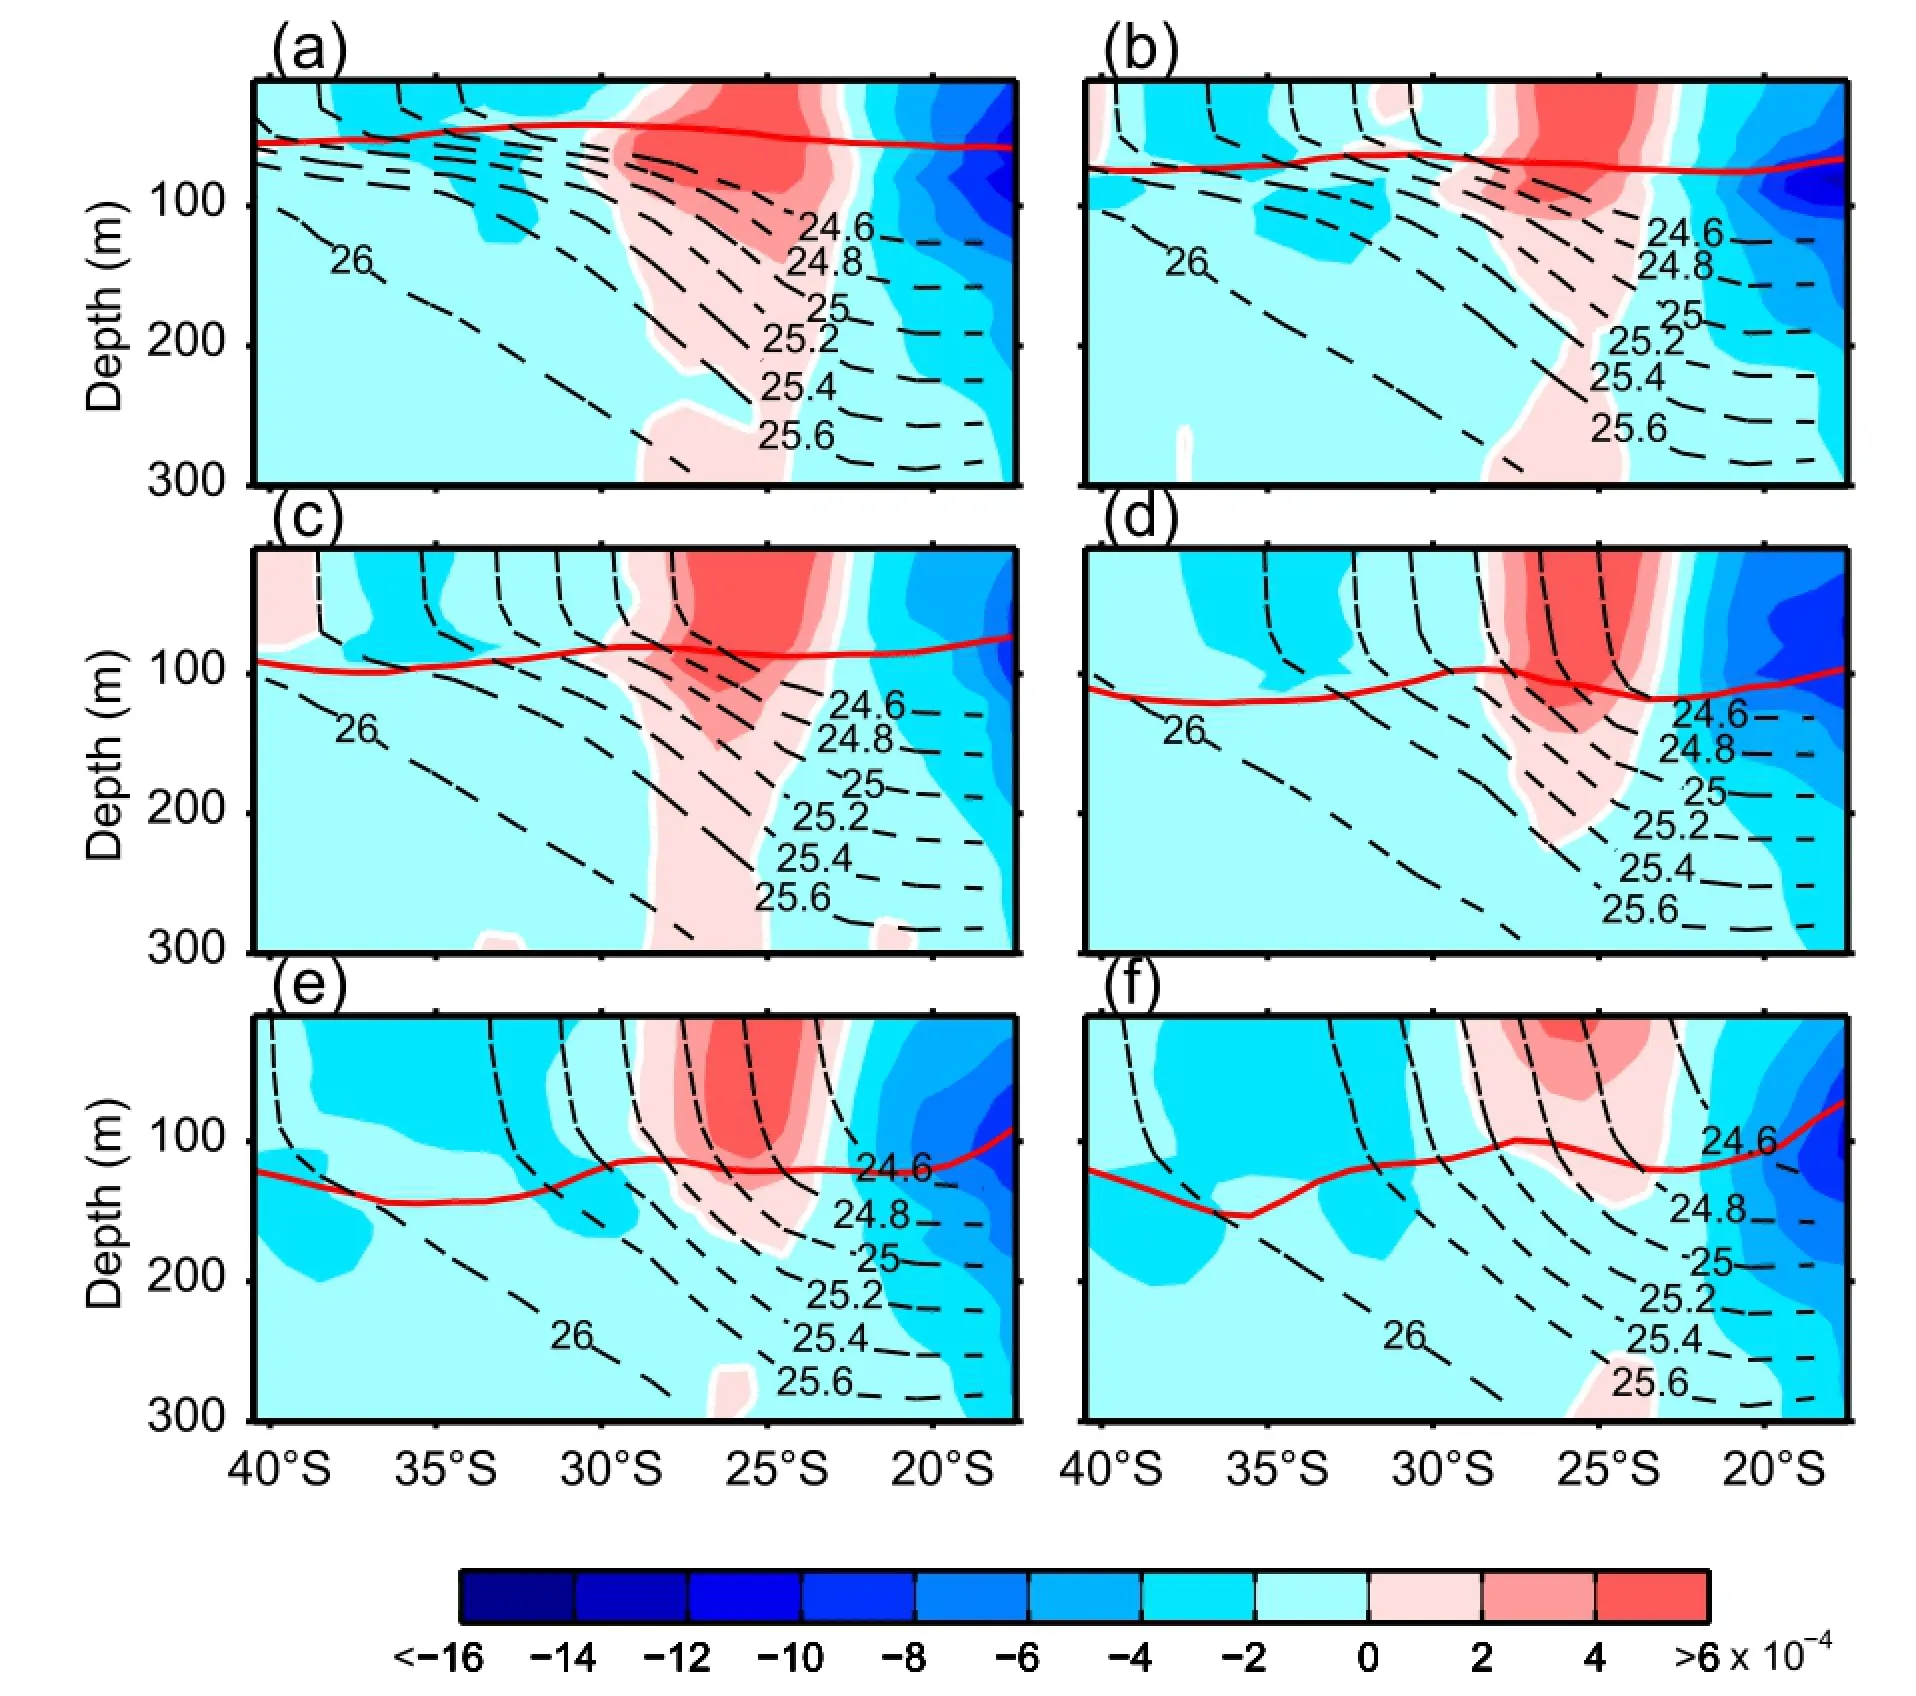
Fig.5.Depth-latitude section of zonal PDHA along 130◦-140◦W(shading;light shading for“zero”;kg m−3s−1)in(a) April,(b)May,(c)June,(d)July,(e)August,and(f)September.Superimposed are the MLD(red line)and isopycnals (black dashed lines).
Therefore,ocean heat loss contributes to deepening the ML,but the zonal PDHA by the STCC west of 100◦W constrains the ML deepening process west of the deep ML region bytransportinglighterwaterintheupperlayerandstabilizing the stratification.The STCC blocks the westward extension of the deep ML,and its advection is the main mechanism behind the formation of the MLD“shallow tongue”.In addition,the heat advection by the STCC is the main source of heat that forms a zonal band of large surface heat loss in the subtropical Southwest Pacific.
3.2.2.Meridional PDHA
The effect of PDHA on ocean stratification in the deep ML region(22◦-32◦S,105◦-90◦W)is investigated in this subsection.Since the ocean loses heat south of 22◦S,the northern boundary of the deep ML region should be 22◦S. However,the maximum heat loss region is south of the maximum ML region during June to August(Figs.3c-e)and the role of the Ekman current cannot determine the deep ML region within 22◦-32◦S.This inconsistency has not been discussed before.Since the meridional gradient of density is larger than the zonal gradient,the absolute value of the zonal PDHA is much smaller than that of the meridional PDHA in the deep ML region.In order to find out what determines the southern boundary of the deep ML region,the zonal-mean meridional PDHA along the eastern section(90◦-95◦W)and that along the western section(104◦-107◦W)of the maximum MLD region are shown in Figs.6 and 7,respectively.
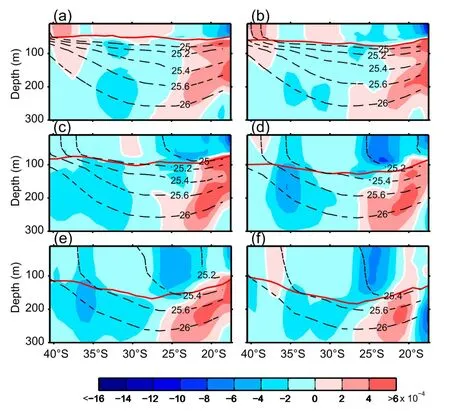
Fig.6.Depth-latitude section of meridional PDHA along 91◦-95◦W(shading;light shading for“zero”;kg m−3s−1) in(a)April,(b)May,(c)June,(d)July,(e)August,and(f)September.Superimposed are the MLD(red line)and isopycnals(black dashed lines).
In the eastern section,the maximum MLD(~180 m) is located at 27◦S in September(Fig.6f).The meridional PDHA between 22◦S and 27◦S along this section is negative (approximately−6×10⁻⁴kg m−3s−1)in the upper isopycnal layers(<25.5 kg m−3;called the“upper layer”hereafter)and positive(<4×10⁻⁴kg m−3s−1)in the lowerisopycnal layers(≥25.5 kg m−3;called the“lower layer”hereafter),because of the opposite meridional PDHAs between the two layers(Fig.6).The largest vertical gradient of the meridional PDHA is about 10−3kg m−3s−1in July (Fig.6d),which weakens the ocean stratification significantly and strengthens the vertical mixing between 22◦S and 27◦S, where the southwestward Ekman current corresponding to the trade wind north of 20◦S can strengthen the ocean stratification.The meridional PDHA is mostly negative(−2×10⁻⁴to−4×10⁻⁴kg m−3s−1)south of 27◦S,with its large absolute values in the layer beneath the ML and its maximum at 35◦S during June to September(Figs.6c-f).This strengthens the ocean stratification and weakens the vertical mixing, even though the ocean loses more heat south of 27◦S,where the Ekman current corresponding to the westerly jet south of 30◦S weakens the ocean stratification.Therefore,the combined effect of meridional PDHA and ocean heat loss determines the northern and southern boundaries in the western section of the maximum MLD region and sets the deepest MLD at 27◦S.
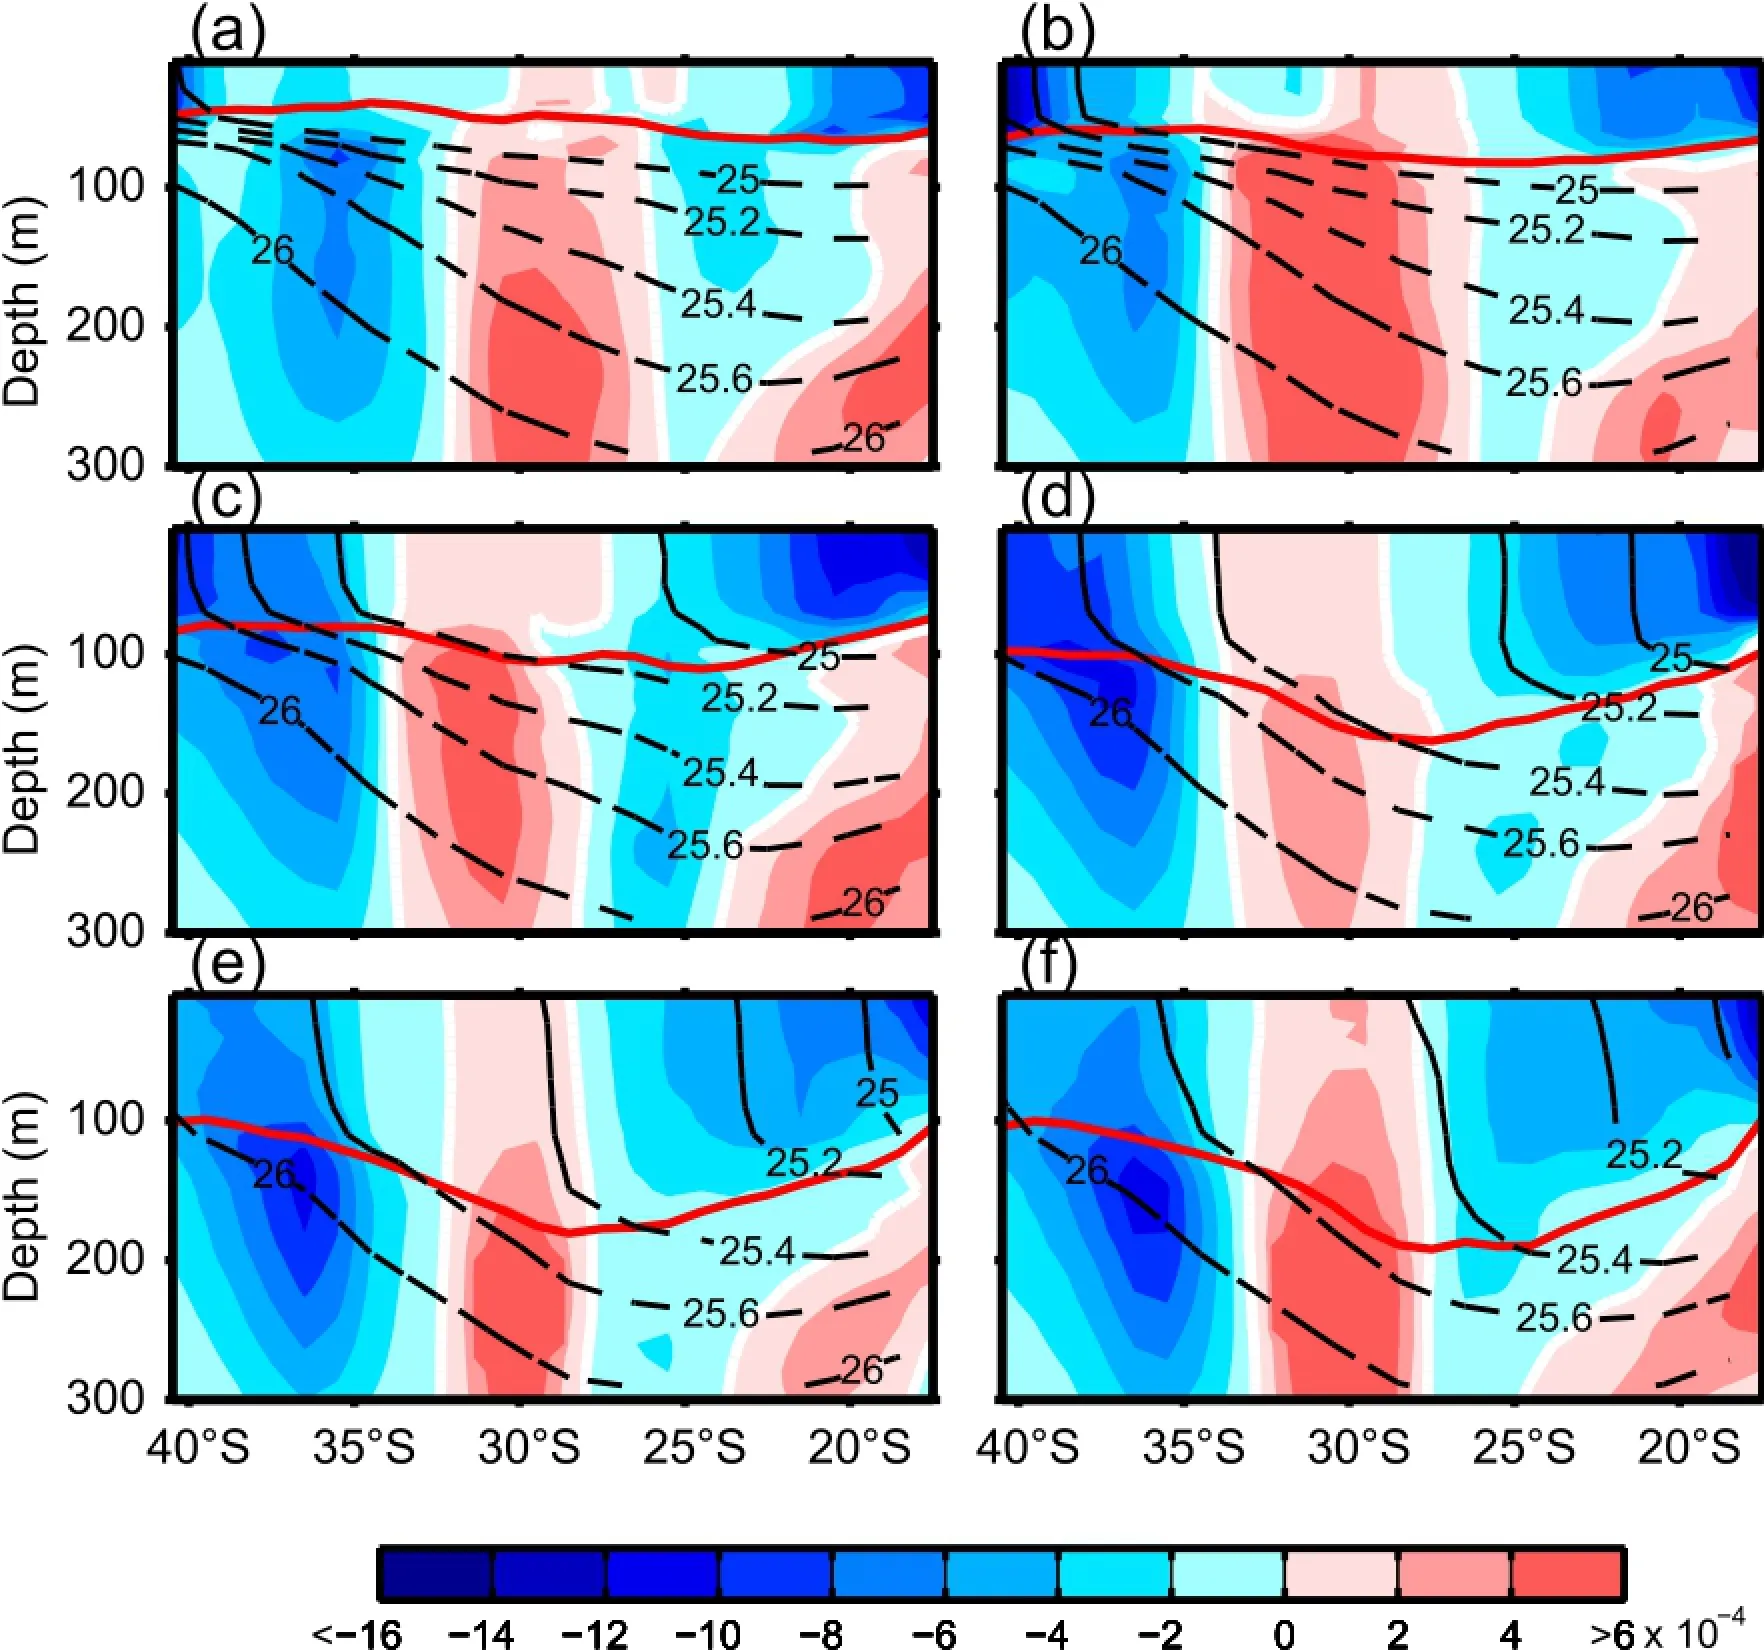
Fig.7.As in Fig.6 but along 104◦-107◦W.
Along the 104◦-107◦W section(western section),the maximum MLD is located between 27◦and 28◦S,and is about 190 m in September(Fig.7f).During May to August,theverticalgradientofmeridionalPDHAalongthissection induces a weaker stratification with negative meridional PDHA in the upper layer and positive meridional PDHA in the lower layer north of 27◦S(Figs.7b-e),similar to those along the eastern section(Fig.6).There is,however,an obvious difference between the eastern and western sections in that a positive meridional PDHA exists between 28◦S and 32◦S in all months along the western section,and its difference between the lower and upper layers is only about 4×10⁻⁴kg m−3s−1(Fig.7).Although the vertical gradient is much less than that in the north,it also weakens the ocean stratification.This is the reason why the maximum ML(about 190 m)region is wider in the meridional direction along the western section than along the eastern section. The meridional PDHA is negative south of 32◦S,and larger absolute values lie beneath the ML,strengthening the ocean stratification and weakening the mixing process.This sets the southern boundary of the deep ML region at 32◦S(Fig.7).It is worth mentioning that the positive PDHA around 30◦S ispresumed to be related to a southward eddy-induced current (Fig.4).In other words,the combined effect of meridional PDHA and net surface heat flux determines the northern and southern boundaries in the eastern section of the maximum MLD region and sets the deepest ML location at 27◦S.Along this section,the effect of the Ekman current on ocean stratification is also opposite to that of the geostrophic current.
Based on the above analysis,we can conclude that there are two factors determining the northern and southern boundaries of the deep MLD region:the gradually increasing ocean heat loss from 22◦S to 35◦S,and the meridional PDHA, which induces a stable stratification south of the deep ML region.These two factors combine to determine the location of the maximum MLD region along 27◦-28◦S.The northern boundary of the deep ML region is 22◦S,and the southern boundary is 32◦S.
4.Conclusions and discussion
A qualitative investigation of the relative importance of Ekman pumping,net surface heat flux,freshwater flux,and horizontal density advection in the seasonal deepening of the ML in the subtropical Southeast Pacific was conducted in this study using the Argo profile data during 2004-12.During austral fall and winter,the ML deepens gradually around (20◦-32◦S,120◦-90◦W).The deep ML(>175 m)is located in the area(22◦-32◦S,105◦-90◦W),reaching its seasonal maximum(~200 m)near(27◦-28◦S,100◦W)in September.
The downward Ekman pumping has two local maximum regions in the west and east subtropical South Pacific,respectively.The eastern boundary of the downward Ekman pumping is key in determining the eastern boundary location of the deep ML region.
The freshwater flux only contributes to the ML pattern during austral fall,and its contribution is limited during austral winter.
The zonal PDHA by the STCC places a warm,freshwater cap in the upper layer,which strengthens the upperocean stratification and determines the western boundary of the deep ML region.The STCC blocks the westward extension of the deep ML region and forms an MLD“shallow tongue”along the STCC.This discovery implies a close relationship between the STCC and the ML in the subtropical Southeast Pacific,and explains the dynamic mechanism for the zonal band of large heat.The northern and southern boundariesofthedeepMLregionaredeterminedbythecombined effect of net surface heat flux and meridional PDHA in the subtropical Southeast Pacific.The gradual increase in ocean heat loss from 22◦S to 33◦S deepens the ML,while the meridional PDHA by the subtropical gyre strengthens the upper-ocean stratification south of 27◦-28◦S and weakens the stratification north of 27◦-28◦S,which sets the boundaries in the north and south.
Although yielding far more profiles than historical CTD collections,the Argo coverage is not sufficient for a quantitative study on the seasonal variation of the ML.This is because,to date,there have not been any good-quality measurements of the seasonal variation of the vertical velocity and entrainment velocity at the bottom of the ML in the subtropical southeast Pacific Ocean.Unfortunately,both vertical velocity and entrainment velocity calculated based on the geostrophic current contain large errors.In addition,given the deficiency in vertical velocity and entrainment velocity observation,we cannot determine which ocean numerical models have the greater ability to simulate the mixing process successfully.Thus,the present-reported results are merely qualitative.Quantitativestudies using long-termoceanobservations and high-quality simulations from numerical models are necessary in the future.
Acknowledgements.This work was supported by the National Basic Research Program of China(Grant No.2012CB955603), the National Natural Science Foundation of China(Grant Nos. 41176006 and 41490643),and the Shandong Joint Fund for Marine Science Research Centers(Grant No.U1406401).
REFERENCES
AVISO,2008:SSALTO/DUACS User Handbook:(M)SLA and (M)ADT Near-Real Time and Delayed Time Products.Collecte Localisation Satellites,Agne,France,39 pp.
Colbo,K.,and R.Weller,2007:The variability and heat budget of the upper ocean under the Chile-Peru stratus.J.Mar.Res.,65, 607-637.
de Boyer Mont´eGut,C.,G.Madec,A.S.Fischer,A.Lazar,and D. Iudicone,2004:Mixed layer depth over the global ocean:An examination of profile data and a profile-based climatology. J.Geophys.Res,109,C12003,481-497.
Deser,C.,M.A.Alexander,and M.S.Timlin,1996:Upper ocean thermal variations in the North pacific during 1970-1991.J. Climate,9,1840-1855.
Huang,R.X.,2010.Oceanic Circulation:Wind-driven and Thermohaline Processes.Cambridge University Press,Cambridge,360-369.
Kara,A.B.,P.A.Rochford,and H.E.Hurlburt,2003:Mixed layer depth variability over the global ocean.J.Geophys.Res.: Oceans(1978-2012),108(C3),209.
Large,W.G.,and S.G.Yeager,2008:The global climatology of an interannually varying air-sea flux data set.Climate Dyn., 24,341-364,doi:10.1007/s00382-008-0441-3.
Liu,C.Y.,and Z.M.Wang,2014:On the response of the global subduction rate to global warming in coupled climate models. Adv.Atmos.Sci.,31(1),211-218,doi:10.1007/s00376-013-2323-9.
Liu,H.L.,W.Y.Lin,and M.H.Zhang,2010:Heat budget of the upper ocean in the south-central Equatorial Pacific.J.Climate,23(7),1779-1792.doi:10.1175/2009JCLI3135.1
Liu,L.L.,and R.X.Huang,2012:The global subduction/obduction rates:Their interannual and decadal variability.J.Climate,25(4),1096-1115.
Luo,Y.Y.,Q.Y.Liu,and L.M.Rothstein,2011:Increase of South Pacific eastern subtropical mode water under global warming. Geophys.Res.Lett.,38,L01601.
Nishikawa,S.,and A.Kubokawa,2012:Mixed layer depth front andsubductionoflowpotentialvorticitywaterunderseasonal forcings in an idealized OGCM.Journal of Oceanography,68(1),53-62.
Pan,A.J.,Q.Y.Liu,and Z.Y.Liu,2008:Formation mechanism of the“Stability Gap”and the North Pacific central mode water. Chinese Journal of Geophysics,51(1),77-87.(in Chinese)
Qiu,B.,and R.X.Huang,1995:Ventilation of the North Atlantic and North Pacific:Subduction versus obduction.J.Phys. Oceanogr.,25,2374-2390.
Sato,K.,and T.Suga,2009:Structure and modification of the South Pacific eastern subtropical mode water.J.Phys. Oceanogr.,39,1700-1714.
Williams,R.G.,1991:Theroleofthemixedlayerinsettingthepotential vorticity of the main thermocline.J.Phys.Oceanogr., 21,1803-1814.
Wong,A.P.S.,and G.C.Johnson,2003:South Pacific eastern subtropical mode water.J.Phys.Oceanogr.,33(7),1493-1509.
Xie,P.P.,and P.A.Arkin,1997:Global precipitation:A 17-year monthly analysis based on gauge observations,satellite estimates,andnumericalmodeloutputs.Bull.Amer.Meteor.Soc., 78,2539-2558.
Xie,S.P.,L.X.Xu,Q.Y.Liu,and F.Kobashi,2011:Dynamical role of mode water ventilation in decadal variability in the central subtropical gyre of the North Pacific.J.Climate,24, 1212-1225.
Xu,L.X.,S.P.Xie,J.L.McClean,Q.Y.Liu,and H.Sasaki, 2014:Mesoscale eddy effects on the subduction of North Pacific mode waters.J.Geophys.Res.-Oceans,119,4867-4886, doi:10.1002/2014JC009861.
Yu,L.S.,2007:Global variations in oceanic evaporation(1958-2005):The role of the changing wind speed.J.Climate, 20(21),5376-5390.
Yu,L.S.,and R.A.Weller,2007:Objectively analyzed air-sea heat fluxes for the global ice-free oceans(1981-2005).Bull. Amer.Meteor.Soc.,88(4),527-539.
Yu,L.S.,X.Z.Jin,and R.A.Weller,2006:Role of net surface heat flux in seasonal evolutions of sea surface temperature in the tropical Atlantic Ocean.J.Climate,19,6153-6169.
Liu,Q.Y.,and Y.Q.Lu,2016:Role of horizontal density advection in seasonal deepening of the mixed layer in the subtropical Southeast Pacific.Adv.Atmos.Sci.,33(4),442-451,
10.1007/s00376-015-5111-x.
∗Qinyu LIU
Email:liuqy@ouc.edu.cn
©Institute of Atmospheric Physics/Chinese Academy of Sciences,and Science Press and Springer-Verlag Berlin Heidelberg 2016
杂志排行
Advances in Atmospheric Sciences的其它文章
- Indo-Western Pacific Ocean Capacitor and Coherent Climate Anomalies in Post-ENSO Summer:A Review
- Evaluating the Formation Mechanisms of the Equatorial Pacif c SST Warming Pattern in CMIP5 Models
- Changes in Mixed Layer Depth and Spring Bloom in the Kuroshio Extension under Global Warming
- Historical Change and Future Scenarios of Sea Level Rise in Macau and Adjacent Waters
- The Positive Indian Ocean Dipole-like Response in the Tropical Indian Ocean to Global Warming
- The Southwest Indian Ocean Thermocline Dome in CMIP5 Models: Historical Simulation and Future Projection
