The Southwest Indian Ocean Thermocline Dome in CMIP5 Models: Historical Simulation and Future Projection
2016-11-24XiaoTongZHENGLihuiGAOGenLIandYanDU
Xiao-Tong ZHENG,Lihui GAO,Gen LI,and Yan DU
1Key Laboratory of Physical Oceanography,Ministry of Education,and Key Laboratory of Ocean-Atmosphere Interaction and Climate in Universities of Shandong,Ocean University of China,Qingdao 266100
2Qingdao Collaborative Innovation Center of Marine Science and Technology,Ocean University of China,Qingdao 266003
3State Key Laboratory of Tropical Oceanography,South China Sea Institute of Oceanology, Chinese Academy of Sciences,Guangzhou 510301
The Southwest Indian Ocean Thermocline Dome in CMIP5 Models: Historical Simulation and Future Projection
Xiao-Tong ZHENG∗1,2,Lihui GAO1,Gen LI3,and Yan DU3
1Key Laboratory of Physical Oceanography,Ministry of Education,and Key Laboratory of Ocean-Atmosphere Interaction and Climate in Universities of Shandong,Ocean University of China,Qingdao 266100
2Qingdao Collaborative Innovation Center of Marine Science and Technology,Ocean University of China,Qingdao 266003
3State Key Laboratory of Tropical Oceanography,South China Sea Institute of Oceanology, Chinese Academy of Sciences,Guangzhou 510301
Using 20 models of the Coupled Model Intercomparison Project Phase 5(CMIP5),the simulation of the Southwest Indian Ocean(SWIO)thermocline dome is evaluated and its role in shaping the Indian Ocean Basin(IOB)mode following El Ni˜no investigated.In most of the CMIP5 models,due to an easterly wind bias along the equator,the simulated SWIO thermocline is too deep,which could further influence the amplitude of the interannual IOB mode.A model with a shallow(deep) thermocline dome tends to simulate a strong(weak)IOB mode,including key attributes such as the SWIO SST warming, antisymmetric pattern during boreal spring,and second North Indian Ocean warming during boreal summer.Under global warming,the thermocline dome deepens with the easterly wind trend along the equator in most of the models.However,the IOB amplitude does not follow such a change of the SWIO thermocline among the models;rather,it follows future changes in both ENSO forcing and local convection feedback,suggesting a decreasing effect of the deepening SWIO thermocline dome on the change in the IOB mode in the future.
SWIO thermocline dome,Indian Ocean basin mode,global warming,CMIP5,ENSO
1.Introduction
The tropical Indian Ocean(TIO)is a crucial region for global climate on intraseasonal,interannual and decadal timescales(Schott et al.,2009).In particular,a thermocline dome,located in the Southwest Indian Ocean(SWIO),is important to the local and remote climate.The variation of SST over this region affects local biological production,the activity of tropical cyclones(Xie et al.,2002,2009),the South Asian monsoon onset(Annamalai et al.,2005;Du et al., 2009),and even remote climate by atmospheric teleconnections(Annamalai et al.,2005,2007;Xie et al.,2009,2010b; Du et al.,2011).Besides the several coastal upwelling regions,the SST variation in the SWIO is relatively large in the TIO due to the shallow thermocline.The interannual SST variability cannot be explained by local heat flux,indicating the ocean dynamics are crucial in this region(Klein et al., 1999;Xie et al.,2002;Li et al.,2015b).
Previous studies have investigated this thermocline dome using observations and model simulations(Reverdin and Fieux,1987;Woodberry et al.,1989;McCreary et al.,1993; Yokoi et al.,2008,2009,2012;Du et al.,2014).The local winds in the tropical South Indian Ocean(SIO)have been suggested as being responsible for generating Ekman upwelling and shoaling of the SWIO thermocline with westward propagating Rossby waves(Masumoto and Meyers, 1998,Yokoi et al.,2008).This shallow thermocline induces vertical entrainment that influences SST more effectively, leading to larger interannual variance.On the interannual timescale,the variation in the SWIO is affected by oceanic dynamics(Huang and Kinter,2002;Xie et al.,2002).During an El Ni˜no event,as the deep convection center moves,equatorial Indian Ocean(EIO)easterlies and related anticyclonic wind anomalies appear during boreal autumn to winter in developing years and excite downwelling Rossby wave in the tropical SIO region(Yu et al.,2005).In the boreal spring following El Ni˜no,this downwelling Rossby wave propagates to the SWIO where the mean thermocline is shallow,deepens the local thermocline,and warms SST(Xie et al.,2002).
The ENSO-induced SWIO warming leads to a series of local air-sea interactions that shape the spatiotemporal struc-tures of the Indian Ocean Basin(IOB)mode.In boreal spring,an atmospheric antisymmetric pattern is induced by the SWIO warming:more(less)rainfall with northwesterly (northeasterly)wind anomalies south(north)of the equator (Wu et al.,2008).The wind-evaporation-SST feedback(Xie and Philander,1994)helps sustain this antisymmetric pattern through early summer,operating on the easterly climatological winds(Kawamura et al.,2001;Wu et al.,2008).When the summer monsoon breaks out in May over the North Indian Ocean(NIO),the anomalous northeasterlies warm the SST there,inducing a second warming over the NIO and maintenance of the IOB warming through boreal summer following El Ni˜no(Du et al.,2009).The IOB further affects the climate over the subtropical northwestern Pacific and East Asia via the so-called capacitor effect(Yang et al.,2007;Xie et al., 2009,2010b).
©Institute of Atmospheric Physics/Chinese Academy of Sciences,and Science Press and Springer-Verlag Berlin Heidelberg 2016
Due to the importance of the SWIO thermocline to local and remote climate,there have been numerous studies that have evaluated simulations of the thermocline dome and its interannual variation in coupled general circulation models (CGCMs,Saji et al.,2006;Yokoi et al.,2009;Du et al., 2013;Nagura et al.,2013).Yokoi et al.(2009)found that most models capture the dome structure of the thermocline in the tropical SIO and its annual cycle,but the simulated dome is deeper and more eastward than observed.Nagura et al.(2013)pointed out these biases are related to the easterly wind bias over the EIO.Recently,Li et al.(2015a)reported a common equatorial easterly wind bias along the EIO in CGCMs,which is related to errors in the South Asian summer monsoon.This simulated wind bias leads to a SWIO thermocline that is too deep,influencing the IOB amplitude further(Li et al.,2015b).
TheinterannualSSTvariabilityintheSWIOanditseffect on the TIO climate in CMIP5 models have been evaluated (Du et al.,2013).However,the role of the SWIO thermocline dome in shaping the interannual TIO variability simulation,especially the local air-sea interactions,needs to be examined in detail.Furthermore,the mean states in the TIO, especially that of equatorial wind,change significantly under global warming(Zheng et al.,2010,2013).The responses of the thermocline dome to global warming,as well as its climate effects,should also be examined.
In this paper,we use coupled models from the Coupled Model Intercomparison Project Phase 5(CMIP5)to evaluate the simulation of the thermocline dome and its response to global warming.Compared with observations,the simulated SWIO thermocline is too deep and shifted eastward in most models.The erroneous simulation is related to the easterly wind bias in the EIO,which affects the local Ekman upwelling effect.In addition,the diversity of the SWIO thermocline depth among models further influences the interannual IOB mode and its key attributes.Under global warming, simulation of the thermocline dome deepens in the SWIO due to the weakened Walker circulation and easterly wind trend along the equator in most of the models.However,the changes of the IOB mode do not follow the SWIO thermocline change among the models,due to the changes in ENSO forcing and local convection feedback in the SWIO.
The rest of the paper is organized as follows.Section 2 briefly describes the model simulations and observations used in this study.Section 3 reports the simulation of the thermocline dome and related TIO interannual variability in the CMIP5 models.The responses of the SWIO thermocline to global warming are presented in section 4.Section 5 is a summary.
2.Model simulations and observations
To examine the capability of simulating the thermocline dome and its interannual variability,we use the 20 model outputs from the World Climate Research Program CMIP5 multi-model ensemble organized by the Program for Climate Model Diagnosis and Intercomparison for the Intergovernmental Panel on Climate Change Fifth Assessment Report (Table 1).In this study,two sets of simulations from the 20 CMIP5 models are analyzed(Taylor et al.,2012).We use historical climate experiments(historical run)to examine the simulation of the thermocline dome in the models,and compare them with the+8.5 W m−2Representative Concentration Pathway(RCP8.5)experiments to investigate how the SWIO thermocline and its interannual variability change under global warming.The historical experiments are forced by historical greenhouses gases,aerosols,and other radiative forcing;and the RCP8.5 experiments are run under the radiative forcing reaching~8.5 W m−2near 2100(equivalent to>1370 ppm CO2in concentration).Here,we choose 50 years separately in the 20th(1950-99)and 21st(2045-94) centuries to represent present-day and future climate for our investigation.
To assess the skills of the CMIP5 models in SWIO thermocline dome simulation,we use the observed SST from the National Oceanic and Atmospheric Administration Extended Reconstructed SST version 3b dataset(Smith et al.,2008). The surface wind and precipitation are from the National Centers for Environmental Prediction-National Center for Atmospheric Research atmospheric reanalysis(Kalnay et al., 1996)and the Center for Climate Prediction Merged Analysis of Precipitation(CMAP)(Xie and Arkin,1996),respectively. We also use the ocean temperature from the Simple Ocean Data Assimilation(SODA)product(Carton and Giese,2008) from 1979 to 2010(limited by CMAP and SODA).
In this study,we use the variables averaged from 5◦to 10◦S and 50◦to 80◦E,referred to as the indices in the SWIO dome region.To illustrate the interannual variability,we perform a three-month running average to reduced intraseasonal variability and calculate a 9-year running mean to remove decadal and longer variations,which are also significant over the TIO(Deser et al.,2004).
3.Simulations of the thermocline dome and its effect on TIO interannual variability
This section examines the simulations of the thermocline dome in the CMIP5 models and its roles in the persistence ofIOB warming.We start with the simulation of the thermocline dome in the models and then follow with an investigation of each related attribution of the IOB mode,including local SST variability in the SWIO,the antisymmetric atmospheric pattern associated with the SWIO warming,and the second warming in the NIO during boreal summer.
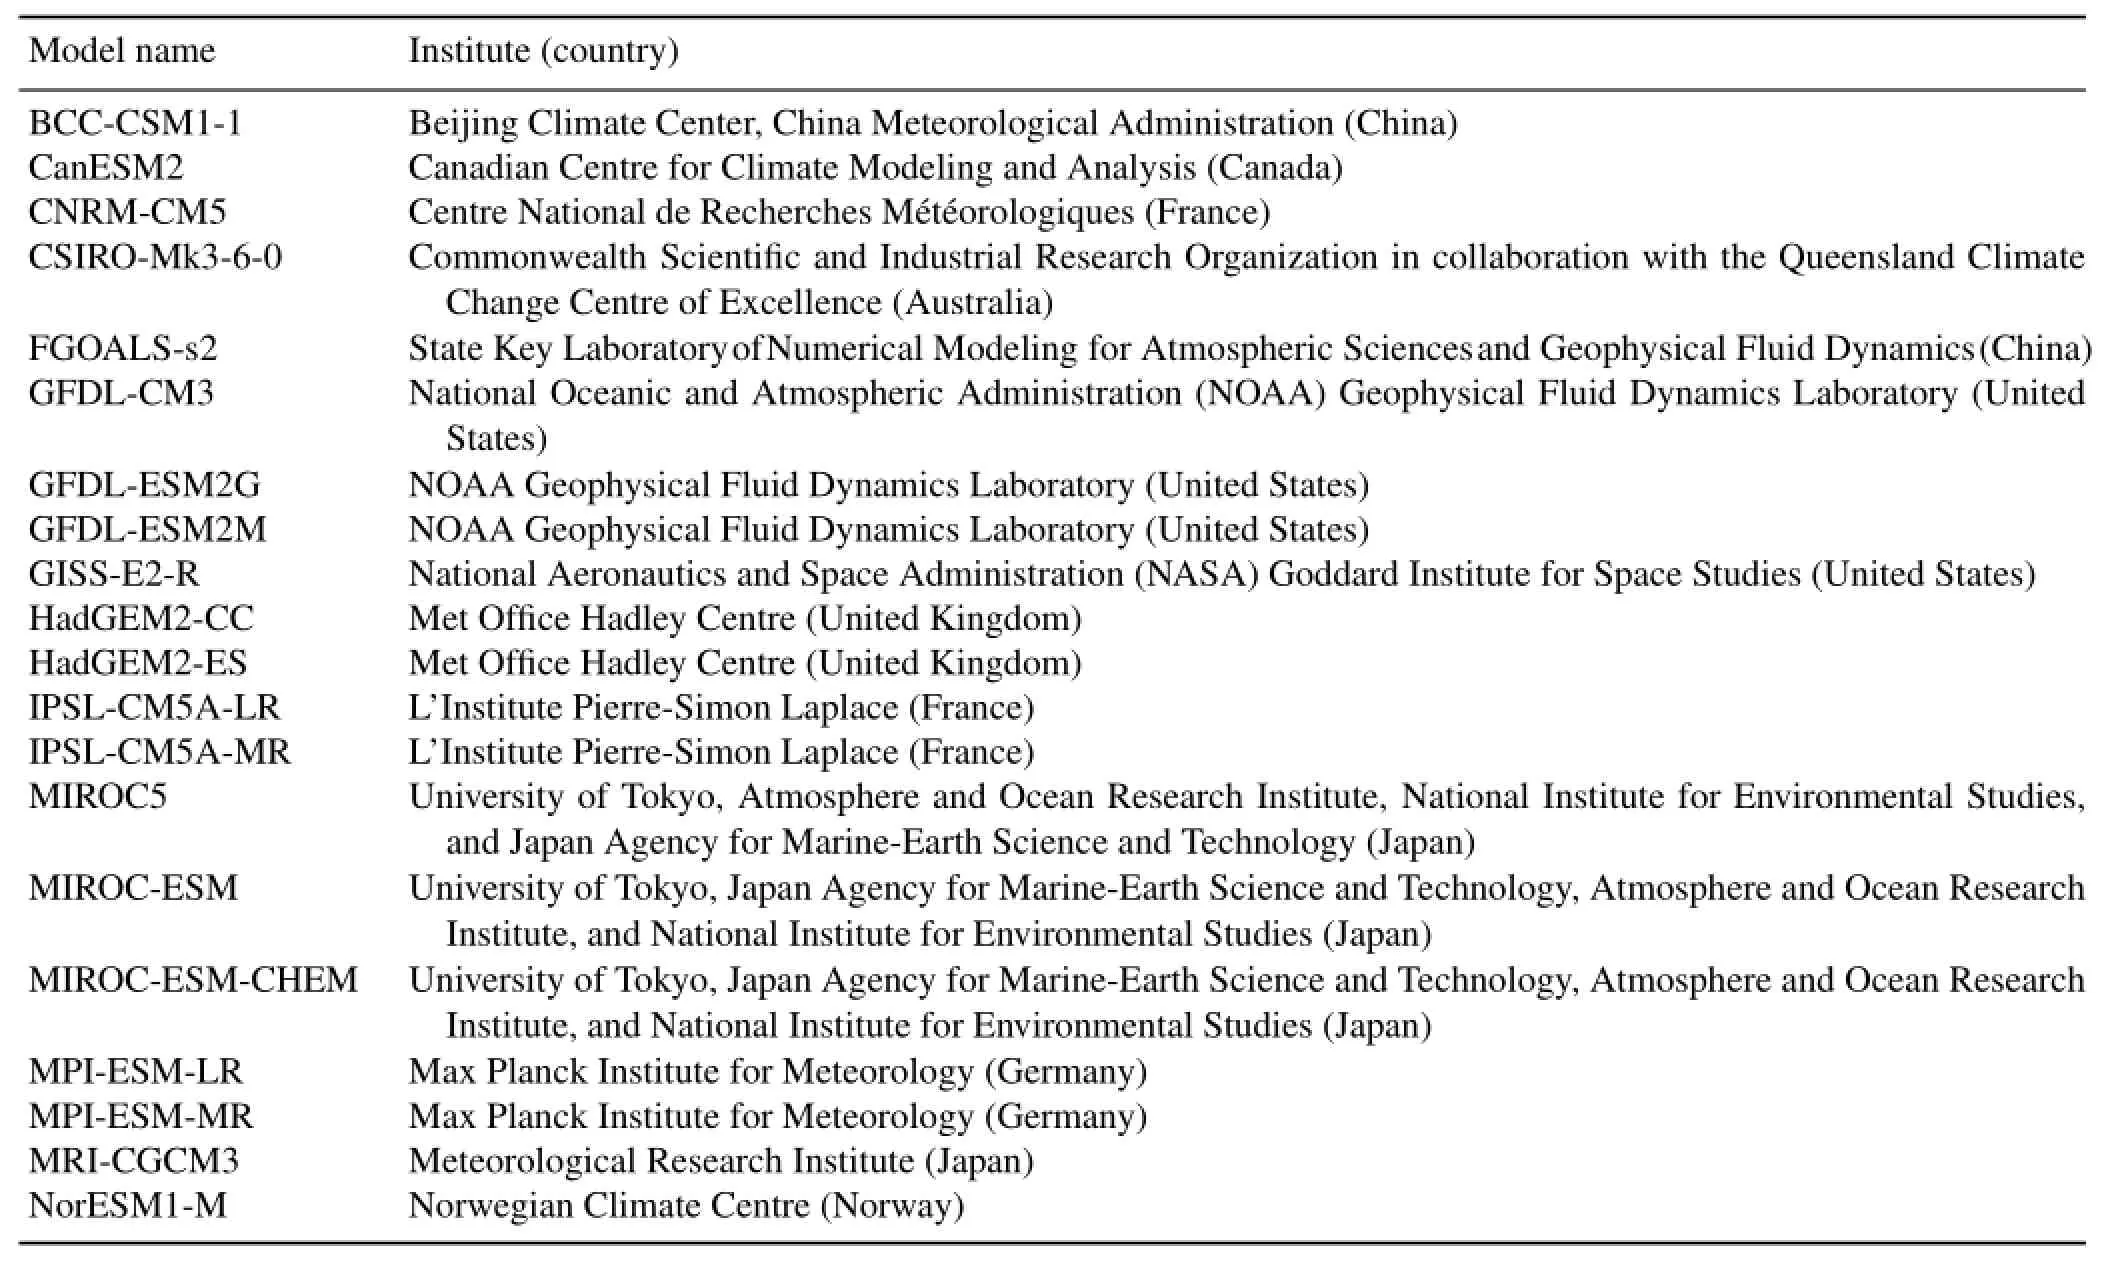
Table 1.CMIP5 models used in this study.
3.1.Thermocline dome simulation in the CMIP5 models
In observations,the thermocline dome is located in the SWIO at approximately(5◦-10◦S,50◦-80◦E)(Xie et al., 2002).Figure 1 shows the climatology(1950-99)of the thermocline depth in the 20th century,represented by the 20◦C isotherm(Z20),in the historical runs of the 20 CMIP5 models and SODA outputs.Most of the CMIP5 models capture the features of the thermocline dome seen in SODA,such as its location and depth.However,as reported in previous studies,there is an eastward displacement bias in the mutli-model ensemble(MME;Fig.1b).This bias mainly appears in six of the models;namely,bcc-csm1-1,CNRM-CM5,GFDLCM3,HadGEM2-CC,HadGEM2-ES and MRI-CGCM3.In addition,compared with observations,the thermocline is too deep in several of the models,such as FGOALS-s2 and MRICGCM3,but too shallow in others,such as CSIRO-Mk3-6-0 and GFDL-ESM2G.In general,simulation of the thermocline depth is too deep in the MME(Fig.2c).The annual mean of Z20 in the SWIO reaches about 94 m,while it is only 83 m in observations.
The thermocline bias in the models is related to that of surface wind,which is crucial for the formation of the dome. Previous studies have suggested that the shallow thermocline in the SWIO is related to the cyclonic wind stress curls over the southern TIO(Xie et al.,2002).Here,we examine the relationship between the surface wind along the EIO and the thermocline depth in the SWIO.Both in the observation and MME,there are upwelling Ekman pumping velocities over the entire tropical SIO region with the thermocline dome in the SWIO(Figs.2a and b).However,there is a pronounced easterly wind bias in the MME over the central EIO(CEIO) region(Fig.2d),which is consistent with previous studies (Cai and Cowan,2013;Li et al.,2015a,b).This corresponds to an Ekman pumping velocity in the SIO that is too weak (Fig.2e),deepening the thermocline in the SWIO(Fig.2c).
The agreement among the simulations of the thermocline depth,zonal wind and Ekman pumping velocity is pronounced in the inter-model analysis.The inter-model scatterplot between zonal wind in the EIO and Ekman pumping velocity over the SIO shows a high correlation at r=0.72 (Fig.3a).Furthermore,the inter-model zonal wind along the equator is also highly correlated with the thermocline depth along the equator at r=−0.59(Fig.3b).These results support the hypothesis of the origin of the deep SWIO thermocline in coupled models(Li et al.,2015b);that is,when the easterly wind bias appears in a model,the simulated thermocline dome tends to be deepened with weakened cyclonic wind curls over the tropical SIO region.
3.2.Thermocline depth and SWIO interannual SST variability
The interannual variability of SWIO SST is largely induced by an oceanic downwelling Rossby wave,which isforced by El Ni˜no(Xie et al.,2002;Du et al.,2009).When propagating to the SWIO during MAM(1),the downwelling Rossby wave suppresses the local entrainment and increases the SST[MAM:March-April-May;numerals in parentheses denote ENSO developing(0)and decay(1)years].This is why the surface heat flux cannot explain the SST warming in this region(Klein et al.,1999;Yokoi et al.,2012).Here, we examine the importance of the SWIO thermocline depth to the local SST variability.Since the SWIO thermocline is too deep in MRI-CGCM3 compared with observations and other models,we exclude MRI-CGCM3 from the following inter-model analyses.
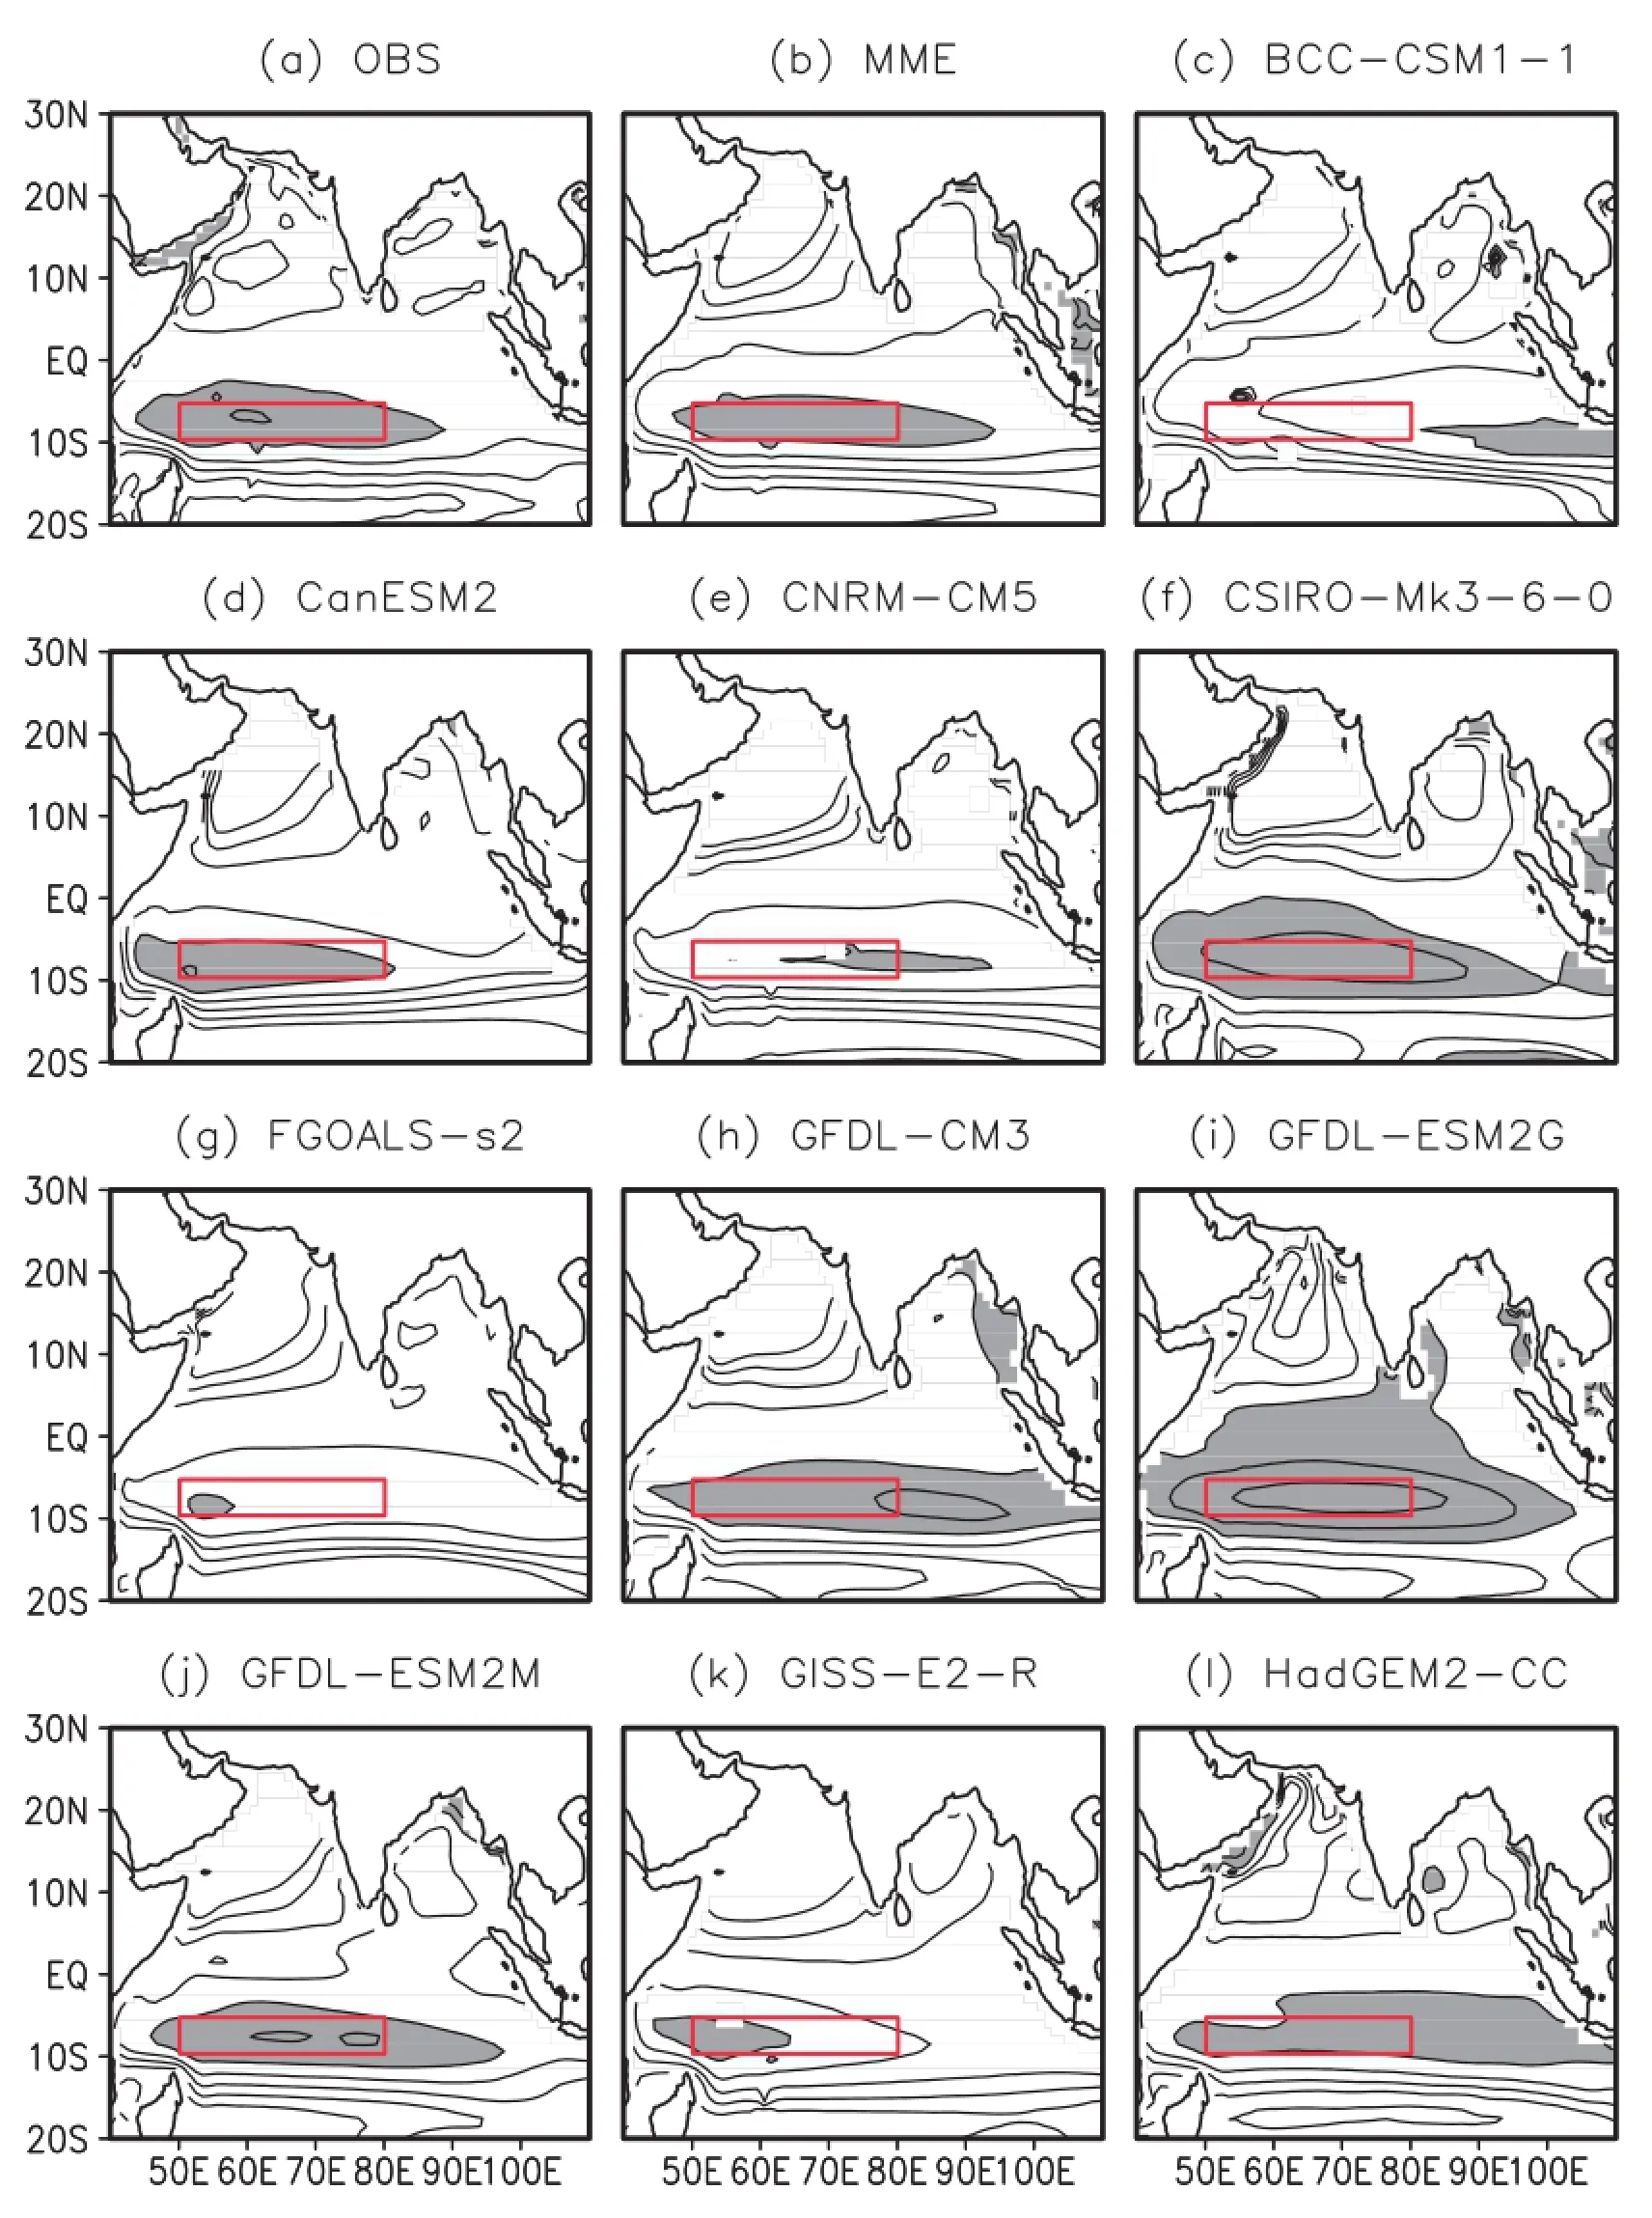
Fig.1.Annual mean Z20(unit:m;gray shading<100)in(a)observations,(b)the MME simulation and(c-v) the 20 CMIP5 model historical runs.Red boxes show the SWIO.
Because the SWIO interannual warming is mainly forced byElNi˜no,theinter-modelamplitudeofSWIOSSTishighly correlated with ENSO amplitude(r=0.76),which is represented by the standard deviation of Ni˜no3.4 SST duringNovember-December-January(NDJ).In addition,the local thermocline depth does indeed influence the SWIO SST variability.As shown in Fig.4a,the correlation of inter-model variability in SWIO SST amplitude with Z20 is−0.39,exceeding the 90%confidence level based on the t-test.Furthermore,the regression of SWIO SST upon Ni˜no3.4 anomalies,R(TSWIO,Ni˜no3.4),is also significantly correlated with thermocline depth(r=−0.48;Fig.4b).This relationship indicates the importance of the SWIO thermocline to local SST variability:when the thermocline is shallow(deep)in the SWIO,ENSO influences the SWIO SST more(less)effectively.
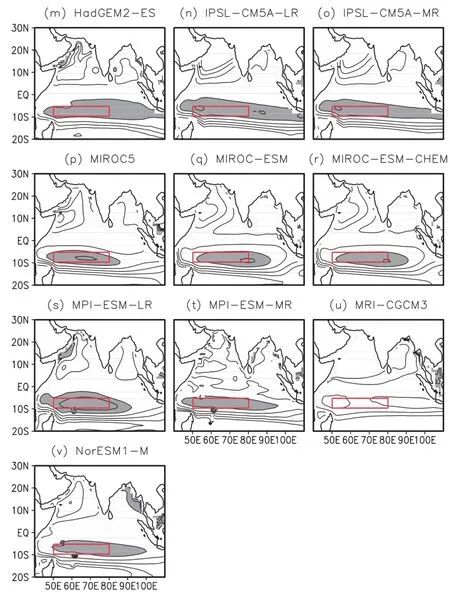
Fig.1.(Continued.)
3.3.Impact of thermocline dome on antisymmetric pattern and the second NIO warming
Following an El Ni˜no event,an antisymmetric atmospheric pattern always appears over the TIO region during boreal spring,with more(less)rainfall and northwesterly(northeasterly)wind anomalies in the southern(northern) TIO.Previous studies have suggested that this antisymmetric pattern is maintained by wind-evaporation-SST feedback (Xie and Philander,1994),with prevailing southeasterly wind in the southern TIO(Kawamura et al.,2001;Wu et al.,2008; Du et al.,2009).The SWIO warming,which is related to the ENSO-induced oceanic downwelling Rossby wave,is important to the antisymmetric wind pattern(Du et al.,2009). This SST warming intensifies local convection and induces a cross-equatorial SST gradient,leading to the antisymmetric precipitation/surface wind pattern due to the Coriolis force acting on the northerly wind crossing the equator induced by SWIO warming.

Fig.2.Annual mean Z20(unit:m;contours),surface wind velocity(units:m s−1;vectors)and Ekman pumping velocity(units:m s−1;color scale)in(a)observations and(b)the MME simulation for the historical run. Dashed contours in(a,b)represent 90 m.The observed(blue line)and MME simulation(red dashed line) of annual mean Z20 in the SIO(averaged in 5◦-10◦S),equatorial zonal wind(averaged in 3◦S-3◦N)and Ekman pumping velocity(averaged in 6◦-9◦S)are shown in(c-e),respectively.The shading in(c-e)shows one standard deviation of inter-model variability.
Here,we perform an EOF analysis of precipitation anomaliesovertheTIOinMAM(1)forobservationsandeach model(Fig.5).As shown in a previous study(Wu et al., 2008),the antisymmetric pattern emerges as the first EOF mode(Fig.5a).About half of the CMIP5 models can reproduce the antisymmetric pattern as the first EOF mode in MAM(Figs.5b-u),consistent with a previous multi-model analysis(Du et al.,2013).The spatial correlation of the first EOF mode in observations with that simulated exceeds 0.6 in 10 of the 20 models(Fig.4c).
SincetheantisymmetricpatternisrelatedtoSWIOwarm-ing,its simulation should also be influenced by the SWIO thermocline in the models.Indeed,we find that the intermodeldiversityofspatialcorrelationishighlycorrelatedwith thermocline depth(r=−0.46),illustrating the importance of the dome on the antisymmetric pattern(Fig.4c).This intermodel relationship indicates that models with a shallower thermocline in the SWIO tend to reproduce a more realistic antisymmetric pattern.Furthermore,the inter-model diversity of the explained variance of the first EOF mode is also significantly correlated with SWIO thermocline depth (r=−0.47),indicating that the models with a deep dome explain fewer of the ENSO-induced precipitation anomalies (Fig.4d).This confirms the role of the dome in the interannual variability of TIO SST,especially in terms of the local air-sea interactions.

Fig.3.Scatterplots of the annual mean CEIO[averaged in(3◦S-3◦N,70◦-90◦E)]zonal wind(units:m s−1)with(a)the Ekman pumping velocity(units:m s−1)over the SIO and(b)the SWIO Z20(unit:m)among observations and 20 CMIP5 models.(c,d)As in(a,b)but for the annual mean SWIO Z20(unit:m)with the standard deviation of TIO SST anomalies (◦C)in MAM and JJA,respectively.The solid line denotes the linear regression.The inter-model correlation and p value are shown in each panel.
When the Indian summer monsoon breaks out in late spring,the antisymmetric pattern,especially the northeasterly anomalies over the NIO(0◦-20◦N,40◦-100◦E),are opposite to the prevailing southwesterly wind and act to warm the ocean,inducing a second warming over the NIO and extending the IOB mode through June-July-August(JJA)following El Ni˜no(Du et al.,2009).But is the dome simulation also related to the NIO SST variability in JJA(1)?Comparing the inter-model variability of NIO SST interannual variance in JJA(1)with SWIO thermocline depth,we find a negative correlation of r=−0.41(Fig.4e).There is also a negative correlation of r=−0.45 between the inter-model regression of NIO SST anomalies upon Ni˜no3.4 index,R(TNIO, Ni˜no3.4),and thermocline depth(Fig.4f),indicative of the SWIO thermocline influencing the second NIO warming in the IOB mode.
According to the above analyses,we find that the dome simulation in the CMIP5 models is important to the IOB warming following El Ni˜no-especially in terms of the local air-sea interactions,including the local interannual SST variability,antisymmetric pattern and the second NIO warming-maintaining the IOB mode to boreal summer.As a result,the diversity of the SWIO thermocline in the models, which is related to the easterly wind bias,truly affects the interannual variability in the TIO(20◦S-20◦N,40◦-100◦E).As shown in Figs.3c and d,the models with a shallower thermocline dome have a stronger interannual variance of TIO SST in MAM and JJA,with−0.47 and−0.40 inter-model correlations,respectively.These results are consistent with Li et al. (2015b),indicating the important role of the dome simulation in TIO interannual variability.
4.Changes of the thermocline dome under global warming
In most models,an easterly wind bias leads to a deep thermocline dome.The diversity of the thermocline depth among the models further influences the IOB amplitude.Coincidentally,the zonal wind in the EIO shows an easterly trend in CMIP5 future projections with a pronounced IOD-like SST warming pattern(Zheng et al.,2010,2013;Cai et al.,2013)(IOD:Indian Ocean Dipole).This change indicatesaweakeningWalkercirculationandarobustresponseto greenhouse gas warming in CGCM projections(Vecchi and Soden,2007).The trend of zonal wind in the EIO influences the subsurface thermal structure by dynamic adjustment.Under global warming,the thermocline shoals significantly in the eastern EIO,whereas it deepens slightly in the western EIO in spite of thermodynamic shoaling effects on the thermocline due to surface warming intensification(Zheng et al., 2013).
Since the Z20 deepens and cannot represent the thermocline depth under global warming,here,we use the depth of maximum temperature gradient(Zmax)to represent the dynamical thermocline,following previous studies(Vecchi and Soden,2007;Zheng et al.,2010,2013).Figure 6a shows the MME mean states of Zmax,SST and surface wind in the TIO for the historical simulation(1950-99).The pattern of the thermocline represented by Zmaxis similar to that of Z20 (Fig.2a),even though the thermocline dome in the SWIO shifts eastward slightly.By contrast,the thermocline dome moves more eastward in RCP8.5 simulations(Fig.6b),showing the importance of zonal wind to the location of the thermocline dome(Nagura et al.,2013).Figure 6c shows the MME mean state changes between the 21st century and 20th century.Consistent with previous studies(Zheng et al.,2010, 2013),theSSTwarmingpatterndisplaysanIOD-likepattern: more warming in the Northwest Indian Ocean and less warming along the Sumatran coast,with an easterly wind trend along the equator.The change of the thermocline is coupled with SST and surface wind,shoaling in the eastern EIO and deepening in the western TIO.
Similar to the effect of equatorial zonal wind on the SWIO thermocline simulation in the models,the SWIO thermocline is influenced by the changes of zonal wind in the CEIO too.We find that,due to the easterly wind trend,the SWIO thermocline deepens slightly in the MME simulation (from 69 to 72 m)and most(13 of 20)of the models,despite a thermodynamic shoaling effect on the thermocline under global warming(Fig.7a).Figure 7b shows the scatterplot of inter-model variability in changes of SWIO Zmaxand zonal wind in the EIO.The changes of Zmaxand zonal wind are highly correlated at r=−0.69,indicating that if there is an easterly wind trend along the equator in a particular model, more(less)than the MME,the SWIO thermocline deepens (shoals)in this model.
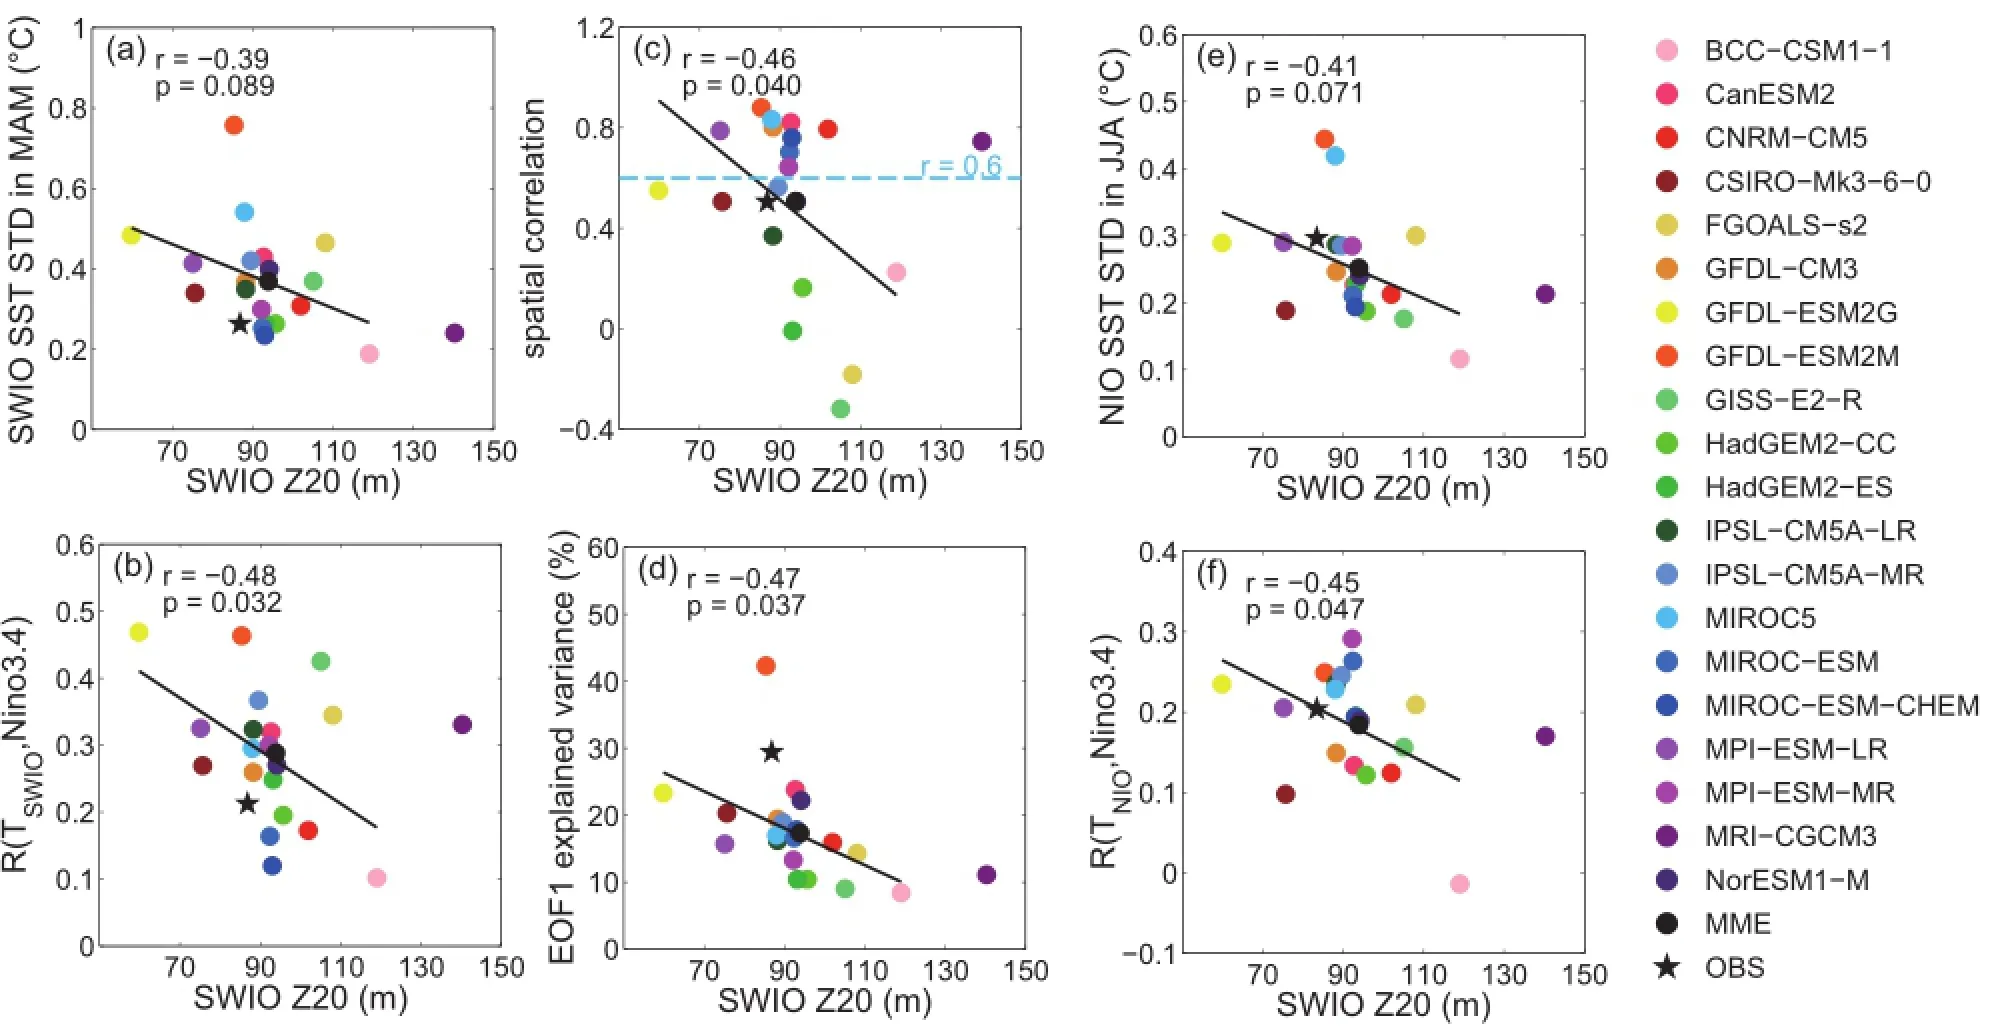
Fig.4.Scatterplots of annual mean SWIO Z20(unit:m)with the(a)standard deviation of SWIO SST anomalies(unit:◦C)in MAM, (b)regression of the MAM(1)SWIO SST upon the NDJ(0)ENSO index,(c)spatial correlation of precipitation EOF1 in observations with each model,(d)explained variance of precipitation EOF1(%),(e)standard deviation of NIO SST anomalies(unit:◦C)in JJA and(f)regression of the JJA(1)NIO SST upon the NDJ(0)ENSO index among observations and 20 CMIP5 models.The solid line denotes the linear regression.The inter-model correlation and p value are shown in each panel.MRI-CGCM3 is excluded from the correlation calculation.
But does the change of the SWIO thermocline influence the amplitude of the IOB mode under global warming?We find that the SWIO SST amplitude and R(TSWIO,Ni˜no3.4) decrease under global warming with the deepening thermo-cline in the MME(Figs.8a and b),indicating a weakened interannual variability in the SWIO.However,the inter-model change in amplitude of SWIO SST,as well as the IOB, does not follow the change in the Zmaxunder global warming among the models.The correlations of the changes in SWIOSSTamplitudeandR(TSWIO,Ni˜no3.4)withthechange in SWIO Zmaxare both insignificant(Figs.8a and b).The changes in amplitude of TIO SST during MAM and NIO SSTduring JJA are also not correlated with the change in Zmaxin the SWIO among the models(Figs.8c and d).This indicates a decreasing effect of the deepening SWIO thermocline on the change in IOB amplitude under global warming.
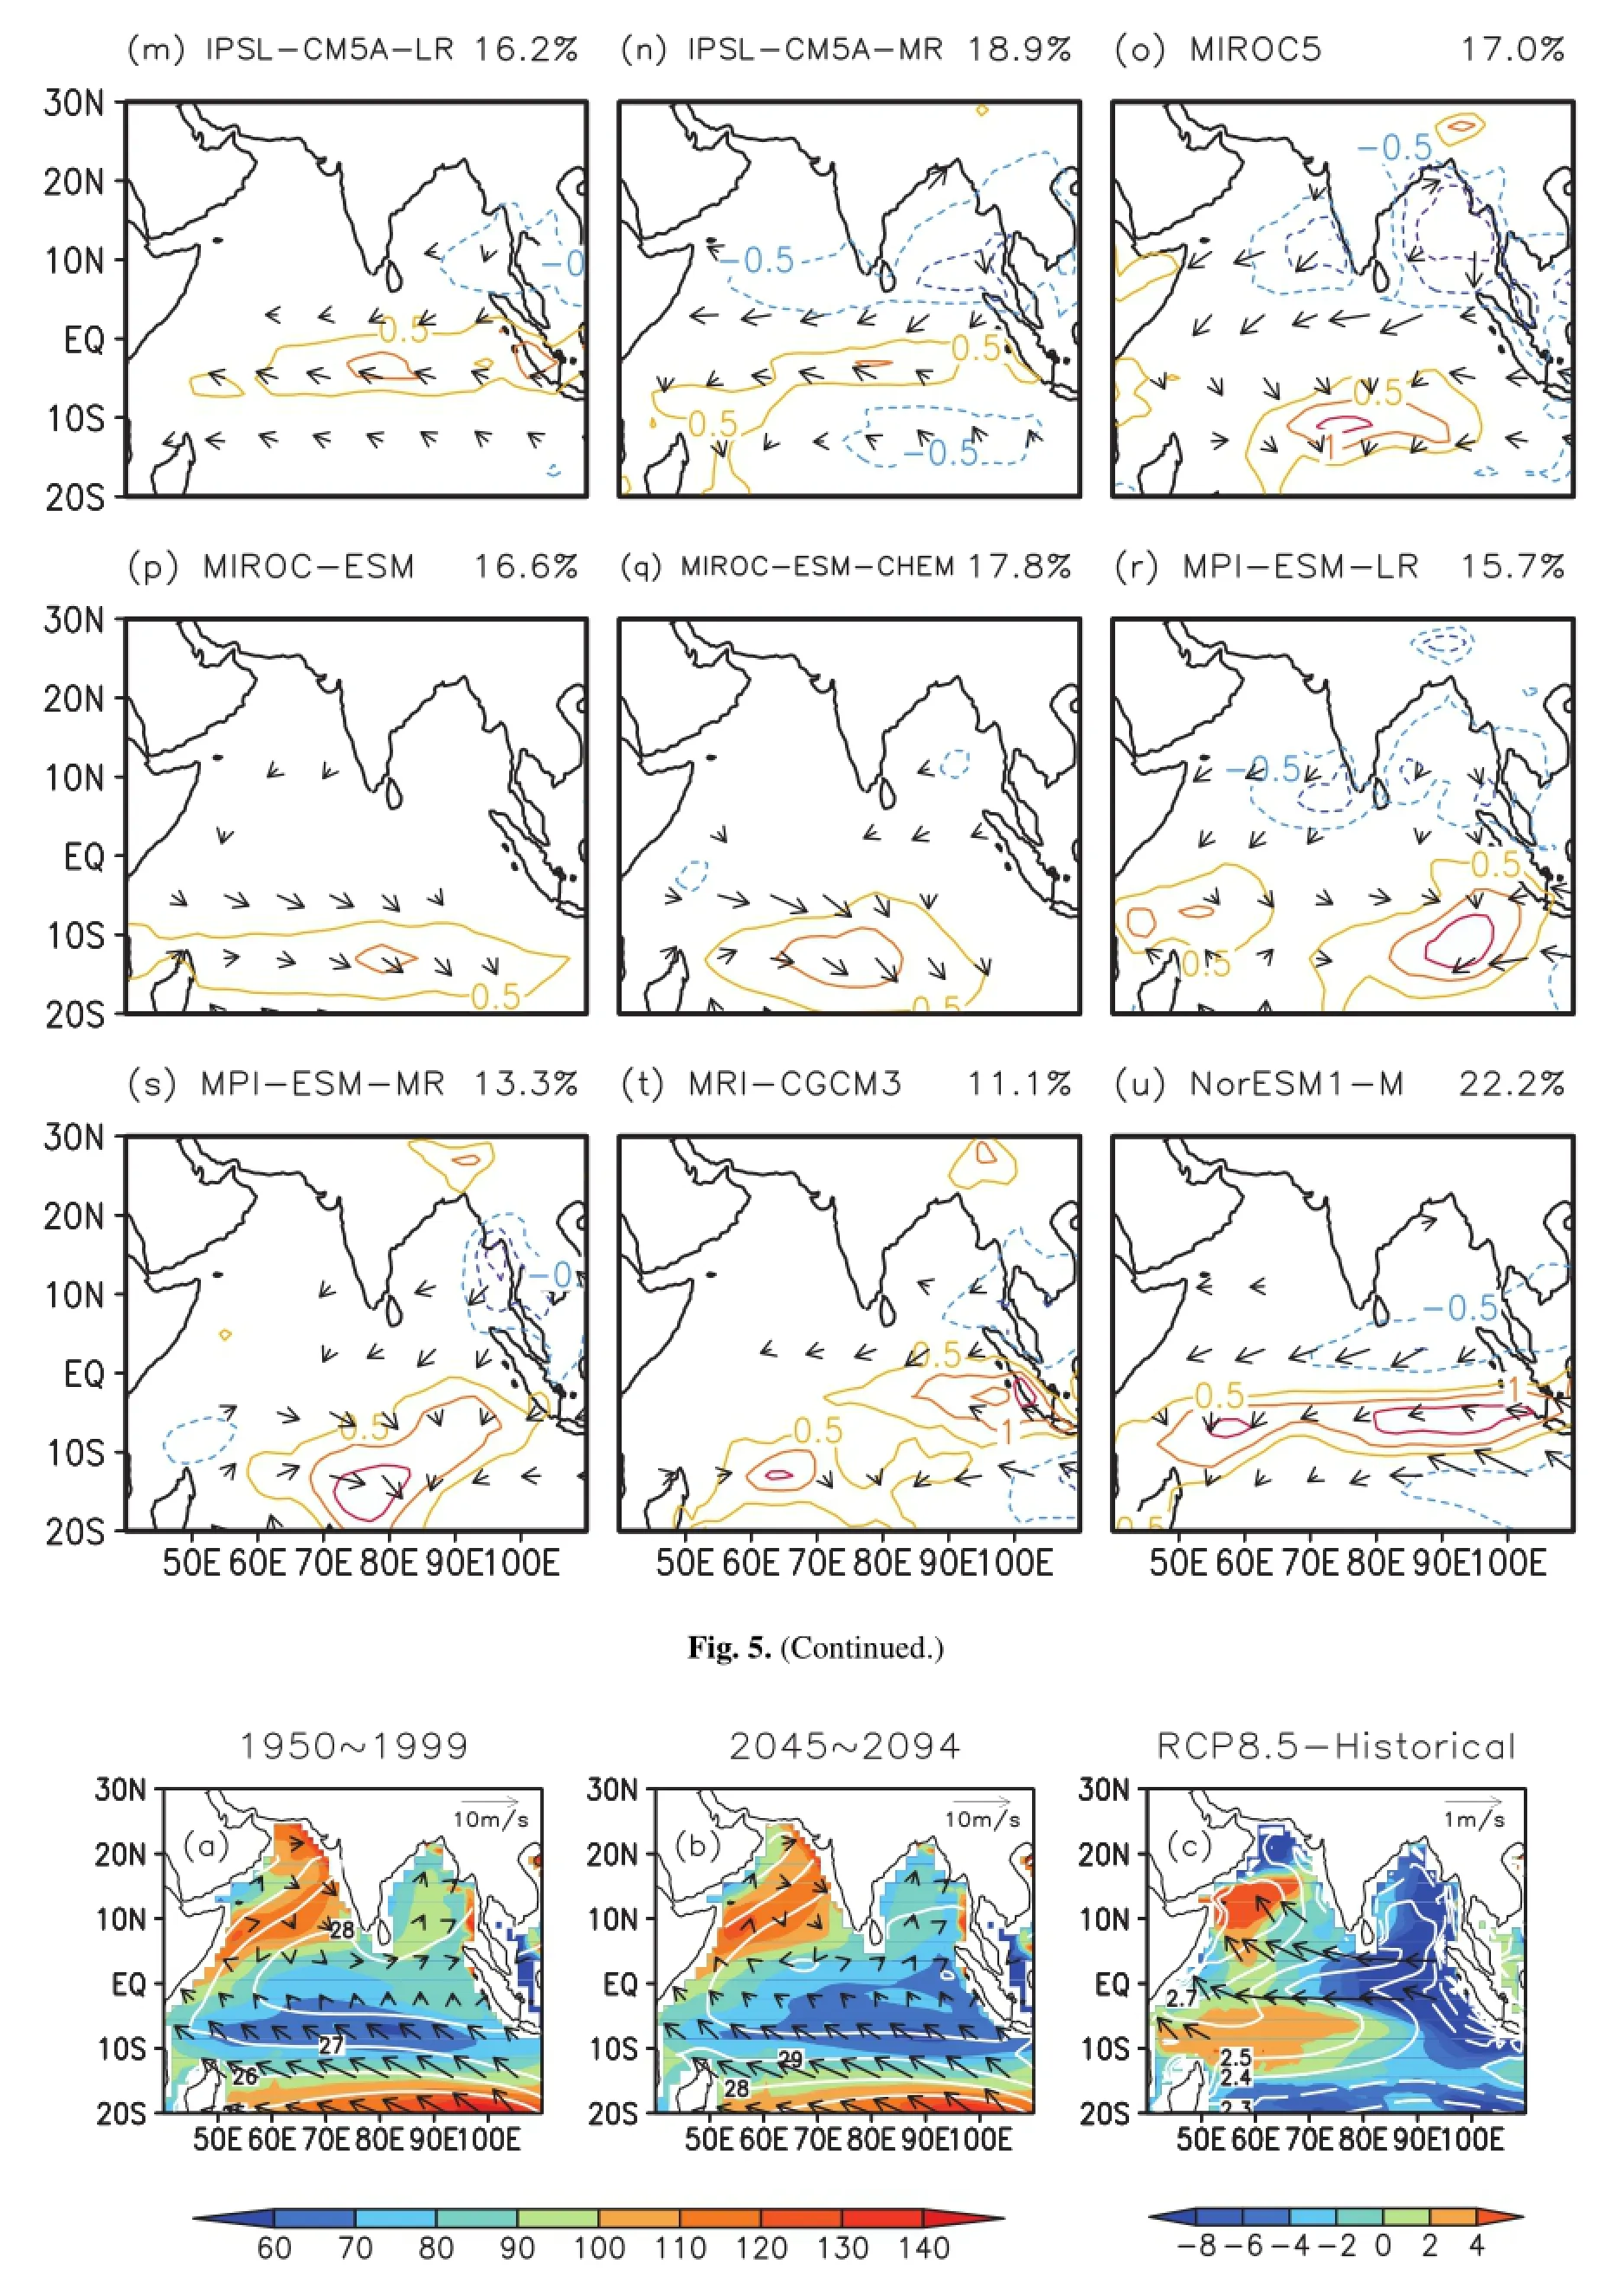
Fig.6.Annual mean states of SST(unit:◦C;contours),Zmax(unit:m;color scale)and surface wind(units:m s−1;vectors)in the(a)historical run,(b)RCP8.5 run,and(c)their differences.
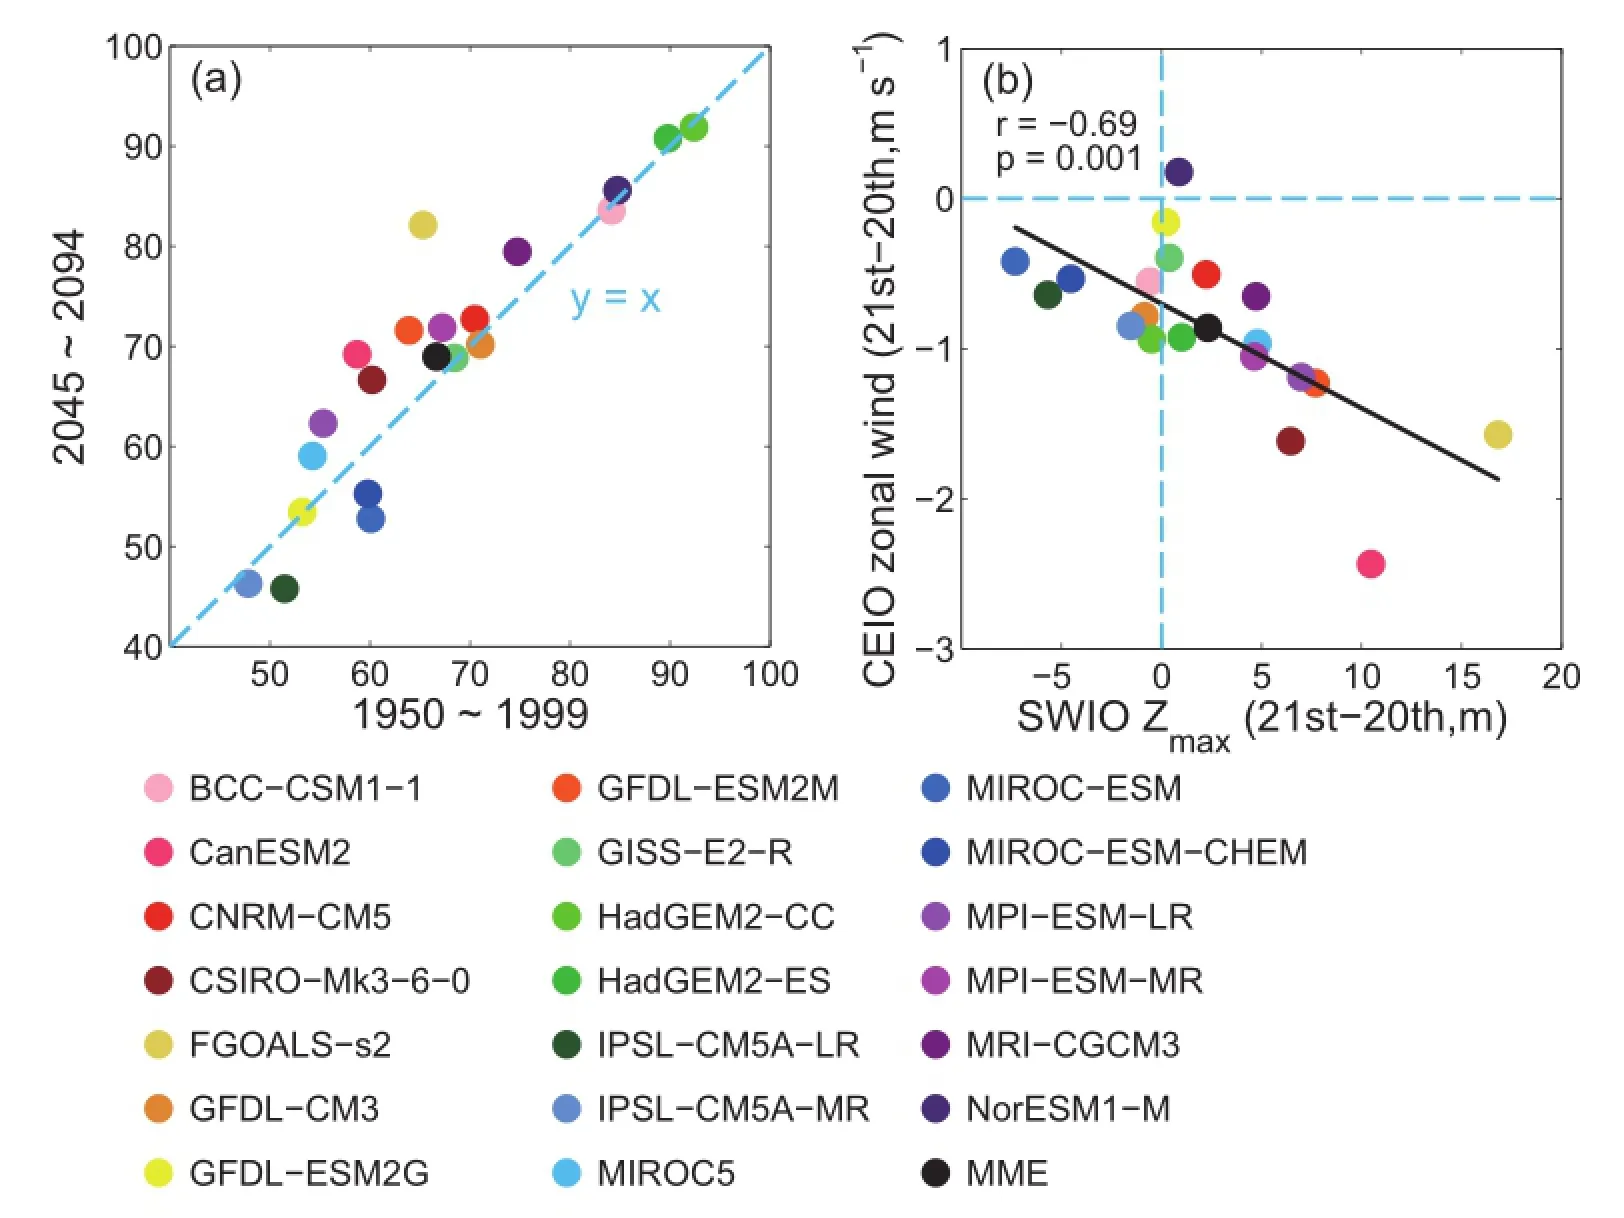
Fig.7.(a)Scatterplot of Zmax(unit:m)between 1950-99 and 2045-94.(b)Scatterplot of Zmax(unit: m)and CEIO zonal wind(units:m s−1)differences between 1950-99 and 2045-94.The solid line denotes the linear regression.The inter-model correlation and p value are shown in each panel.
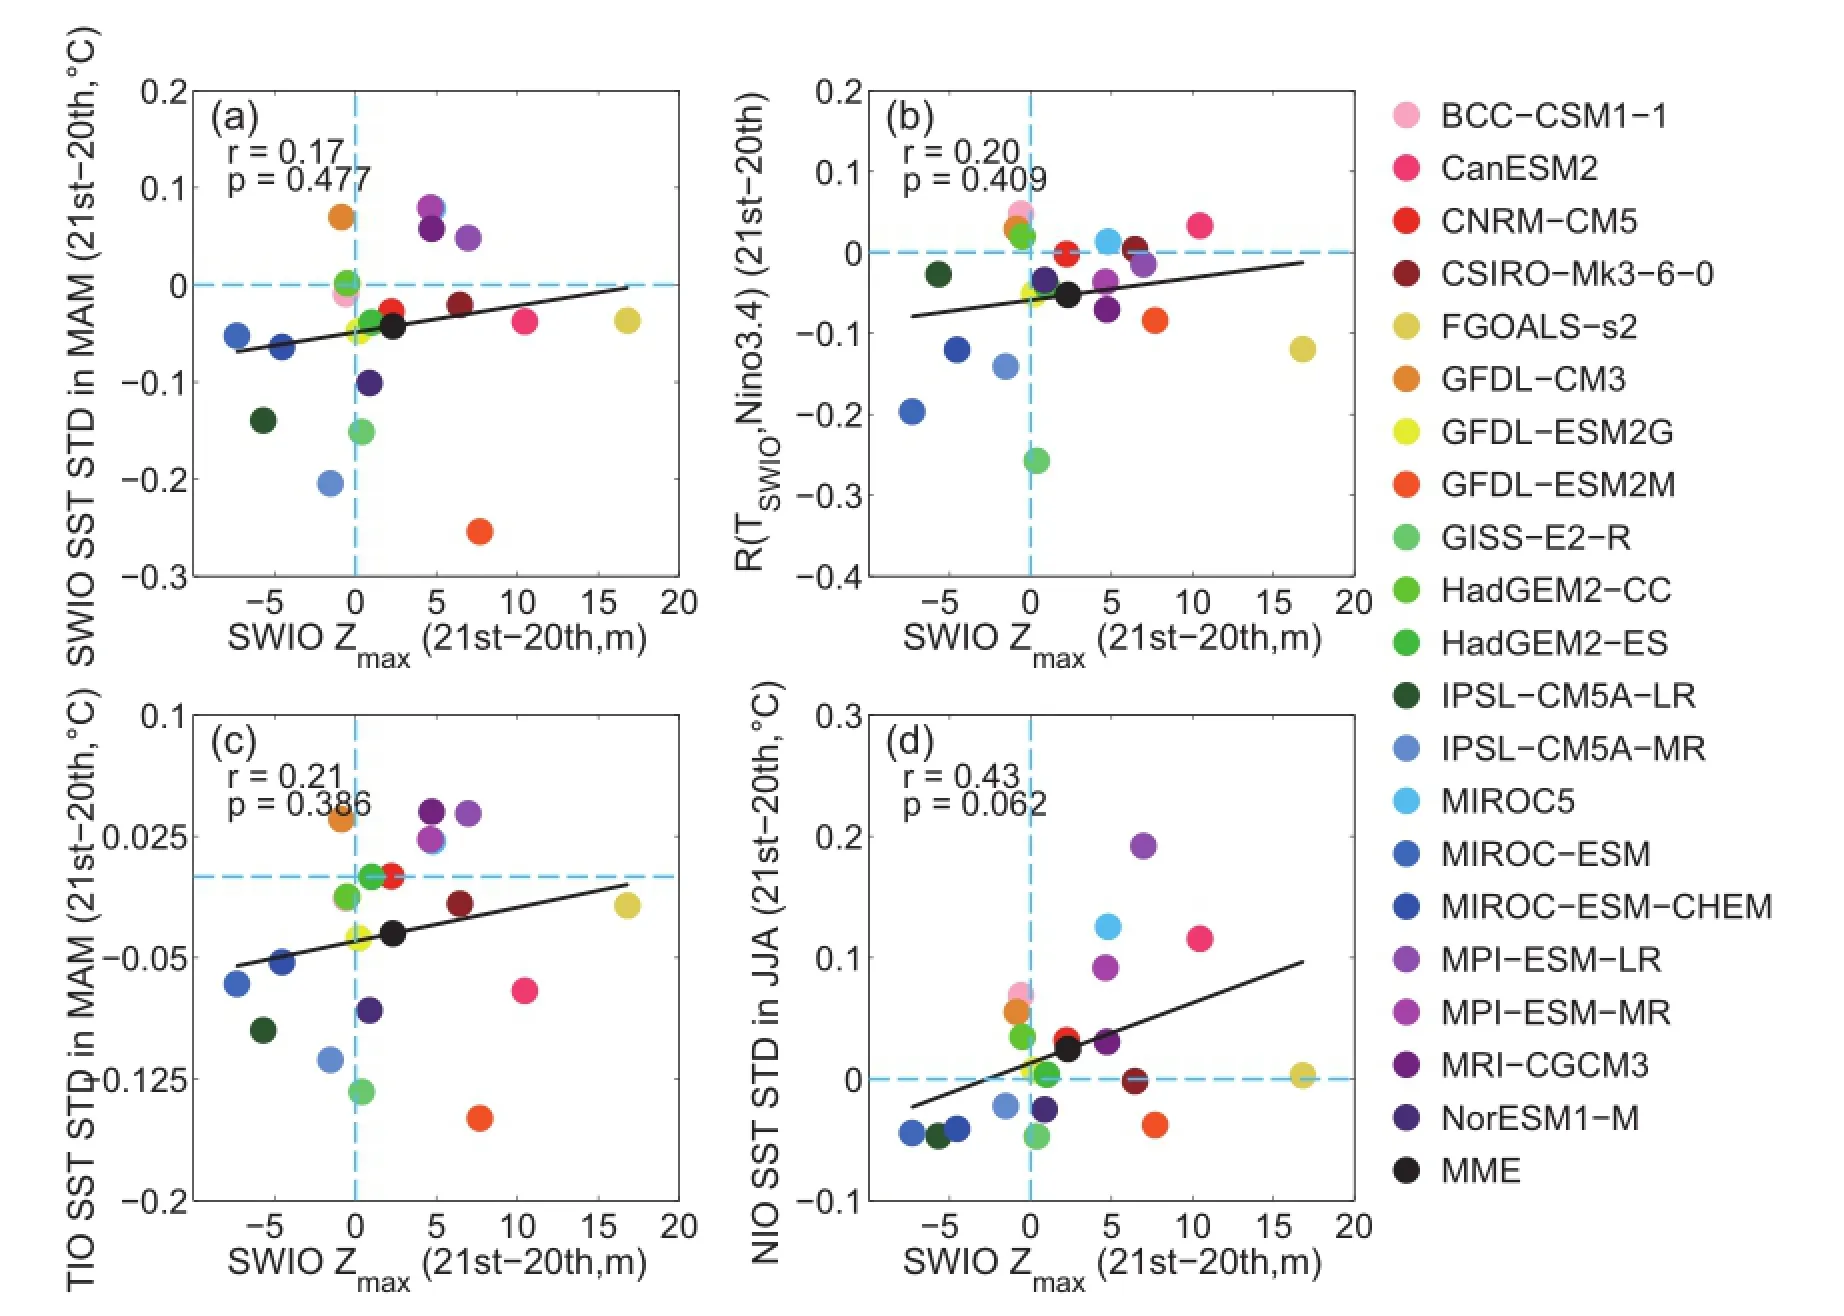
Fig.8.Scatterplots of the Zmaxdifferences(unit:m)between 1950-99 and 2045-94 with that of(a)SWIO SST amplitude(unit:◦C)in MAM,(b)R(TSWIO,Ni˜no3.4),(c)IOB amplitude(unit:◦C)in MAM and(d)NIO SST amplitude(unit:◦C)in JJA.The solid line denotes the linear regression.The inter-model correlation and p value are shown in each panel.
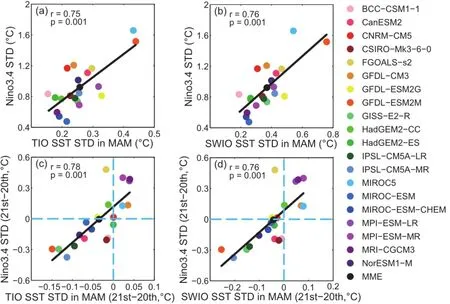
Fig.9.Scatterplots of(a)TIO SST amplitude(unit:◦C)and(b)SWIO SST amplitude(unit:◦C)in MAM with that of ENSO(unit:◦C)in NDJ.(c,d)As in(a,b)but for the differences between 1950-99 and 2045-94.The solid line denotes the linear regression.The inter-model correlation and p value are shown in each panel.
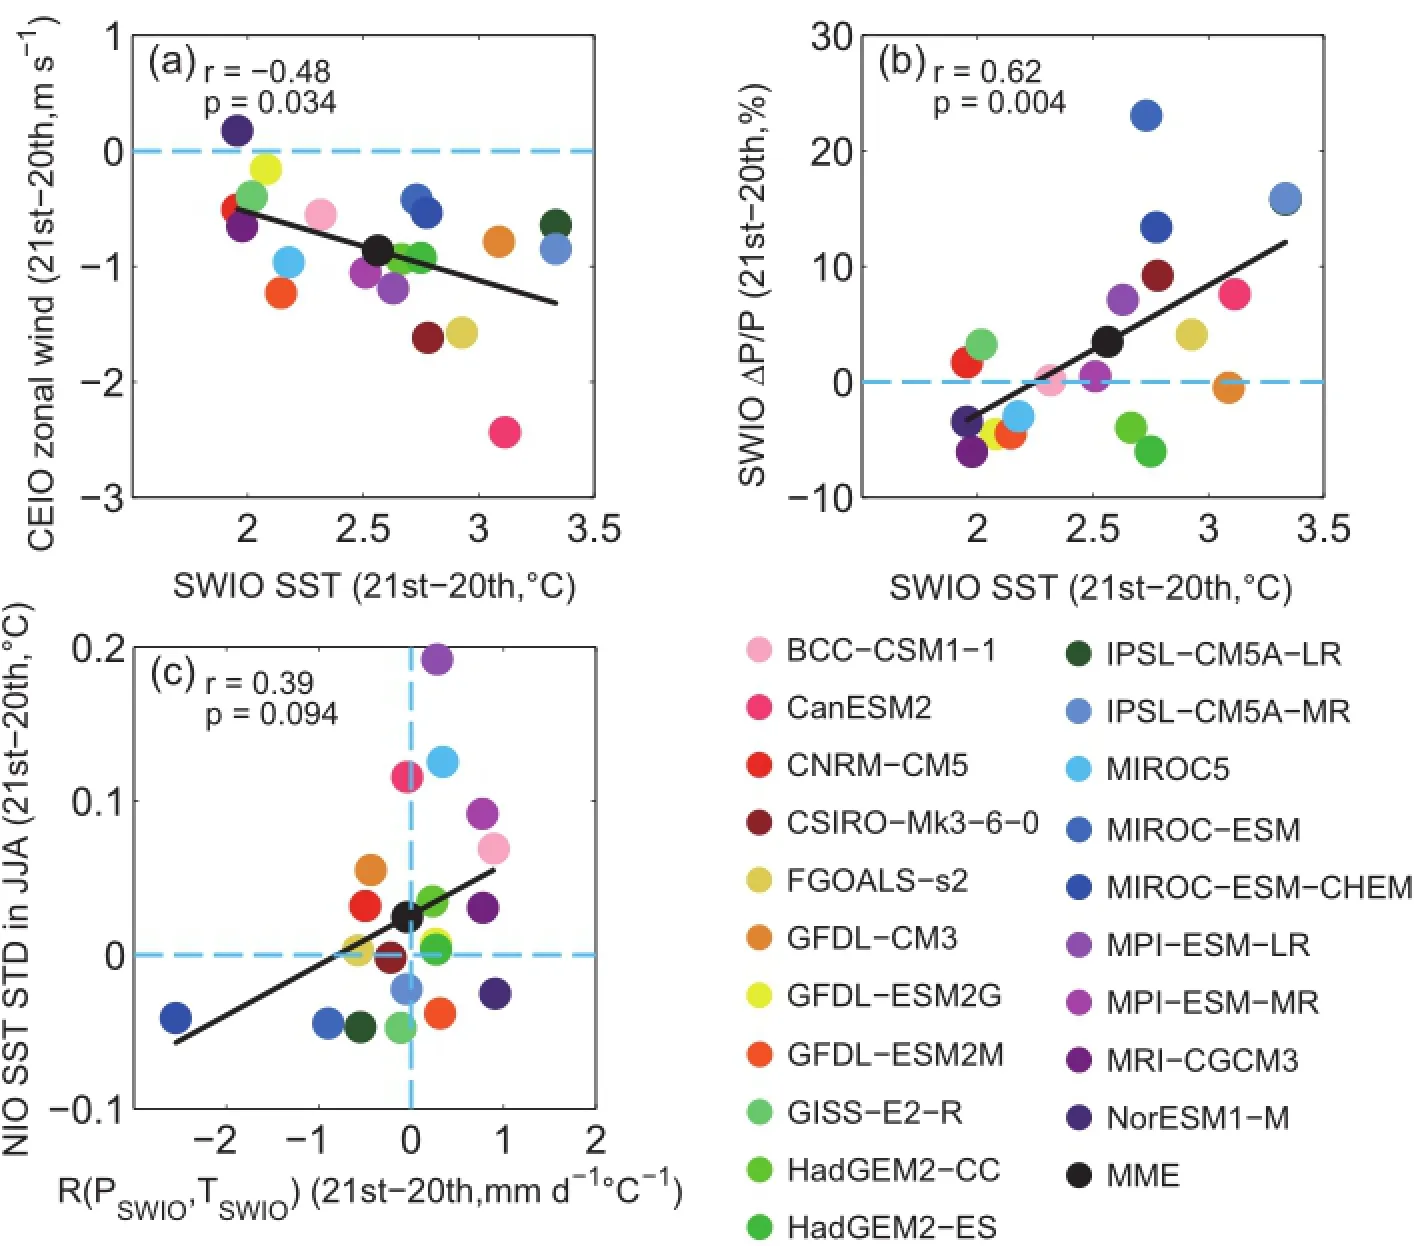
Fig.10.Scatterplot of the SWIO SST warming magnitude(unit:◦C)with(a)the trend of CEIO zonal wind(units:m s−1)and(b)SWIO percentage precipitation change ΔP/P(unit:%)between 1950-99 and 2045-94.(c)Scatterplot of the change in the SWIO convection feedback parameter(units:mm d−1◦C−1)with that of NIO SST amplitude(unit:◦C)in JJA.The solid line denotes the linear regression.The inter-model correlation and p value are shown in each panel.
But why is it that the change in the SWIO thermocline cannot influence the IOB mode in future projections,given the relationship between IOB amplitude and the SWIO thermocline depth in historical simulations?Since the ENSO simulation is closely related with the IOB mode(Du et al., 2013),we first suppose that the change in IOB amplitude is mainly induced by changes in ENSO instead of the SWIO thermocline.Indeed,the ENSO amplitude is highly correlated with TIO and SWIO amplitude in the historical simulation among the models,at r=0.75 and 0.76,respectively (Figs.9a and b).Furthermore,the changes in amplitude of IOB and SWIO SST are also highly correlated with change in ENSO amplitude,at r=0.78 and 0.76,respectively(Figs.9c and d),indicating that the ENSO response to global warming is an effective indicator of the IOB in future projections.Previous studies have suggested that the simulation of ENSO is related to the mean SST bias in the tropical Pacific in coupled models(Wittenberg et al.,2006;Xiang et al.,2012).On the other hand,the mean SST bias in the tropical Pacific identified in previous studies(Li and Xie,2012,2014)could also influence the zonal wind in the EIO via the Walker circulation,further influencing the simulations of the SWIO thermocline dome,as well as the IOB mode.So,the SST bias in the tropical Pacific could affect the IOB mode through two ways: by modulating the ENSO variance,and by changing the zonal windalongtheequatorandtheSWIOthermoclinedepth.The potential inter-basin relationship between the mean state and interannual variability in the Indo-Pacific region needs further investigation.
We also suppose the enhanced air-sea interaction reportedinpreviousstudies(Zhengetal.,2011;Huetal.,2014) is an additional possible explanation for the inconsistency between changes in the SWIO thermocline and IOB amplitude. In addition to influencing the change in the SWIO thermocline,the trend of CEIO zonal wind is also associated with a dipole-like pattern of SST,including an enhanced warming in the SWIO.The inter-model variability in SWIO SST warming also shows negative correlation with the trend of CEIO zonal wind,at r=−0.48(Fig.10a).This enhanced SST warming increases local precipitation following the“warmerget-wetter”mechanism of Xie et al.(2010a),with a high inter-model correlation between SST warming and the percentage precipitation change in the SWIO,at r=0.62(Fig. 10b).The increased precipitation can further intensify the local air-sea interaction.Indeed,the change in SWIO convection feedback represented by the regression of precipitation upon SST,R(PSWIO,TSWIO),is correlated with changes in amplitude of NIO SST(Fig.10c).Hence,the second NIO warming during boreal summer strengthens in the MME and in most(13 of 20)of the models,even though the SWIO thermocline deepens(Fig.8d).This possible strengthening of the atmospheric response counteracts the effect of the deepening thermocline.The total effect of the mean state changes in the SWIO on IOB amplitude under global warming needs further investigation.
5.Summary
In this study,we have investigated the SWIO thermocline dome simulation and its response to global warming based on historical simulations and future climate projections by 20 CMIP5 models.Compared with observations,an easterly equatorial zonal wind bias exists in the MME and most of the models.As a result,the simulated dome in the MME is too deep and east-displaced with a weaker surface wind stress curl over the southern TIO region.This relationship between thesimulatedzonalwindandSWIOthermoclinedepthisalso clear in the multi-model variability:a model with an easterly wind bias in the EIO tends to simulate a SWIO thermocline that is too deep,indicating the importance of equatorial wind simulation to the dome simulation.
Similar to the results of Li et al.(2015b),our inter-model analysis suggests that the dome simulation is important for the interannual amplitude of SST in the TIO during boreal spring and summer.In addition,compared with the Li et al. (2015b)study,our further examination found that the simulatedSWIOthermoclinedepthmodulatesthekeyattributesof the IOB mode.Firstly,the SWIO thermocline depth is correlated with local SST amplitude and R(TSWIO,Ni˜no3.4)during boreal spring.Secondly,the thermocline depth is related to the simulations of the antisymmetric atmospheric pattern in the models.In a model with a shallow(deep)thermocline dome,the first EOF mode of precipitation during MAM(1) explains more(less)interannual variance,and is more(less) similar to that in observations,which shows an antisymmetric pattern across the equator.Thirdly,we also found a close inter-model relationship between the thermocline depth and the second warming in the NIO during JJA(1).These close inter-model relationships suggest that the dome simulation is important to the formation and persistence of the IOB mode following El Ni˜no.Recently,Guo et al.(2015)reported a new type of IOD following El Nino,which is related with the SWIO warming and east-west SST contrast.So,the dome simulation could also influence the IOD simulation in coupled models,which is an idea we plan to investigate in the future.
We also explored the responses of the SWIO thermocline to global warming based on CMIP5 RCP8.5 projections.Because of the weakened Walker circulation and easterly wind trend along the equator under global warming,the dome displaces eastward and the SWIO thermocline deepens slightly in the MME,in spite of a thermodynamic shoaling effect.A close relationship between the changes of the SWIO thermocline depth and equatorial zonal wind among the models confirms the importance of zonal wind to the SWIO thermocline. However,the inter-model variability of thermocline change in the SWIO shows no correlation with changes in amplitude of SWIO SST and the IOB mode,inconsistent with the thermocline depth-IOB amplitude relationship in historical runs.The inter-model diversity of future changes in both ENSO forcing and SWIO convection feedback could be responsible for that in the IOB mode,suggesting a decreasing role of the SWIO thermocline dome in maintaining the IOB mode in the future.
Acknowledgements.We acknowledge the World Climate Research Programme's Working Group on Coupled Modelling,which is responsible for CMIP,and we thank the climate modeling groups for producing and making available their model output.For CMIP, the U.S.Department of Energy's Program for Climate Model DiagnosisandIntercomparisonprovidescoordinatingsupportandleddevelopment of software infrastructure in partnership with the Global Organization for Earth System Science Portals.We wish to thank S. M.LONG for data preparation.This work was supported by the NationalBasicResearchProgramofChina(GrantNos.2012CB955600 and 2015CB954300),the National Natural Science Foundation of China(Grant Nos.41106010 and 41476003),the State Key Laboratory of Tropical Oceanography,Chinese Academy of Sciences(Grant Nos.LTO1206 and LTOZZ1202),and a China Meteorological Public Welfare Science Research Project(Grant No. GYHY201306027).
REFERENCES
Annamalai,H.,P.Liu and S.-P.Xie,2005:Southwest Indian Ocean SST variability:Its local effect and remote influence on Asian monsoons.J.Climate,18,4150-4167.
Annamalai,H.,H.Okajima,and M.Watanabe,2007:Possible impact of the Indian Ocean SST on the Northern Hemisphere during El Ni˜no.J.Climate,20,3164-3189.
Cai,W.J.,and T.Cowan,2013:Why is the amplitude of the Indian Ocean Dipole overly large in CMIP3 and CMIP5 climate models?Geophys.Res.Lett.,40,1200-1205.
Cai,W.J.,X.-T.Zheng,E.Weller,M.Collins,T.Cowan,M. Lengaigne,W.D.Yu,and T.Yamagata,2013:Projected response of the Indian Ocean Dipole to greenhouse warming. Nature Geoscience,6,999-1007.
Carton,J.A.and B.S.Giese,2008:A reanalysis of ocean climate using simple ocean data assimilation(SODA).Mon. Wea.Rev.,136,2999-3017.
Deser,C.,A.S.Phillips,and J.W.Hurrell,2004:Pacific interdecadal climate variability:Linkages between the tropics and the North Pacific during boreal winter since 1900.J.Climate, 17,3109-3124.
Du,Y.,S.-P.Xie,G.Huang,and K.M.Hu,2009:Role of air-sea interaction in the long persistence of El Ni˜no-induced North Indian Ocean warming.J.Climate,22,2023-2038.
Du,Y.,L.Yang,and S.-P.Xie,2011:Tropical Indian Ocean influence on Northwest Pacific tropical cyclones in summer following strong El Ni˜no.J.Climate,24,315-322.
Du,Y.,S.-P.Xie,Y.-L.Yang,X.-T.Zheng,L.Liu,and G.Huang, 2013:Indian Ocean variability in the CMIP5 multi-model ensemble:The basin mode.J.Climate,26,7240-7266.
Du,Y.,J.J.Xiao,and K.F.Yu,2014:Tropical Indian Ocean Basin Mode recorded in coral oxygen isotope data from the Seychellesoverthepast148years.ScienceChinaEarthSciences, 57,2597-2605,doi:10.1007/s11430-014-4956-7.
Guo,F.Y.,Q.Y.Liu,S.Sun,and J.L.Yang,2015:Three types of Indian Ocean dipoles.J.Climate,28,3073-3092.
Hu,K.M.,G.Huang,X.-T.Zheng,S.-P.Xie,X.Qu,Y.Du,and L.Liu,2014:Interdecadal variations in ENSO influences on Northwest Pacific-East Asian summertime climate simulated in CMIP5 models.J.Climate,27,5982-5998.
Huang,B.H.,and J.L.Kinter III,2002:Interannual variability in the tropical Indian Ocean.J.Geophys.Res.,107,3319,doi: 10.1029/2001JC001278.
Kalnay,E.,and Coauthors,1996:The NCEP/NCAR 40-Year reanalysis project.Bull.Amer.Meteor.Soc.,77,437-471.
Kawamura,R.,T.Matsuura,and S.Iizuka,2001:Role of equatorially asymmetric sea surface temperature anomalies in the Indian Ocean in the Asian summer monsoon and El Ni˜no-Southern Oscillation coupling.J.Geophys.Res.,106,4681-4693.
Klein,S.A.,B.J.Soden,and N.-C.Lau,1999:Remote sea surface temperature variations during ENSO:Evidence for a tropical atmospheric bridge.J.Climate,12,917-932.
Li,G.,and S.-P.Xie,2012:Origins of tropical-wide SST biases in CMIP multi-model ensembles.Geophys.Res.Lett.,39, L22703,doi:10.1029/2012GL053777.
Li,G.,and S.-P.Xie,2014:Tropical biases in CMIP5 multimodel ensemble:The excessive equatorial Pacific cold tongue and double ITCZ problems.J.Climate,27,1765-1780.
Li,G.,S.-P.Xie,and Y.Du,2015a:Monsoon-induced biases of climate models over the tropical Indian Ocean with implications for regional climate projection.J.Climate,28,3058-3072.
Li,G.,S.-P.Xie,and Y.Du,2015b:Climate model errors over the South Indian Ocean thermocline dome and their effect on the basin mode of interannual variability.J.Climate,28,3093-3098.
Masumoto,Y.,and G.Meyers,1998:Forced Rossby waves in the southern tropical Indian Ocean.J.Geophys.Res.,103(C12), 27 589-27 602.
McCreary,J.P.,P.K.Kundu,and R.L.Molinari,1993:A numerical investigation of dynamics,thermodynamics and mixedlayer processes in the Indian Ocean.Progress in Oceanography,31,181-244.
Nagura,M.,W.Sasaki,T.Tozuka,J.-J.Luo,S.K.Behera,and T. Yamagata,2013:Longitudinal biases in the Seychelles Dome simulated by 35 ocean-atmosphere coupled general circulation models.J.Geophys.Res.,118,831-846,doi:10.1029/ 2012JC008352.
Reverdin,G.,and M.Fieux,1987:Sections in the western Indian Ocean-variability in the temperature structure.Deep-Sea Res.,34,601-626.
Saji,N.H.,S.-P.Xie,and T.Yamagata,2006:Tropical Indian Ocean variability in the IPCC Twentieth-century climate simulations.J.Climate,19,4397-4417.
Schott,F.A.,S.-P.Xie,and J.P.McCreary Jr.,2009:Indian Ocean circulationandclimatevariability.ReviewsofGeophysics,47, RG1002,doi:10.1029/2007RG000245.
Smith,T.M.,R.W.Reynolds,T.C.Peterson,and J.Lawrimore,2008:Improvements to NOAA's historical merged land-ocean surface temperature analysis(1880-2006).J.Climate,21,2283-2296.
Taylor,K.E.,R.J.Stouffer,and G.A.Meehl,2012:An overview of CMIP5 and the experiment design.Bull.Amer.Meteor. Soc.,93,485-498.
Vecchi,G.A.,and B.J.Soden,2007:Global warming and the weakening of the tropical circulation.J.Climate,20,4316-4340.
Wittenberg,A.T.,A.Rosati,N.-C.Lau,and J.J.Ploshay,2006: GFDL's CM2 global coupled climate models.Part III:Tropical Pacific climate and ENSO.J.Climate,19,698-722.
Woodberry,K.E.,M.E.Luther,and J.J.O'Brien,1989:The wind-driven seasonal circulation in the southern tropical Indian Ocean.J.Geophys.Res.,94(C12),17985-18002.
Wu,R.G.,B.P.Kirtman,and V.Krishnamurthy,2008:An asymmetric mode of tropical Indian Ocean rainfall variability in boreal spring.J.Geophys.Res.,113,D05104,doi:10.1029/ 2007JD009316.
Xiang,B.Q.,B.Wang,Q.H.Ding,F.-F.Jin,X.H.Fu,and H.-J. Kim,2012:Reduction of the thermocline feedback associated with mean SST bias in ENSO simulation.Climate Dyn.,39, 1413-1430,doi:10.1007/s00382-011-1164-4.
Xie,P.P.,and P.A.Arkin,1996:Analyses of global monthly precipitation using gauge observations,satellite estimates,and numerical model predictions.J.Climate,9,840-858.
Xie,S.-P.,and S.G.H.Philander,1994:A coupled oceanatmosphere model of relevance to the ITCZ in the eastern Pacific.Tellus,46,340-350.
Xie,S.-P.,H.Annamalai,F.A.Schott,and J.P.McCreary Jr., 2002:Structure and mechanisms of South Indian Ocean climate variability.J.Climate,15,864-878.
Xie,S.-P.,K.M.Hu,J.Hafner,H.Tokinaga,Y.Du,G.Huang, and T.Sampe,2009:Indian Ocean capacitor effect on Indo-Western Pacific climate during the summer following El Ni˜no.J.Climate,22,730-747.
Xie,S.-P.,C.Deser,G.A.Vecchi,J.Ma,H.Y.Teng,and A.T. Wittenberg,2010a:Global warming pattern formation:Sea surface temperature and rainfall.J.Climate,23,966-986.
Xie,S.-P.,Y.Du,G.Huang,X.-T.Zheng,H.Tokinaga,K.M.Hu, and Q.Y.Liu,2010b:Decadal shift in El Ni˜no influences on Indo-Western Pacific and East Asian climate in the 1970s.J. Climate,23(12),3352-3368.
Yang,J.L.,Q.Y.Liu,S.-P.Xie,Z.Y.Liu,and L.X.Wu, 2007:Impact of the Indian Ocean SST basin mode on the Asian summer monsoon.Geophys.Res.Lett.,34,L02708, doi:10.1029/2006GL028571.
Yokoi,T.,T.Tozuka,and T.Yamagata,2008:Seasonal variation of the Seychelles Dome.J.Climate,21,3740-3754.
Yokoi,T.,T.Tozuka,and T.Yamagata,2009:Seasonal variations of the Seychelles Dome simulated in the CMIP3 models.J. Phys.Oceanogr.,39,449-457.
Yokoi,T.,T.Tozuka,and T.Yamagata,2012:Seasonal and interannual variations of the SST above the Seychelles Dome.J. Climate,25,800-814.
Yu,W.D.,B.Q.Xiang,L.Liu,and N.Liu,2005:Understanding the origins of interannual thermocline variations in the tropical Indian Ocean.Geophys.Res.Lett.,32,L24706,doi: 10.1029/2005GL024327.
Zheng,X.-T.,S.-P.Xie,G.A.Vecchi,Q.Y.Liu,and J.Hafner, 2010:IndianOceandipoleresponsetoglobalwarming:Analysis of ocean-atmospheric feedbacks in a coupled model.J. Climate,23,1240-1253.
Zheng,X.-T.,S.-P.Xie,and Q.Y.Liu,2011:Response of the Indian Ocean basin mode and its capacitor effect to global warming.J.Climate,24,6146-6164.
Zheng,X.-T.,S.-P.Xie,Y.Du,L.Liu,G.Huang,and Q.Y.Liu, 2013:Indian Ocean Dipole response to global warming in the CMIP5 multi-model ensemble.J.Climate,26,6067-6080.
Zheng,X.-T.,L.H.Gao,G.Li,and Y.Du,2015:The Southwest Indian Ocean thermocline dome in CMIP5 models:Historical simulation and future projection.Adv.Atmos.Sci.,33(4),489-503,
10.1007/s00376-015-5076-9.
19 March 2015;revised 27 May 2015;accepted 4 June 2015)
∗Xiao-Tong ZHENG
Email:zhengxt@ouc.edu.cn
杂志排行
Advances in Atmospheric Sciences的其它文章
- Indo-Western Pacific Ocean Capacitor and Coherent Climate Anomalies in Post-ENSO Summer:A Review
- Evaluating the Formation Mechanisms of the Equatorial Pacif c SST Warming Pattern in CMIP5 Models
- Role of Horizontal Density Advection in Seasonal Deepening of the Mixed Layer in the Subtropical Southeast Pacific
- Changes in Mixed Layer Depth and Spring Bloom in the Kuroshio Extension under Global Warming
- Historical Change and Future Scenarios of Sea Level Rise in Macau and Adjacent Waters
- The Positive Indian Ocean Dipole-like Response in the Tropical Indian Ocean to Global Warming
