A decadal abruption of midwinter storm tracks over North Pacific from 1951 to 2010
2016-11-23YANGDongXia
YANG Dong-Xia
Nansen-Zhu International Research Centre, Institute of Atmospheric Physics, Chinese Academy of Sciences, Beijing, China
A decadal abruption of midwinter storm tracks over North Pacific from 1951 to 2010
YANG Dong-Xia
Nansen-Zhu International Research Centre, Institute of Atmospheric Physics, Chinese Academy of Sciences, Beijing, China
Based on 60-year (1951-2010) reanalysis data of the National Oceanic and Atmospheric Administration and extended reconstructed sea surface temperatures, a detailed investigation was conducted to explore the midwinter storm track changes over the North Pacifc. The rootmean-square (rms) of subweekly (2.5-6 days) transient of 300 hPa geopotential height feld was calculated to represent the storm track. A decadal abruption occurred in 1982/1983, according to the Mann-Kendall test result. The frst two Empirical Orthogonal Function (EOF) spatial patterns of the North Pacifc storm track during P1 (1955-1982) and P2 (1983-2010) revealed opposite results: The EOF1 during P1 and the EOF2 during P2 revealed changes of intensity of the midwinter storm track in the North Pacifc, whereas the EOF2 during P1 and the EOF1 during P2 exhibited a southward/northward shift of its central axis. In addition, pronounced diferences in the thermal infuence of the ocean on the storm track during P1 and P2 existed. A strong and sustained ENSO signal contributed to a storm track variation through the westerly jet from1955 to 1982, as the storm track was observed to strengthen and shift equatorward during El Niño events. From 1983 to 2010,an apparent sea temperature frontal zone at approximately 40°N and the associated near-surface baroclinicity resulted in the organization of a prominent mid-latitude storm track throughout the depth of the troposphere.
ARTICLE HISTORY
Revised 14 March 2016
Accepted 17 March 2016
Storm track; midwinter;
EOF; ENSO; oceanic front;baroclinicity
风暴轴作为中纬度天气尺度瞬变涡动最强烈的区域,在中纬度天气和气候系统中扮演着至关重要的角色。本文通过Butterworth带通滤波、EOF分析及合成分析等气象统计方法,探究了1951-2010年北太平洋深冬(1月份)风暴轴的年代际变化及可能影响机制。根据Mann-Kendall突变检验结果,风暴轴在1982/1983左右有明显的年代际突变,突变前后EOF分布基本类似。P1时期(1955-1982年),热带西太平洋强烈且持续的ENSO信号通过西风急流来影响风暴轴,即在厄尔尼诺年间,风暴轴中心强度明显增强且向赤道方向移动,拉尼娜年恰好相反。P2时期(1983-2010年),位于风暴轴入口处的中纬度海洋锋区,由于其南北两侧感热通量的不同,引起局地近地层斜压增长,风暴轴强度增强。
1. Introduction
One of the primary features of middle and high latitude atmospheric circulation is transient variability. In the 1970s, Blackmon (1976) frst defned a 2.5-6-day synoptic transient eddy region over the ocean as a ‘storm track.' Since then, both observational research and theoretical study have revealed the importance of the storm track in the forecasting of cold air outbreaks at mid-latitude,its feedback to the time mean fow, and the momentum transport between the tropical and high-latitude atmosphere (Christoph, Ulbrich, and Speth 1997; Chang, Lee, and Swanson 2002; Chen et al. 2013; Zhu, Yuan, and Chen 2013;Gu et al. 2013).
Using a stationary wave model and an idealized global circulation model, Chang and Guo (2007) conducted experiments to determine that enhanced tropical heating forces a stronger and narrower Pacifc jet and storm track. Orlanski (2005) used a high-resolution non- hydrostatic model with explicit convection to simulate the Pacifc storm track (PST) and its sensitivity to tropical sea surface temperatures (SSTs) and natural variability. It is revealed that the storm track variability and its feedback to the quasi-stationary circulation were shown to depend on mid-Pacifc baroclinicity, which is controlled by tropical SST and the strength of the upstream seeding. Chang,Lee, and Swanson (2002) summarized the relationship between the ENSO cycle and the large shifts in stormtrack structure. On the interannual timescale, the PST shifts equatorward and downstream during the El Niño years,apparently in response to the local enhancement of the Hadley circulation over the eastern Pacifc (Bjerknes 1966;Zhou and Wang 2008), while La Niña events mark opposite shifts. On the decadal timescale, Chang and Fu (2002) also observed that even if ENSO-like interdecadal variabilities are removed, the residual storm track data still exhibits signifcant interdecadal variability, which indicates that attributing all of these storm track structural changes to the direct tropical forcing is not appropriate.
Gan and Wu (2013) revealed that the mid-latitude warm(cold) SST anomalies in the preceding fall could remarkably reduce (enhance) the storm track activities in early winter through changes in the tropospheric baroclinicity. He,Deng, and Zhu (2009) determined that the anomalous sea ice area over the southwestern Sea of Okhotsk, together with the associated North Pacifc SST anomaly (SSTA), can exert signifcant infuence on the variability in the strength and extension (contraction) of the PST. However, the sea ice area anomalies over the northeastern Sea of Okhotsk and the associated North Pacifc SSTA primarily afect the strength and South-North movement of the storm track.
In 1992, Nakamura discovered the midwinter suppression phenomenon in which the strength of the midwinter PST in January is weaker than that in autumn or early spring. This suppression occurs despite the fact that the low-level baroclinity and the intensity of the jet stream are strongest in midwinter. He also noted that the baroclinic wave activity over the Pacifc Ocean is positively correlated with the strength of the upper-tropospheric jet for wind speeds up to 45 m s-1(Nakamura 1992). Nakamura and Sampe (2002) further explained the possible efect of the westerly jet on the storm track midwinter suppression. As the East Asian winter monsoon intensifes, eddies with subweekly periods propagating through the mid-latitude tropopause into the storm track tend to be trapped in the jet core, which is 1,000 km from the surface baroclinic zone. The trapping weakens the interaction between the upper-level eddies and baroclinic zone, thus contributing to the midwinter minimum in the eddy activity. An energy analysis (Chen, Zhu, and Yuan 2013) showed in midwinter,with large decreases in the baroclinic energy conversion and barotropic energy conversion, a remarkable net loss in the eddy kinetic energy might lead directly to the midwinter suppression of the North PST.
Thus far, many studies have revealed the interdecadal variations in winter (November-December-January) and midwinter (January) PST. Chang and Fu (2002, 2003) examined the interdecadal changes over 1949-1999 and found there was a remarkable transition during the early 1970s from a weak state prior to 1972/73 to a strong state subsequently. Lee et al. (2012) achieved a consistent conclusion and pointed out that midwinter PST underwent decadal change from a weak regime in the early 1980s to a strong regime in the late 1980s. But the main reason dominating the peaks and valleys at each stage have not yet to be discussed. Therefore, in our study, the temporal and spatial variability of the midwinter storm track over the North Pacifc was explored using the Empirical Orthogonal Function (EOF) method. A signifcant decadal abruption was observed in approximately 1982/1983, and changes in the thermal infuence of the ocean and associated atmospheric circulation are discussed. This paper has certain innovations and provides a basic reference for further study of the midwinter storm track characteristics.
2. Data and methods
2.1. Data
Sixty-year (1951-2010) atmospheric variables, including zonal wind velocity, geopotential height, and air temperature, were obtained from NOAA at a horizontal resolution of 2.5° × 2.5° (Kalnay et al. 1996). SST data were extracted from the Met Ofce Hadley Centre Sea Ice and Sea Surface Temperature version 1 (HadISST1) data-set with a 1° spatial resolution (Rayner et al. 2003).
2.2. Defnition of storm track
A storm track is defned as a region where the subweekly transient disturbance is the most intensive over the oceans. In the Eulerian method, Blackmon (1976) showed that the bandpass-fltered (2.5-6 days) root-mean-square (rms) of geopotential height for the Northern Hemisphere (NH)correspond signifcantly with the locations of maximum synoptic-scale cyclone activity.
Therefore, in this study, we identifed the storm tracks as the rms of subweekly transient of the 300 hPa geopotential height. Subweekly (2.5-6 days) transient fuctuations were derived from the daily 300 hPa geopotential height on the basis of the Butterworth bandpass flter. Then we calculated the Standard Deviation month by month to represent the storm track.
2.3. Eddy growth rate (baroclinicity)
As the synoptic scale disturbance is closely related to the mid-latitude atmospheric baroclinicity, we used the Eddy growth rate index (σ) (Lindzen and Farrell 1980) given by:

where BI means baroclinic instability, f is the Coriolis parameter, V is the horizontal wind speed, z is the vertical depth, and N represents the static stability.
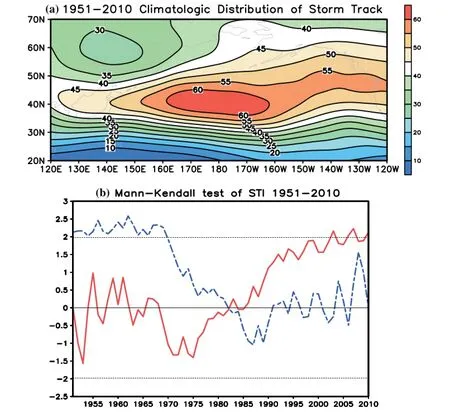
Figure 1.(a) The climatological distribution of the North Pacifc storm track during 1951-2010 (the rms of subweekly transient 300 hPa geopotential height feld). (b) The non-parameter Mann-Kendall test of storm track index (STI).
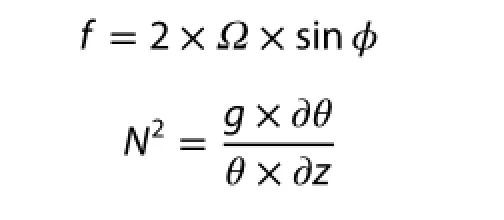
whereΩis the self-rotating angular velocity of the earth,φis latitude, g is the gravity parameter, and θ represents the potential temperature.
3. Results
3.1. Climatological distribution and Mann-Kendall test
Figure 1(a) shows the 60-year climatology of the January storm track (the rms of the subweekly transient 300 hPa geopotential height feld) over the North Pacifc Ocean averaged from 1951 to 2010. The storm track shows a zonal distribution at mid-latitude, with the axis located at 40-45°N, 160°E-160°W. The maximum intensity exceeds 60 gpm in the central zone. To analyze the intensity changes of the storm track, a new storm track index (STI) was defned as a regional average of storm track values over 34-48°N, 150°E-150°W.
A non-parameter Mann-Kendall test method was applied to analyze the trend and abruption of STI during the 60 years. As shown in Figure 1(b), there has been a rising trend of the storm track strength since 1980,as the UF is greater than 0 from this year and reached 1.98 in 2007. The intersection of UF and UB illustrates that an abrupt decadal change occurred in 1982/1983(at a significance level of 0.05). To further explore its changing mechanism, we divided our research scope into two periods: P1 (1955-1982) and P2 (1983-2010)due to this abruption.
3.2. EOF results
The EOF method was used to analyze the main storm track modes in the North Pacifc for the two periods. During P1, the explained variances of the frst two EOF (EOF1 and EOF2) eigenvectors are 18% and 17%, respectively. Similarly, the variances occupied 17% and 15% in P2. This result implies that multiple modes coexisted in the storm track changes in January, due to the transient characteristics of the storm track. More specifcally, the EOF results in the two periods revealed a signifcant diference. The frstspatial pattern during P1 (Figure 2(a)) presented a peak in the heartland, indicating a general increase in the storm track intensity over the central axis. The EOF2 during P1(Figure 2(b)) exhibited a northwest (-)-southeast (+) dipole form distributed on both sides of the climatological storm track axis, refecting the southeastward/northwestwardshift of the central maximum region. During P2, however,the opposite result was observed: the EOF1 demonstrated the southward/northward shift of the maximum region(Figure 2(c)), with the EOF2 refecting intensifed storm track strength around the central axis (Figure 2(d)).
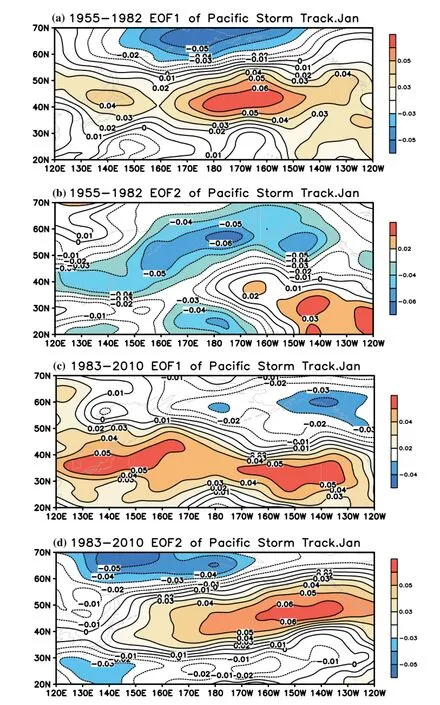
Figure 2.(a) EOF1 and (b) EOF2 of the North Pacifc storm track from 1955 to 1982. (c) EOF1and (d) EOF2 of the 1983-2010 storm track.

Figure 3.(a) The correlation between the January storm track and the contemporaneous SST over the North Pacifc from 1955 to 1982. The shaded regions show the 90% signifcance level. (b) Same as (a) but for 1983-2010.
In general, the spatial modes of the synoptic-scale storm track are less distinctive and stable compared to the EOF results of the large-scale circulation feld due to the highly nonlinear and stochastic processes of transient activities. However, the frst two spatial distributions clearly reveal the intensity changes and southward/northward shift of the storm track maximum region, which prove to be two primary features of the storm track changes. Therefore,we mainly discussed these two characteristics and their mechanisms in following analysis.
4. Correlations of the storm track with thePacific SST
As mentioned in Section 3.1, we divided the STI into 2 stages: P1 (1955-1982) and P2 (1983-2010), according to the Mann-Kendall test result. To explore the potential connection between the storm track strength in January and the SST over the Pacifc, correlations of the preceding and simultaneous Pacifc SST with the STI were calculated separately in P1 and P2
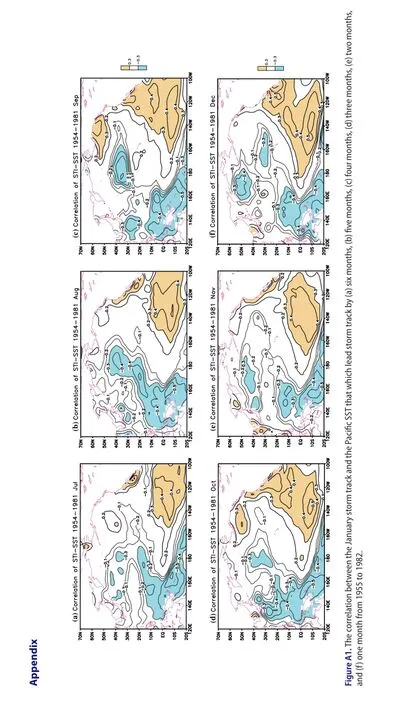
Figure 3(a) shows that the correlations between STI and contemporaneous SST during P1 exceed 0.5 over the equatorial central and eastern Pacifc, which indicates an intense El Niño event. Similarly, the correlations between STI and the Pacifc SST anomalies which lead storm track byone to six months were also calculated. The results are provided in Figure A1 in the Appendix. This result implies that following a strong sustained (at least seven months) signal of El Niño, the central storm track intensity was enhanced. In addition, a signifcant negative correlation coefcient(CC) existed over the Okhotsk Sea and the Western Bering Sea (Figure 3(a)), which suggests that the cooler Okhotsk and western Bering SST might also contribute to the reinforced storm track in January.
During P2, a clear dipole form is presented in Figure 3(b). A signifcant negative CC between STI and Pacifc SST was largely distributed over the Okhotsk Sea and Bering Sea areas, reaching -0.5 in the central regions. On its south side, a smaller signifcant positive CC occurred in the central Pacifc Ocean. This result could suggest that as the Okhotsk and Bering SST decreased and the central Pacifc SST increased, the meridional SST gradient between them was enhanced, forming a tight oceanic frontal zone at approximately 40°N (Sampe et al. 2010). Further explanation will be provided in the next section based on the observations.
Although a similar signifcant negative correlation was discovered over the Okhotsk and Bering seas during two periods, pronounced diferences in the thermal infuence of the ocean on mid-latitude storm track exist. A strong and sustained ENSO signal plays a dominant role in the storm track variation during 1955-1982, while the SST frontal zone in P2 might lead to the formation and maintenance of the storm track.
5. Atmospheric circulation related to the storm track variations
The question arose as to how diferent SST regions in P1 and P2 have a diferent infuence on the storm track intensity. To answer this question, the atmospheric circulation over the North Pacifc was investigated.
Strong El Niño and La Niña years were selected separately due to the great infuence of the ENSO cycle on the storm track during 1954-1981. On the basis of the Oceanic Niño Index (ONI) data from NOAA, years with ONI values greater than 0.5 and lasting for at least fve months were regarded as El Niño years; those with ONI values smaller than -0.5 and lasting for a minimum of fve months were considered La Niña years. Therefore, we selected nine strong El Niño years and eight La Niña years.
The rms of subweekly transient 300 hPa geopotential height feld was averaged over the El Niño and La Niña years. Moreover, the synthetic diference feld was also determined. The storm track shifted equatorward in El Niño events, with the central intensity exceeding 65 gpm(Figure 4(a)). In La Niña years, the strength was 55 gpm in the central zone and the axis marked an opposite shift(Figure 4(b)). The diference feld (Figure 4(c)) showed the same result: the storm track was remarkably strengthened during El Niño years and moved equatorward. Meanwhile,the synthetic diference feld of 200 hPa westerly jet shown in Figure 4(d) illustrates a coordinated variation in correspondence with the storm track changes. The westerly jet in the upper troposphere was conspicuously strengthened over the 20-40°N and shifted equatorward in El Niño years. A strong and sustained ENSO signal contributed to the storm track variation through the westerly jet during 1955-1982.
According to Chang, Lee, and Swanson (2002), the westerly stream intensifes in El Niño years, primarily due to the local enhancement of the Hadley circulation over the eastern Pacifc. In addition, coordinated activities between the westerly jet and the storm track have been proven by several studies (Nakamura 1992; Zhu and Sun 2000a;Harnik and Chang 2004; Han, Ren, and Yang 2007; Ren,Yang, and Chu 2010; Huang and Liu 2011). In general, the storm track intensifes in accordance with the reinforced westerly jet and is normally located on the downstream and equatorward side of the jet axis.
More specifcally, Nakamura and Sampe (2002) proposed that the subtropical jet and polar front jet play different roles in storm track changes. As the subtropical jet develops in some winters, the subweekly eddies tend to be trapped in the jet core, thus acting against the eddy amplifcation. However, Sampe et al. (2010) also proved that a polar front jet is formed and maintained, which is consistent with a SST front and meridional momentum transport (E-P fux) from eddies. An additional detailed mechanism is needed to explain the consistent changes of the westerly jet and storm track during the ENSO cycle in the future.
Based on the correlation results in Section 4, an apparent sea temperature frontal zone forms at approximately 40°N during 1983-2010. The meridional SST gradient averaged between 150°E and 150°W was calculated each year in P2. The strong and weak oceanic front years were selected separately due to the meridional SST gradient averaged from 36 to 44°N. Therefore, we obtained eight strong oceanic front years and six weak front years. The meridional SST gradients and the baroclinicity (eddy growth rate) feldsσthroughout the troposphere were averaged over the strong and weak front years separately. The synthetic diference feld of the storm track was also obtained.
Figure 5(a) illustrates that the peak gradient arrived up to 1.2 °C at approximately 40°N in the strong front years, which is in accordance with the north (+)-south (-)dipole form on the correlation map. Correspondingly, a vigorous near-surface baroclinicity was reinforced above the sharp SST front at approximately 37°N (Figure 5(c)).Meanwhile, the synthetic diference feld of the storm track (Figure 5(e)) exhibited a strengthening trend along the oceanic frontal zone, with an equatorward shift of the core axis.
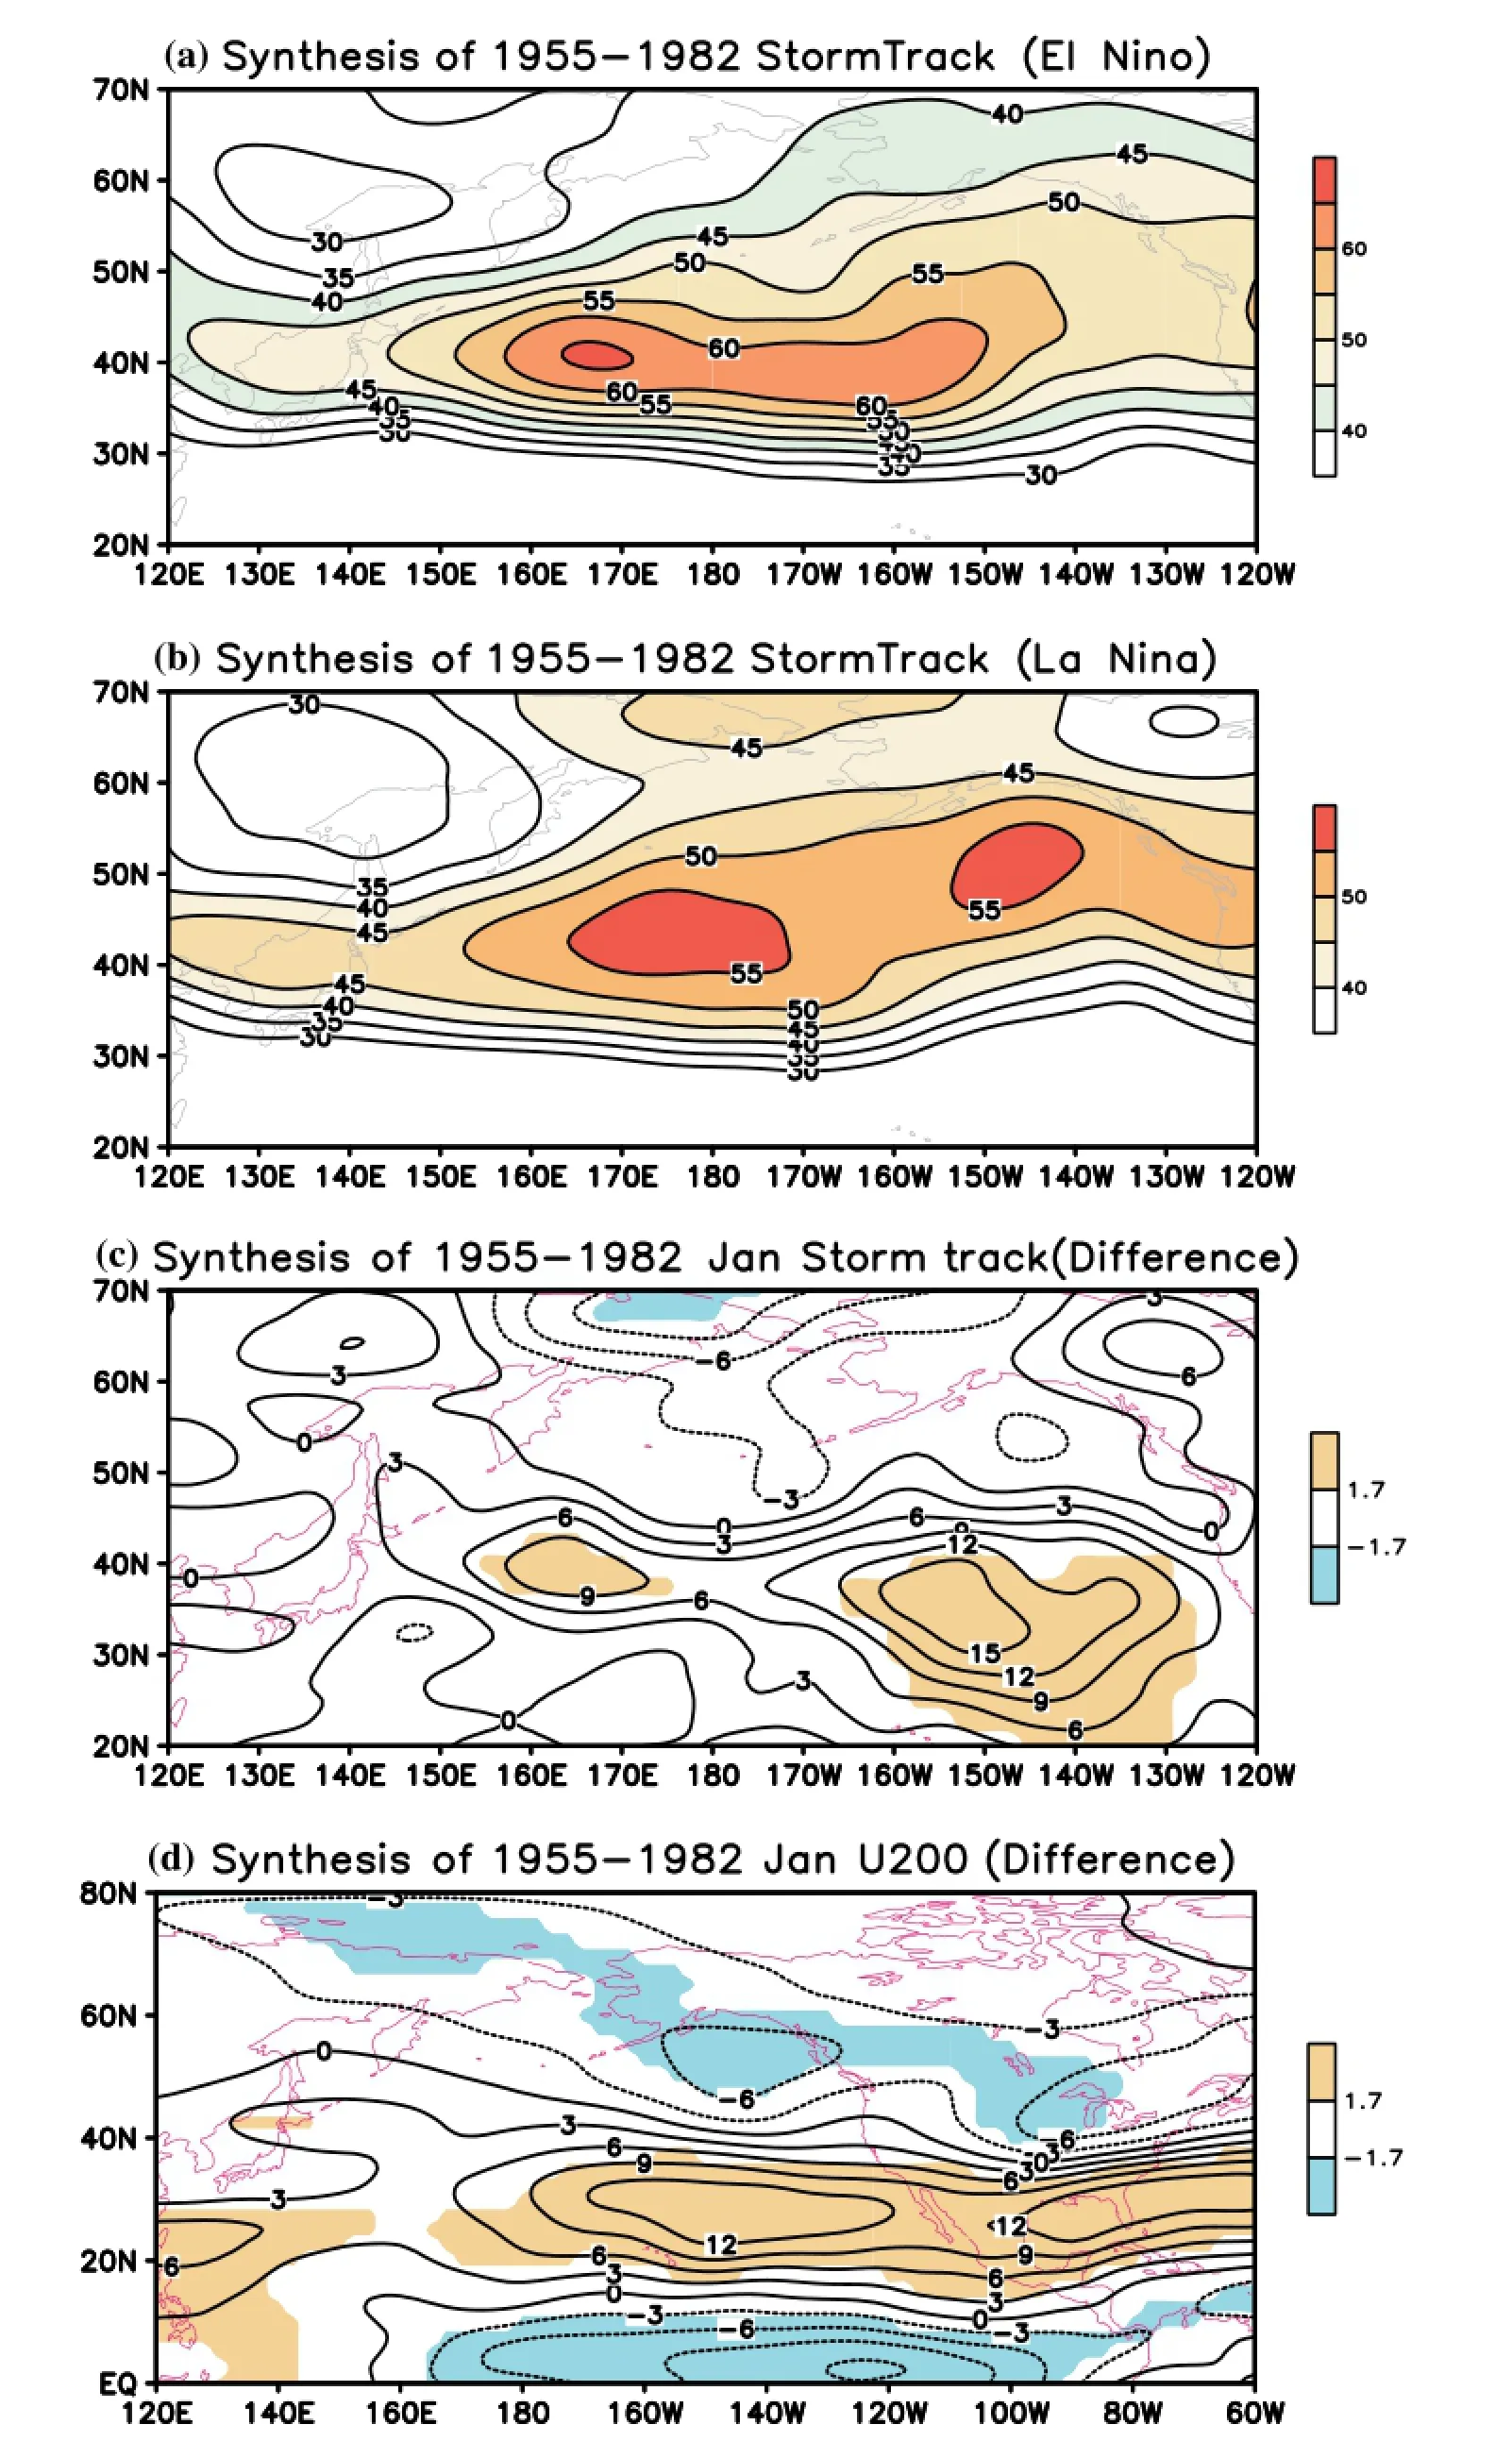
Figure 4.(a) The storm track averaged over eight El Niño years during P1. (b) The storm track averaged over nine La Niña years. (c) The diference between El Niño and La Niña years during P1. (d) The 200 hPa westerly jet diference between El Niño and La Niña years during P1.The shaded regions show the 90% signifcance level.

Figure 5.(a) SST gradient averaged over eight strong front years during P2. (b) Same as (a) but for six weak front years. (c) Baroclinicity throughout the troposphere averaged over eight strong front years during P2. (d) Same as (c) but for six weak front years. (e) Storm track diference between strong and weak front years during P2.The shaded regions show the 90% signifcance level.
The mechanism of the mid-latitude SST front afecting the storm track was explained clearly by Zhu and Sun(2000b), Nakamura et al. (2004) and Sampe et al. (2010). The tight SST gradient maintains the near-surface baroclinicity through the surface sensible heat fux (SHF). Specifcally,at the equatorward fank of the frontal zone, the SST is higher than surface air temperature (SAT), while at its poleward fank, SAT is higher than SST. In correspondence, this results in a peak of surface SHF at the equatorward fank of the front and a sharp decrease of SHF poleward across it. The sharp decline in heat supply leads to the development of near-surface baroclinicity. Therefore, the strong near-surface baroclinicity associated with the SST front enhances baroclinic eddy growth as a whole, leading to the organization of a prominent mid-latitude storm track throughout the depth of the troposphere.
6. Conclusions and remaining questions
In this study, a decadal abrupt change of a midwinter storm track over the North Pacifc was discovered. According to the Mann-Kendall test result, the storm track intensifed from 1980 to 2010, and the signifcant abruption occurred in 1982/1983.To further explore its changing mechanism,we divided the storm track into two periods: P1 (1955-1982) and P2 (1983-2010).
The EOF results in the two periods revealed a signifcant diference. EOF1 of the midwinter storm track in P1 and EOF2 of P2 both indicated changes of intensity in the North Pacifc, whereas EOF2 of P1 and EOF1 of P2 exhibited a southward/northward shift of the central axis. Although the frst two spatial patterns are presented in opposite results and their explained variances are less signifcant than the large-scale circulation feld due to the highly nonlinear and stochastic processes of transient activities,the two distinctive features of the storm track have been clearly revealed. Therefore, these two characteristics were primarily discussed in this paper.
The correlations between the leading and coincident Pacifc SST and STI in P1 and P2 indicate that pronounced diferences in the thermal infuence of the ocean on the storm track exist. A strong and sustained ENSO signal played a dominant role in storm track variation during 1955-1982. The westerly stream intensifed during El Niño events in response to the local reinforcement of the Hadley circulation over the eastern Pacifc. Generally, the storm track intensifed in accordance with the enhancement of the westerly jet and was located at the downstream and equatorward side of the jet core. We could infer that a strong and sustained ENSO signal contributes to storm track variation through the westerly jet.
From 1983 to 2010, an apparent sea temperature frontal zone formed between the Okhotsk Sea and the central Pacifc, maintaining the near-surface baroclinicity through surface SHF. Across-frontal diferential sensible heat supply from the ocean retained an intense near- surface baroclinicity, as is observed along the oceanic frontal zone. Therefore, the strong near-surface baroclinicity associated with the SST front enhanced the baroclinic eddy growth as a whole, leading to the organization of a prominent mid-latitude storm track throughout the depth of the troposphere.
Why the storm track activity in P2 is stronger than in P1 along with the sustained ENSO signal disappearing during P2? Combining the conclusion of Lee et al. (2012), we could infer that the remarkable meridional SST gradient during P2, which is located over storm track entrance area, could intensify the storm track directly through the enhancement of local baroclinic eddy growth. While the strong tropical heating in P1 could only infuence the mid-latitude storm track indirectly through enhancement of Hadley circulation and westerly jet. In addition, some recent discoveries indicate that the subtropical jet and polar front jet play diferent roles in storm track changes. Therefore,further studies are needed to reveal the disappearance of ENSO signal during P2 and the mechanism of how ENSO afects the storm track.
2016年,江西铜业铅锌金属有限公司稀贵金属厂上马银阳极圆盘浇铸机的研制项目,委托由江西铜业集团冶金化工工程有限公司负责研制,经过吸收江西铜业贵溪冶炼厂一车间的浇铸经验,采用液压系统、变频控制系统、遥控操作系统,成功研制出一种新型的银阳极圆盘浇铸机。该浇铸机运行平稳,操作简单强度低,浇铸质量得到保证,银阳极板外观整洁须后续加工处理。
Funding
This research was supported by The National Natural Science Foundation of China [grant number 41421004].
References
Bjerknes, J. 1966. “A Possible Response of the Atmospheric Hadley Circulation to Equatorial Anomalies of Ocean Temperature.” Tellus 18 (4): 820-829. doi: http://dx.doi. org/10.1111/j.2153-3490.1966.tb00303.x.
Blackmon, M. L. 1976. “A Climatological Spectral Study of the 500 Mb Geopotential Height of the Northern Hemisphere.”Journal of the Atmospheric Sciences 33 (8): 1607-1623. doi: http://dx.doi.org/10.1175/1520-0469(1976)033<1607:ACSS OT>2.0.CO;2.
Chang, E. K. M., and Y. F. Fu. 2002. “Interdecadal Variations in Northern Hemisphere Winter Storm Track Intensity.” Journal of Climate 15 (6): 642-658. doi: http://dx.doi.org/10.1175/1520-0442(2002)015<0642:IVINHW>2.0.CO;2.
Chang, E. K. M., and Y. F. Fu. 2003. “Using Mean Flow Change as a Proxy to Infer Interdecadal Storm Track Variability.”Journal of Climate 16 (13): 2178-2196. doi: http://dx.doi. org/10.1175/2773.1.
Chang, E. K. M., and Y. J. Guo. 2007. “Dynamics of the Stationary Anomalies Associated with the Interannual Variability of the Midwinter Pacifc Storm Track-the Roles of Tropical Heating and Remote Eddy Forcing.” Journal of the Atmospheric Sciences 64 (7): 2442-2461. doi: http://dx.doi.org/10.1175/JAS3986.1.
Chang, E. K. M., S. Lee, and K. L. Swanson. 2002. “Storm Track Dynamics.” Journal of Climate 15 (16): 2163-2183. doi: http:// dx.doi.org/10.1175/1520-0442(2002)015<02163:STD>2.0. CO;2.
Chen, L., B. K. Tan, N. G. Kvamsto, and O. M. Johannessen. 2013.“Wintertime Cyclone Activity and Its Relation to Precipitation over China.” Atmospheric and Oceanic Science Letters 6 (5): 387-393. doi: http://dx.doi.org/10.3878/j.issn.1674-2834.13.0041.
Chen, Y. N., W. J. Zhu, and K. Yuan. 2013. “An Energy Analysis of Midwinter Suppression of the North Pacifc Storm Track.” [In Chinese.] Transactions of Atmospheric Sciences 36 (6): 725-733.
Gan, B. L., and L. X. Wu. 2013. “Seasonal and Long-Term Coupling between Wintertime Storm Tracks and Sea Surface Temperature in the North Pacifc.” Journal of Climate 26 (16): 6123-6136. doi: http://dx.doi.org/10.1175/JCLI-12-00724.1.
Gu, P. S., W. J. Zhu, M. Y. Liu, J. Gao, and D. W. Zeng. 2013.“Storm Track Anomaly over the North Pacifc in Winter andIts Relation with Atmospheric Circulation over East Asia.” [In Chinese.] Journal of the Meteorological Sciences 33 (6): 610-618. doi: http://dx.doi.org/10.3969/2012jms.0175.
Han, B., X. J. Ren, and X. Q. Yang. 2007. “Analysis of the North Pacifc Storm Track Anomaly and the Relationship with Zonal Wind.” [In Chinese.] Scientia Meteorologoia Sinica 27 (3): 237-245.
Harnik, N. L., and E. K. M. Chang. 2004. “The Efects of Variations in Jet Width on the Growth of Baroclinic Waves: Implications for Midwinter Pacifc Storm Track Variability.” Journal of the Atmospheric Sciences 61 (1): 23-40. doi: http://dx.doi. org/10.1175/1520-0469(2004)061<0023:TEOVIJ>2.0.CO;2.
He, D. Y., X. L. Deng, and W. J. Zhu. 2009. “Infuence on Northern Pacifc Storm Track of the Okhotsk Sea Ice during Winter.”Marine Science Bulletin 11 (1): 1-12.
Huang, G., and Y. Liu. 2011. “Simulation of the East Asian Subtropical Westerly Jet Stream with GFDL AGCM (AM2.1).”Atmospheric and Oceanic Science Letters 4 (1): 24-29.
Kalnay, E., M. Kanamitsu, R. Kistler, W. Collins, D. Deaven, L. Gandin, M. Iredell, et al. 1996. “The NCEP/NCAR 40-Year Reanalysis Project.” Bulletin of the American Meteorological Society 77 (3): 437-471.
Lee, S. S., J. Y. Lee, B. Wang, K. J. Ha, K. Y. Heo, F. F. Jin, D. M. Straus,and J. Shukla. 2012. “Interdecadal Changes in the Storm Track Activity over the North Pacifc and North Atlantic.” Climate Dynamics 39 (1-2): 313-327. doi: http://dx.doi.org/10.1007/ s00382-011-1188-9.
Lindzen, R. S., and B. Farrell. 1980. “A Simple Approximate Result for the Maximum Growth Rate of Baroclinic Instabilities.”Journal of the Atmospheric Sciences 37 (7): 1648-1654. doi: http://dx.doi.org/10.1175/1520-0469(1980)037<1648:ASARF T>2.0.CO;2.
Nakamura, H. 1992. “Midwinter Suppression of Baroclinic Wave Activity in the Pacifc.” Journal of the Atmospheric Sciences 49 (17): 1629-1642. doi: http://dx.doi.org/10.1175/1520-0469(1992)049<1629:MSOBWA>2.0.CO;2.
Nakamura, H., and T. Sampe. 2002. “Trapping of Synoptic-Scale Disturbances into the North-Pacifc Subtropical Jet Core in Midwinter.” Geophysical Research Letters 29 (16): 8-1-8-4. doi: http://dx.doi.org/10.1029/2002GL015535.
Nakamura, H., T. Sampe, Y. Tanimoto, and A. Shimpo. 2004.“Observed Associations among Storm Tracks, Jet Streams and mid-Latitude Oceanic Fronts.” The Earth's Climate: The Ocean-Atmosphere Interaction Geophysical Monograph 147: 329-346. doi: http://dx.doi.org/10.1029/147GM18.
Orlanski, I. 2005. “A New Look at the Pacifc Storm Track Variability: Sensitivity to Tropical SSTs and to Upstream Seeding.” Journal of the Atmospheric Sciences 62 (5): 1367-1390. doi: http://dx.doi.org/10.1175/JAS3428.1.
Rayner, N. A., D. E. Parker, E. B. Horton, C. K. Folland, L. V. Alexander, D. P. Rowell, E. C. Kent, and A. Kaplan. 2003. “Global Analyses of Sea Surface Temperature, Sea Ice, and Night Marine Air Temperature since the Late Nineteenth Century.”Journal of Geophysical Research 108 (D14): 1063-1082. doi: http://dx.doi.org/10.1029/2002JD002670.
Ren, X. J., X. Q. Yang, and C. J. Chu. 2010. “Seasonal Variations of the Synoptic-Scale Transient Eddy Activity and Polar Front Jet over East Asia.” Journal of Climate 23 (12): 3222-3233. doi: http://dx.doi.org/10.1175/2009JCLI3225.1.
Sampe, T., H. Nakamura, A. Goto, and W. Ohfuchi. 2010.“Signifcance of a Midlatitude SST Frontal Zone in the Formation of a Storm Track and an Eddy-Driven Westerly Jet.” Journal of Climate 23 (7): 1793-1814. doi: http://dx.doi. org/10.1175/2009JCLI3163.1.
Zhou, B. T., and H. J. Wang. 2008. “Relationship between Hadley Circulation and Sea Ice Extent in the Bering Sea.”Chinese Science Bulletin 53 (3): 444-449. doi: http://dx.doi. org/10.1007/s11434-007-0451-2.
Zhu, W. J., and Z. B. Sun. 2000a. “Interannual Variability of Northern Winter Pacifc Storm Track and Its Association with 500 HPa Height and Tropical and Northern Pacifc Sea Surface Temperature.” [In Chinese.] Acta Meteorologica Sinca 58 (3): 309-320.
Zhu, W. J., and Z. B. Sun. 2000b. “Impacts of Kuroshio SSTA on Storm Track over North Pacifc in Winter.” [In Chinese.]Quarterly Journal of Applied Meteorology 11 (2): 145-153.
Zhu, W. J., K. Yuan, and Y. N. Chen. 2013. “Spatial and Temporal Variations in the Eastern North Pacifc Storm Track.” [In Chinese.] Chinese Journal of Atmospheric Sciences 37 (1): 65-80. doi: http://dx.doi.org/10.3878/j.issn.1006-9895.2012.11245.
风暴轴; 深冬; EOF; ENSO;海洋锋区; 斜压增长率
5 November 2015
CONTACT YANG Dong-Xia yangdongxia13@mails.ucas.ac.cn
© 2016 The Author(s). Published by Taylor & Francis.
This is an Open Access article distributed under the terms of the Creative Commons Attribution License (http://creativecommons.org/licenses/by/4.0/), which permits unrestricted use, distribution, and reproduction in any medium, provided the original work is properly cited.
猜你喜欢
杂志排行

Atmospheric and Oceanic Science Letters的其它文章
- Assessment of surface drag coefficient parametrizations based on observations and simulations using the Weather Research and Forecasting model
- A multidecadal oscillation in the northeastern Pacific
- Precipitation responses to radiative processes of water- and ice-clouds: an equilibrium cloud-resolving modeling study
- Cooling effect of urban parks and their relationship with urban heat islands
- Influences of the interannual variability of vegetation LAI on surface temperature
- The link between the Victoria mode in the preceding boreal winter and spring precipitation over the southeastern USA and Gulf of Mexico