Cooling effect of urban parks and their relationship with urban heat islands
2016-11-23YANGPingXIAOZiNiundYEMengShu
YANG Ping, XIAO Zi-Niund YE Meng-Shu
aChina Metrological Administration Training Center, Beijing, China;bInstitute of Urban Meteorology, China Meteorological Administration,Beijing, China;cInstitute of Atmospheric Physics, Chinese Academy of Sciences, Beijing, China
Cooling effect of urban parks and their relationship with urban heat islands
YANG Pinga,b, XIAO Zi-Niucand YE Meng-Shua
aChina Metrological Administration Training Center, Beijing, China;bInstitute of Urban Meteorology, China Meteorological Administration,Beijing, China;cInstitute of Atmospheric Physics, Chinese Academy of Sciences, Beijing, China
It is claimed that open spaces in cities, such as parks, have an urban cooling efect. However, the relationship between urban parks and adjacent districts is still not explicit. In order to clarify the interaction between urban parks and their urban surroundings, this paper takes the Temple of Heaven Park (THP) as an example of a park station and focuses on analyzing the diferences with a nearby urban station. THP is located in the center of Beijing, and the nearest urban station is Tian An Men. It is interesting that the cooling efect of THP reaches a peak and remains stable when its city background urban heat island (UHI) varies within a given range, but becomes unstable when the UHI goes beyond the range. This is called an enhanced cooling efect in this paper. As a result, the UHI intensities (UHIIs) are calculated in order to comprehend the role of the park cooling efect in the urban heating characteristics of Beijing. By comparison with fve other park-district pairs, this paper attempts to identify the causes of the enhanced cooling efect. It is found that six park-district pairs consistently demonstrate a persistently stronger cooling rate during the night, and that the water coverage might be a key factor in enhancing the park cooling efect. Based on further investigation of the infuence of surrounding UHIs on the park cooling efect, it is found that the UHII diferences in park-district pairs show quasi-linear changes within a given range as the UHII of the surrounding district increases.
ARTICLE HISTORY
Revised 12 March 2016
Accepted 8 April 2016
Cooling efect; urban parks;park-district pair; urban heat island
为了揭示城市中公园和其周边城市环境的相互关系,本文以位于北京二环以内的天坛站为例,重点分析天坛站对最邻近城市站(天安门站)的冷岛效应。研究发现,当城市公园中的周边环境热岛强度在一定的范围内变化时,城市公园站的降温作用是比较稳定的,当城市热岛强度超过了某一临界阈值后,公园的降温作用就变得不稳定,本文将这种现象称为“冷岛增强效应”(enhanced cooling efect)。研究中选取了北京城区内六组公园-城市站,进行公园冷岛效应的进一步研究,发现水体、绿地等要素是影响冷岛作用的重要因素。
1. Introduction
One of the most prominent characteristics of urban climates is the urban heat island (UHI) phenomenon (Landsberg 1981; Limor, David, and Evyater 2009;Hausfather et al. 2013), whereby an urban area has a higher air or surface temperature than the surrounding rural area(Ma and Fu 2003; Grimmond 2006). Signifcant UHIs have been observed in large metropolitan regions, with diferences as high as 10 °C (Sakakibara and Owa 2005; Liu and Yang 2009). UHIs have also been detected in small towns in the USA and mainland China (Ren et al. 2007). Previous research shows that UHIs pose many problems for inhabitants of developed cities (Jansson, Jansson, and Gustafsson 2007; Memon, Chirarattananon, and Vangtook 2008).
Urban green spaces are expected to mitigate UHIs(Akbari, Pomerantz, and Taha 2001) and surface water runof. Because of transpiration, greenery plays a significant role in alleviating UHIs by dropping temperature and increasing humidity. Their cooling efects are especially important and they have been regarded as natural resources for city planning (Narita et al. 2002; Sandra,Henrique, and Teresa 2011). The cost for city planning and construction, as well as the ecological efciency of a park,are decided by the controllable factors including the scale,shape, and species of plants in the park. Many studies on the cooling efect of urban parks or green spaces in various countries and cities have revealed that the park cooling efect varies in timing, magnitude, and spatial distribution(Chang, Li, and Chang 2007; Bowler et al. 2010; Lu et al. 2013). Meanwhile, most of these studies have involved relatively short periods or representative cases, so little information is available for a universal description of theurban cooling efect. Another problem in previous studies is that, when planning for urban green spaces or parks as urban cooling islands, information on whether urban parks have a heat efect compared to rural areas has been neglected. Therefore, detailed studies of urban parks are required to clarify the park cooling efect and its possible infuences.
A dense automatic weather station (AWS) network of more than 200 stations has been installed in urban and rural areas around Beijing, China. The network provides hourly temperature data (CMA 2003). In the present study,to delve into the climatological features of urban parks,statistics on the cooling efect and UHI intensity (UHII)results for Temple of Heaven Park (THP) are analyzed and the cause of the diference is identifed. The cooling efect is expressed in terms of the cooling rate (%), defned as∆Turban-park/Turban× 100, where Turbanis the average temperature from 2007 to 2011 of each urban site. Also, we defne the UHII as ∆Tu-r= Turban- Trural, where Truralis the average temperature of eight reference stations and Turbanis the temperature of any urban station.
2. Background
2.1. Study area, data, and method
Beijing has a typical temperate continental climate, with hot summers, cold winters, and a highly concentrated summer precipitation regime (Lu 2002). A multiple ring road (Figure 1(a)) system of transportation has been developed. In general, weather stations located inside the 6th ring road in Beijing are considered urban sites (Wang, Li,and Feng 2010).
Hourly temperature data of 57 urban stations and eight reference stations during 2007-2011 were obtained from the Meteorological Information Center, Beijing Meteorological Bureau. The eight reference stations (Figure 1(a)) lie in open ground with vegetation surfaces and are away from the impact of high buildings to a large degree,and were selected using a remote sensing method (Ren and Ren 2011). In order to increase the robustness of the analysis, all hourly temperature data used here have been checked and quality-controlled. A detailed description of the methodology used for the quality control is provided by Yang et al. (2011), Yang, Xiao, and Liu (2013), and Yang,Ren, and Liu (2013).
2.2. UHII distribution

Figure 1.Locations and distribution of UHII in Beijing. (a)Locations of 2nd to 6th ring roads and the 57 weather stations providing hourly temperature data in Beijing. The isolines are contours indicating the terrain height. Also shown are the eight reference stations with name abbreviations (black dots) as follows: FHL, Feng Huang Ling; YLD, Yong Ledian; PGZ, Pang Ge Zhuang; AD, An Ding; NZ, Nan Zhao; DXC, Dong Xin Cheng; DSGZ,Da Sun Ge Zhuang; and LWT, Long Wan Tun. The dashed rectangle represents the key area in this paper. (b) Annual mean UHII values(°C) in Beijing urban areas during 2007-2011. (c) Locations and information regarding the six park-district pairs in Beijing. Each black rectangle represents one park-district pair. The pairs’names and their abbreviations are as follows: THP (Temple of Heaven Park)-TAM (Tian An Men); YYTP (Yu Yuan Tan Park)-WKS(Wu Ke Song); ZZYP (Zi Zhu Yuan Park)-USG (University Student’s Gymnasium); OG (Olympic Green)-OTC (Olympic Tennis Center);CYP (Chao Yang Park)-CY (Chao Yang); and LTHP (Long Tan Hu Park)-GGXT (Gu Guang Xiang Tai).
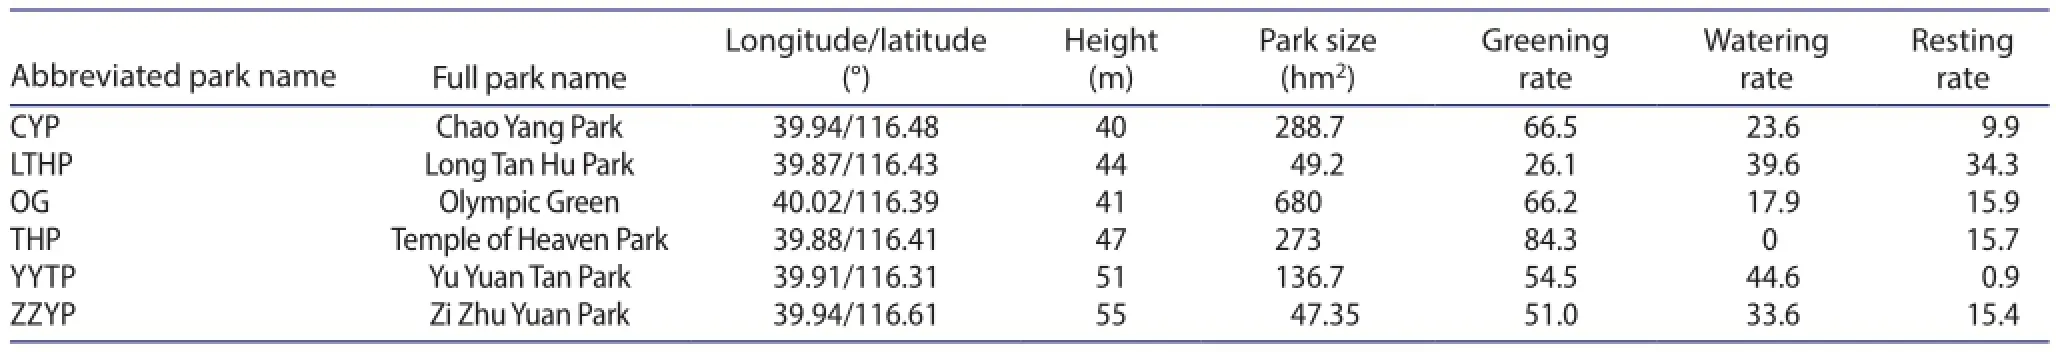
Table 1.Location and other details regarding the six selected urban parks.
The annual mean UHII (Figure 1(b)) shows that the UHII is stronger in the city center, except for a site in southeastern central Beijing, where it is relatively low. This site is THP,which is located near Tian An Men (TAM) - the central business district in Beijing. THP consists of a complex of grassland and forests, with an area of 273 hm2. Figure 1(b) shows that only THP displays an obvious cooling feature among 57 urban sites in Beijing. Although THP has a cooling efect on surrounding districts' UHIs, it still belongs to UHIs, with annual intensities as weak as 0.44 °C. However,it is much cooler than its adjacent district TAM, with a UHII of 1.77 °C. The same is true for the seasonal UHIIs. There are other urban parks in the center of Beijing, but none of them exhibit a strong cooling efect. Hence, further research on THP with comparison to other urban parks is necessary.
To summarize THP's climate features and explore the possible reasons for its signifcant cooling efect, the urban district close to THP (i.e. TAM) was selected for a paired park-district analysis. Five other park-district pairs inside the 4th ring road were also selected (Figure 1(c)) as comparisons, and the detailed information of them is shown in Table 1.
3. Results
3.1. Features of THP
The average annual UHII for six urban parks and corresponding districts and the UHII diferences were calculated. A UHII is still evident for the city parks, but the values are lower than those of the adjacent urban sites. The lowest mean UHII is for THP (0.44 °C). The UHII diference for each park-district pair was determined. The UHII diference between THP and TAM is 1.33 °C, which is much higher than that for the other park-district pairs. The second largest UHII diference is for LTHP (0.56 °C) - less than half the value of THP. Both THP and LTHP are located inside the 2nd ring road, and the temperatures of their urban surroundings are higher than other regions. It seems that a park in a strong temperature background may have a more signifcant cooling efect, but more evidence is required for a frm conclusion.
Figure 2(a) shows the UHII frequency plots at intervals of 1.0 °C for THP and TAM. For THP the UHII frequency exhibits a normal distribution, while the distribution for TAM is rightskewed. Thus, the probability of positive hourly UHII in THP is almost the same as the probability of negative hourly UHII. In addition, TAM is almost always controlled by UHIs because the possibility of a negative UHII in TAM is very low. This is in agreement with previous research revealing that the park has a cooling efect (Yokohari et al. 1997).
Figure 2(b) shows the distribution of UHII diferences between THP and its surroundings (TAM). It can be seen that the THP UHII decreases smoothly at frst and then increases with fuctuations as the TAM UHII increases. A more detailed analysis of the TAM UHII values within 7.0 °C is demonstrated in Figure 2(c).
Figure 2(c) shows that the THP UHII correlation is rather stable when the mean TAM UHII is less than 3.0 °C, and oscillates signifcantly when the mean TAM UHII is more than 7.0 °C. This can be explained by the low frequency of THP UHII values greater than 7 °C, which leads to randomness in its correlation with the TAM UHII. This implies that the park THP has a remarkable cooling efect that resists increase in the UHII for the surrounding area. In addition,as the TAM UHII increases, the THP UHII actually decreases rapidly when the TAM UHII is within the range of 3.0 °C. The THP UHII only increases rapidly when the TAM UHII is more than 6.0 °C. This decrease in THP UHII is referred to as ‘an enhanced park cooling efect', when the TAM UHII increases. This feature goes beyond the phenomenon whereby a park or green space relieves urban heat efects and exhibits a cooler temperature than its surroundings. THP is taken as an example to analyze this enhanced cooling efect. It is evident that the THP UHII does not linearly increase with the UHII of the surrounding district. Instead,it decreases until a TAM UHII threshold is reached (3.0 °C),remains at a minimum until another TAM UHII threshold at 6.0 °C, and then increases with the TAM UHII. Thus, it is hypothesized that for some parks, such as THP, the cooling efect reaches a peak and remains stable when the city background UHII varies within a given range. Outside this range, the cooling efect of the park fuctuates and becomes unstable when the UHII goes beyond the given range.
3.2. Enhanced cooling efect of THP
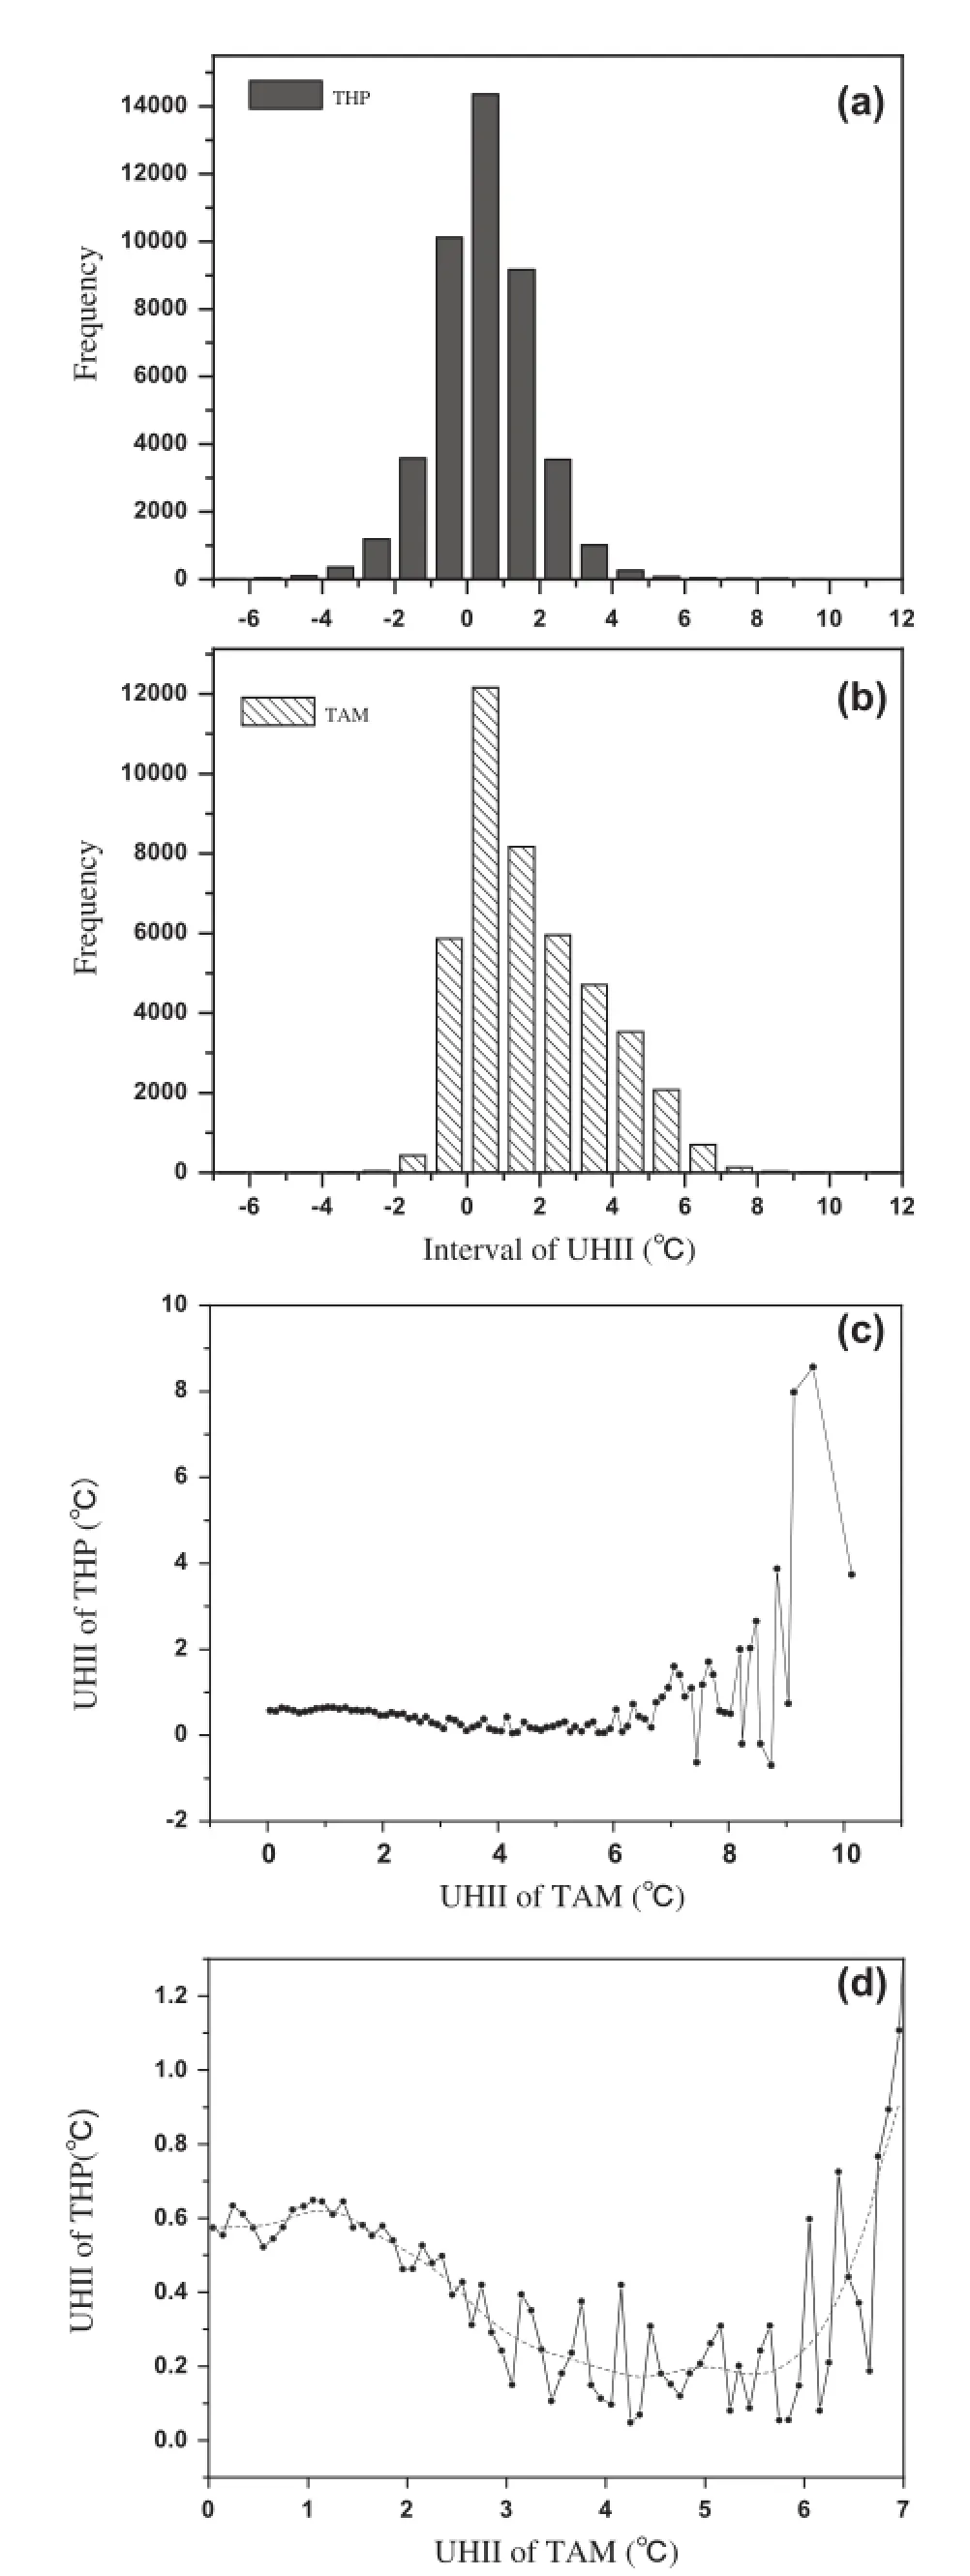
Figure 2.The diferent features between THP and TAM: UHII frequency plots at intervals of 1.0 °C for (a) THP and (b) TAM;(c) average TAM (x-axis), at intervals of 0.1 °C, versus THP UHII(y-axis); (d) magnifcation of the curve in Figure 2(c) for TAM UHII values less than 7.0 °C.
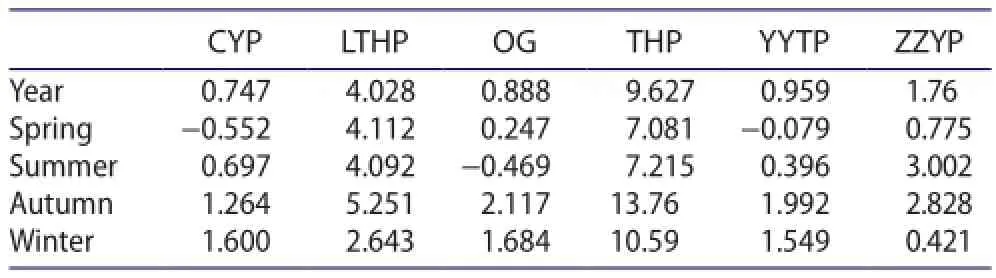
Table 2.The average annual and seasonal cooling rates of the six parks.
To identify the reason for the conspicuous cooling effect of THP, the cooling rates of the six park-district pairs are shown in Table 2. The results show that, in terms of the yearly average, the differences for THP are apparent. Its cooling rate is 9.63% - much higher than that of the other parks. The cooling rate in autumn reaches 13.76%, which is usually associated with the calm weather and stable lower atmosphere. Strong wind may be a key factor for the weak cooling effect in spring. Frequent rainfall and the unstable lower atmosphere in the monsoon season may be the important reason for the weaker cooling effect during summer. Besides, in terms of the diurnal variation at THP, it is found that the cooling effect increases rapidly at sunset but decreases rapidly at sunrise. This shows that a persistently stronger cooling rate at the night may be one of the important reasons behind the enhanced cooling effect of THP. Weather conditions, solar radiation etc. also have an influence on the enhanced cooling effect.
The diurnal UHI variations for the six park-district pairs were calculated (Figure 3). Overall, except for THPTAM, the pairs exhibit a similar pattern in which the mean UHII is higher at night and lower during the day. The other parks generally have a higher daytime UHII and a lower nocturnal UHII. The most notable feature is the daily UHII variation for THP, which is totally different to the variation for all the other district and park sites studied. The UHII for THP is more marked before noon and remains weak at ~0 °C at night, while its comparative urban site follows the same daily variations as the other five groups. This characteristic UHII for the park (THP)indicates a significant enhanced cooling effect. Previous research has demonstrated that microclimate conditions are consistent with the shade of trees, depending on the tree species (Narita et al. 2002). Furthermore, oxygen production and carbon dioxide absorption (among other substances) by shrubs and some other trees are 38.5 times more than that of grassland (Liu, Li, and Yang 2008). Consequently, the species of plants present in the park have a considerable impact on the cooling effect of the park, i.e. decreasing the temperature of surrounding district UHIs. In this respect, the enhanced cooling effect of THP can be explained by the abundance of trees, amounting to over 60,000.

Figure 3. Diurnal variations of annual mean UHII (°C) for six park-district pairs: (a) CYP (Chao Yang Park)-CY (Chao Yang);(b) LTHP (Long Tan Hu Park)-GGXT (Gu Guang Xiang Tai); (c) OG (Olympic Green)-OTC (Olympic Tennis Center); (d) THP(Temple of Heaven Park)-TAM (Tian An Men); (e) YYTP (Yu Yuan Tan Park)-WKS (Wu Ke Song); and (f) ZZYP (Zi Zhu Yuan Park)-USG (University Student's Gymnasium).
To investigate the influence of surrounding UHIs on the park cooling effect, the variations in UHII differences for park and district pairs are analyzed as a function of changes in district UHII. For all six pairs, variations in the district-park UHII difference were calculated using mean UHII values (Figure 4). The significant oscillations in the plot for district UHII values greater than 7.0 °C are due to the low frequency of UHII values for the parks in this range. Therefore, the 0-7.0 °C interval for district UHII values is emphasized. Analysis reveals that THPTAM and CYP-CY differ significantly from the other four park-district pairs. For the latter pairs, the park-city UHII difference increases slowly with the district UHII and the maximum UHII differences are never greater than 2.0 °C. In other words, the cooling effect of park stations is almost unrelated to the surrounding UHI conditions. Conversely, for the THP-TAM and CYP-CY pairs,the park-district UHII difference rapidly increases and reaches a maximum of 8.0 °C with increasing district UHII. Specifically, it is found that the variation of CYP-CYis not the same as THP-TAM. The curve of THP-TAM is stable and smooth, while it is oscillating and unstable for CYP-CY. Overall, we find that the cooling effect of CYP is the lowest among all the parks. Also, the UHII of CY is the lowest (0.1 °C) of all urban sites. So, the inconspicuous UHII of CY might lead to the unstable relationship between CYP and CY.
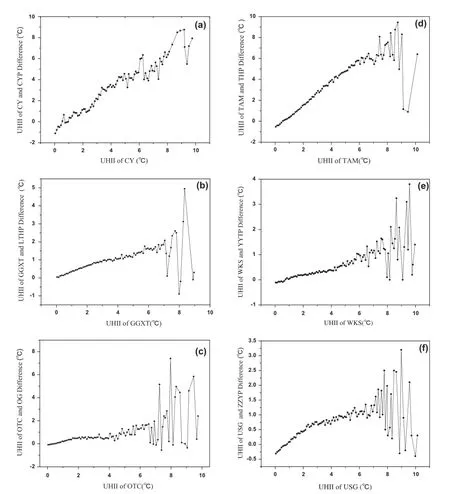
Figure 4. Variations of UHII diference (°C) between parks and their surroundings at intervals of 0.1°C. The six park-district pairs are as follows: (a) CYP (Chao Yang Park)-CY (Chao Yang); (b) LTHP (Long Tan Hu Park)-GGXT (Gu Guang Xiang Tai); (c) OG (Olympic Green)-OTC(Olympic Tennis Center); (d) THP (Temple of Heaven Park)-TAM (Tian An Men); (e) YYTP (Yu Yuan Tan Park)-WKS (Wu Ke Song); and(f) ZZYP (Zi Zhu Yuan Park)-USG (University Student’s Gymnasium).
Among the six parks, only THP and CYP share the common attribute of almost no water surfaces, while the other four parks differ in their water coverage. Water bodies absorb solar heat and are favorable in maintaining a higher UHII. Therefore, the absence or presence of water surfaces might be a key factor in the enhanced park cooling effect.
Analysis reveals that water surfaces play an important role in the cooling effect. To remove the influence of the city background, two parks surrounded by similar districts were compared. Figure 1(c) shows that LTHP is the nearest park to THP (6 km away) and its surrounding district exhibits similar behavior to TAM (district for THP). Therefore, we compared the LTHP-GGXP and THP-TAM pairs. The water surface in LTHP accounts for 39.6% of the total area, which is very different to the situation for THP. Comparison of these two pairs can provide an insight into the influence of water surfaces in urban parks.
Calculating the frequency distribution of UHII differences between LTHP and GGXT, we also found both LTHP and GGXT exhibit a right-skewed UHII distribution. This means that LTHP shows similar behavior to the urban sites. The LTHP UHII increases linearly with the GGXT UHII, which is very different to the relationship between THP and TAM. Further analyses of parks with large water coverage, such as ZZYP and YYTP,revealed similar results to those for the LTHP-GGXT pair. Therefore, a large water surface in a park seems to reduce the enhanced cooling effect.
4. Discussion
The cooling efect of urban parks is not a new topic. Previous studies show that urban parks can usually cool their surroundings (Yokohari et al. 1997). In fact, research concerning the park cooling efect in Beijing can be traced back to the 1980s (Chen, Cui, and Liu 1983). However, the majority of these studies (Liu, Li, and Yang 2008) related to urban parks were focused on comparing the distribution of the properties, species, and communities of vegetation in parks. Few studies have been based on integrated data on both temporal and spatial scales, meaning quantitative evaluation of the urban park cooling efect on surrounding district UHIs is currently insufcient. Given that a park contributes to improving the urban microclimate, which is an important aspect of city planning and construction,further quantitative research is therefore worth pursuing.
In this paper, based on a new data-set, the general spatial UHII distribution over urban areas in Beijing is demonstrated. It is found that the UHII is stronger in the city center, aside from certain individual sites. Further study shows that these individual sites with lower UHII in the city center are often park stations, and the most obvious among them is THP, making it an interesting case worthy of further exploration. Through analysis, it is revealed that urban parks not only present the diferent properties of urban areas, but also have a cooling efect. It is concluded that the UHII of urban parks does not linearly increase with the UHII of the surrounding district - a result rarely mentioned before, and one for which the underlying mechanism still needs to be studied in the future.
It is also revealed that the enhanced cooling effect of urban parks is not everlasting. When the UHII of the urban surroundings reaches a certain threshold, the UHII of the corresponding urban park will increase along with its urban sites. In this respect, it is found that the threshold value is related to the nature of the vegetated area of the urban park. Through further analysis, it is revealed that the coverage of water surfaces is another factor affecting the cooling effect. Also, the species composition of the vegetation might be of importance. These investigations are useful for understanding the reasons behind the enhanced cooling effect of urban parks. Furthermore, in an applied sense, the findings might be useful for designing urban parks. It is shown that urban parks not only reduce UHIs, but also reverse the effects of UHIs when the surrounding UHII is within a certain range. Thus, more parks or green areas built in city centers is one way of resolving urban climate problems. However, the cooling process is complex, affected by the species of plants, water coverage, surrounding climate features, daily changes of UHI, and so on. Thus, it is necessary to further study the relationships between the park cooling effect and the UHI effect, thus contributing to improving the heat environment of cities,optimizing urban infrastructure, and improving urban functions.
5. Conclusions
Using a recently developed and quality-controlled hourly AWS data-set, we investigated the cooling efect of THP in comparison to other urban parks. The following conclusions can be drawn:
(1) Only THP has an obvious cooling efect among 57 urban sites in Beijing, which is referred to as the enhanced cooling efect. Importantly,the species of plants in the park being mainly shrubs and trees are a key cause.
(2) The UHII of THP is more marked at noon and weak (~0 °C) at night, while its surrounding site (TAM) shows the same daily variations as other normal stations. This demonstrates that the weak UHI at night for the urban site plays the most important role in its enhanced cooling efect.
(3) For parks like THP, the enhanced cooling efect
reaches a peak and remains stable when the background city UHI varies within a given range. The UHII for parks is negative and this coolingefect is enhanced when the surrounding UHII increases within the range. Conversely, beyond the range, the cooling efect of a park fuctuates and becomes unstable.
(4) Water coverage can afect the park UHII, with a large water surface in a park possibly reducing its cooling efect.
Disclosure statement
No potential confict of interest was reported by the authors.
Funding
The study was supported by the National Natural Science Foundation of China [grant number 41375069]; National Basic Research Program of China [grant number 2012CB957804];Young Talent Programming of China Meteorological Administration.
References
Akbari, H., M. Pomerantz, and H. Taha. 2001. “Cool Surfaces and Shade Trees to Reduce Energy Use and Improve Air Quality in Urban Areas.” Solar Energy 70 (3): 295-310.
Bowler, D. E., L. Buyung-Ali, T. M. Knight, and A. S. Pullin. 2010.“Urban Greening to Cool Towns and Cities: A Systematic Review of the Empirical Evidence.” Landscape and Urban Planning 97: 147-155.
Chang, C., M. Li, and S. Chang. 2007. “A Preliminary Study on the Local Cool-Island Intensity of Taipei City Parks.” Landscape and Urban Planning 80 (4): 386-395.
Chen, J., S. Cui, and Z. Y. Liu. 1983. “Summer Efect of Street Trees and Lawns on Microclimate in Beijing.” [In Chinese.] Journal of Beijing Forestry College 1: 15-25.
(CMA) China Meteorological Administration. 2003. Specification of Ground Meteorological Observation. [In Chinese.] Beijing: China Meteorological Press: 104-125.
Grimmond, C. S. B. 2006. “Progress in Measuring and Observing the Urban Atmosphere.” Theoretical and Applied Climatology 84: 1-22.
Hausfather, Z., M. J. Menne, C. N. Williams, T. Masters, R. Broberg,and D. Jones. 2013. “Quantifying the Efect of Urbanization on U.S. Historical Climatology Network Temperature Records.”Journal of Geophysical Research 118: 481-497.
Jansson, C., P. E. Jansson, and D. Gustafsson. 2007. “Near Surface Climate in an Urban Vegetated Park and Its Surroundings.”Theoretical and Applied Climatology 89: 185-193.
Landsberg, H. E. 1981. The Urban Climate. New York: Academic Press: 157-275.
Limor, S. B., P. David, and E. Evyater. 2009. “The Cooling Efciency of Urban Landscape Strategies in a Hot Dry Climate.”Landscape and Urban Planning 92: 179-186.
Liu, J. M., S. H. Li, and Z. F. Yang. 2008. “Temperature and Humidity Efect of Urban Green Spaces in Beijing in Summer.”[In Chinese.] Chinese Journal of Ecology 27 (11): 1972-1978.
Liu, J. M., and Z. F. Yang. 2009. “Dynamics of Temperature and Humidity in under Laying Surface of Diferent Landscape Type in Winter in Beijing City China.” [In Chinese.] Acta Ecologica Sinica 29 (6): 3241-3252.
Lu, R. Y. 2002. “Separation of Interannual and Interdecadal Variations of Rainfall in North China.” [In Chinese.] Journal of Atmospheric Sciences 26 (5): 611-624.
Lu, W. W., C. Chen, M. R. Su, B. Chen, Y. P. Cai, and T. Xing. 2013.“Urban Energy Consumption and Related Carbon Emission Estimation: A Study at the Sector Scale.” Frontiers of Earth Science 7 (4): 480-486.
Ma, Z. G., and C. B. Fu. 2003. “Interannual Characteristics of the Surface Hydrological Variables over the Arid and Semi-Arid Areas of Northern China.” Global and Planetary Change 37 (3): 189-200.
Memon, R. A., S. Chirarattananon, and P. Vangtook. 2008.“Thermal Comfort Assessment and Application of Radiant Cooling: A Case Study.” Building and Environment 43: 1185-1196.
Narita, K., T. Mikami, T. Honjo, H. SuGWSara, K. Kimura, N. Kuwata. 2002. “Diferentiations about Cool-Island Phenomena in Urban Park.” Fourth Symposium on the Urban Environment,American Meteorological Society, Norfolk, Virginia Abs, May 20-24, 2002 8 (2): 86-87.
Ren, G. Y., Z. Y. Chu, Z. H. Chen, and Y. Y. Ren. 2007. “Implications of Temporal Change in Urban Heat Island Intensity Observed at Beijing and Wuhan Stations.” Geophysical Research Letters 34: L05711.
Ren, Y. Y., and G. Y. Ren. 2011. “A Remote-Sensing Method of Selecting Reference Stations for Evaluating Urbanization Efect on Surface Air Temperature Trends.” Journal of Climate 24: 3179-3189.
Sakakibara, Y., and K. Owa. 2005. “Urban-Rural Temperature Diferences in Coastal Cities: Infuence of Rural Sites.”International Journal of Climatology 25: 811-820.
Sandra, O., A. Henrique, and V. Teresa. 2011. “The Cooling Efect of Green Spaces as a Contribution to the Mitigation of Urban Heat: A Case Study in Lisbon.” Building and Environment 46: 2186-2194.
Wang, X. L., X. R. Li, and Z. K. Feng. 2010. “Research on Urban Extension Based on Shannon Entropy.” [In Chinese.] China Population Resource and Environment 20 (3): 88-92.
Yang, P., W. D. Liu, J. Q. Zhong, and J. Yang. 2011. “Evaluating the Quality of Temperature Measured at Automatic Weather Stations in Beijing.” Journal of Applied Meteorological Science 22 (6): 706-715.
Yang, P., G. Y. Ren, and W. D. Liu. 2013. “Spatial and Temporal Characteristics of Beijing Urban Heat Island Intensity.”Journal of Applied Meteorology and Climatology 52 (8): 1803-1816.
Yang, P., Z. N. Xiao, and W. D. Liu. 2013. “Comparison of Diurnal Temperature Variation in Urban and Rural Areas in Beijing and Its Seasonal Change.” [In Chinese.] Journal of Atmospheric Sciences 37 (1): 101-112.
Yokohari, M., R. D. Brown, Y. Kato, and S. Yamamoto. 1997.“The Cooling Efect of Paddy Fields on Summertime Air Temperature in Residential Tokyo, Japan.” Landscape Urban Plan 53: 17-27.
10 November 2015
CONTACT YANG Ping yangp@cma.gov.cn
© 2016 The Author(s). Published by Informa UK Limited, trading as Taylor & Francis Group.
This is an Open Access article distributed under the terms of the Creative Commons Attribution License (http://creativecommons.org/licenses/by/4.0/), which permits unrestricted use,distribution, and reproduction in any medium, provided the original work is properly cited.
猜你喜欢
杂志排行
Atmospheric and Oceanic Science Letters的其它文章
- Assessment of surface drag coefficient parametrizations based on observations and simulations using the Weather Research and Forecasting model
- A multidecadal oscillation in the northeastern Pacific
- Precipitation responses to radiative processes of water- and ice-clouds: an equilibrium cloud-resolving modeling study
- Influences of the interannual variability of vegetation LAI on surface temperature
- The link between the Victoria mode in the preceding boreal winter and spring precipitation over the southeastern USA and Gulf of Mexico
- Biogenic isoprene emissions over China: sensitivity to the CO2inhibition effect