Urbanization-related warming in local temperature records: a review
2016-11-23WANGJunandYANZhongWei
WANG Jun and YAN Zhong-Wei
Key Laboratory of Regional Climate-Environment for Temperate East Asia, Institute of Atmospheric Physics, Chinese Academy of Sciences,Beijing, China
Urbanization-related warming in local temperature records: a review
WANG Jun and YAN Zhong-Wei
Key Laboratory of Regional Climate-Environment for Temperate East Asia, Institute of Atmospheric Physics, Chinese Academy of Sciences,Beijing, China
There have long been arguments about the impact of urbanization on local meteorological observations. This letter reviews up-to-date studies of the urbanization-related warming in the observed land surface air temperature series in China. Many previous studies have suggested that, over the past few decades, the local warming due to urbanization could have been about 0.1 °C/10 yr, or even larger. However, based on recently developed homogenized temperature records, the estimated urban bias is smaller. Major uncertainties arise from either the data quality or the techniques used to estimate the urbanization effect. A key example is the ‘observationminus-reanalysis' method, which tends to overestimate the urban signal in this region, partly due to systematic bias in the multi-decadal variability of surface air temperature in the reanalysis data. It is expected that improved numerical modeling with high-resolution information regarding the changing land surface in the region will help to further understand and quantify the effect of urbanization in local temperature records.
ARTICLE HISTORY
Urbanization; China; land
surface air temperature;
homogenization;
observation-minus-reanalysis method; uncertainty
城市化影响局地气温观测记录,是气候变化领域关注的问题之一。曾有研究认为,近几十年中国气温观测中城市化增温达0.1°C/10年甚至更高。然而,近年基于均一化观测而得到的结果要小得多。其中的不确定性主要源于数据质量和评估方法。典型例子如‘观测减再分析(OMR)’方法。由于再分析资料中的多年代际变率相对于实际气温观测存在系统性偏差,该方法通常会高估城市化效应。近年发展的高分辨率气候模拟及动态陆面演变信息将有助于理解和量化城市化效应。
1. Introduction
Urbanization is a human activity that clearly modifies the earth system. Involving artificial changes to the land surface and growing energy consumption, urbanization affects the surface energy budget and land—atmosphere interaction, resulting in the ‘urban heat island' (UHI) effect(Oke 1982; Arnfield 2003; Collier 2006), among a few other well-known effects. The intensity of the UHI effect varies with city size, geographical location, and background weather conditions (Oke 1973; Johnson et al. 1991; Zhao et al. 2014a). Previous studies have extensively discussed the seasonal and diurnal variations and extremes of the UHI effect at various spatiotemporal scales (Kim and Baik 2005; Gaffin et al. 2008; Dou and Zhao 2011). The present letter focuses on the influence of the long-term evolution of the UHI effect on station temperature records.
Since urbanization usually induces a warming trend in the observed surface air temperature series, in a way similar to that of the increasing concentration of atmospheric greenhouse gases, the effect of urbanization has become a matter of concern in the field of climate change detection and attribution (Parker 2010). It is notable that the urban influence on the global temperature series has been found to be negligible (Jones et al. 1990; Easterling et al. 1997;Hansen et al. 1999, 2001; Peterson et al. 1999; Folland et al. 2001; Parker 2004, 2006), with estimates for the last century not exceeding 0.1 °C. However, the urbanization-induced warming in local (or regional) temperature observations could be considerable (Böhm 1998; Lin and Yu 2005; Ren et al. 2007; Yan et al. 2010), although controversies remain regarding the magnitude of such an effect (Karl and Jones 1989; Wang, Zeng, and Karl 1990; Portman 1993; Hansen et al. 2001; Kalnay and Cai 2003; Peterson 2003; Li et al. 2004, 2010; Zhou et al. 2004; Hua, Ma, and Guo 2008; Jones,Lister, and Li 2008; Ren et al. 2008; Chen et al. 2011; Yang,Hou, and Chen 2011; Wang and Ge 2012; Wu and Yang 2013; Chrysanthou et al. 2014; Wang et al. 2015). For the US, Karl and Jones (1989) suggested that, based on two global land-based temperature datasets (Jones et al. 1986;Hansen and Lebedeff 1987), the regional mean temperature series during 1901—1984 contains an urban bias ofbetween 0.1 and 0.4 °C. Hansen et al. (2001) found local urban warming effects even in suburban and small-town observations, and removed an urban warming bias of about 0.15 °C from the country-wide average temperature series for the last century. However, Peterson (2003)found ‘no significant urbanization effect' in the regional mean temperature series, based on homogenized data. For Europe, the urbanization effect might only explain 1.45%(0.0026 °C/10 yr) of the annual-mean temperature trend(0.179 °C/10 yr), according to Chrysanthou et al. (2014).
Owing to dramatic urban development since the 1980s,station temperature records in China appear to have been more seriously influenced than in other regions of the world. Wang, Zeng, and Karl (1990) suggested that, since the late 1970s, the rate of urban warming at urban stations in China has exceeded 0.1 °C/10 yr. Portman (1993) suggested that urban stations in North China experienced an urban-induced warming trend of 0.15—0.26 °C/30 yr during 1954—1983. However, the inhomogeneities in station temperature series were not explicitly treated in these early studies, and similar results were also obtained in more recent studies that used station observations that were not homogenized (He et al. 2007; Ren et al. 2008). In contrast, based on a homogenized data-set of annual mean surface air temperature, Li et al. (2004) assessed the urbanization effect in temperature records in China and concluded that the regional mean urbanization effect is less than 0.012 °C/10 yr for the period 1954—2001. Taking the SSTs averaged over the ocean adjacent to eastern China as a reference, Jones, Lister, and Li (2008) suggested that the urban-related warming over China could be up to 0.1 °C/10 yr during 1951—2004. However, since largescale climatic warming over land tends to be more intense than over the ocean, the land—sea contrast in the temperature trend can hardly serve as a reference for local urban warming.
Section 2 of this letter outlines current techniques used for estimating the urbanization effect and sources of uncertainties. Section 3 highlights the role of homogenization of temperature observations in assessing the urban-related signal. Section 4 discusses the prospects of applying high-resolution regional modeling. Conclusions are given in Section 5.
2. Techniques used to estimate urbanization effects
2.1. Urban-minus-rural method
A simple idea to estimate the urban warming effect is to compare the temperature trend at urban stations with that at nearby rural stations. The premise of this technique is that temperature records at the rural stations are free of the impact of urbanization. A crucial problem, however, is how to classify stations into the different types.
2.1.1. Classification by socioeconomic indices
Most early studies of the urbanization effect classified urban and rural stations based on a number of socioeconomic indices, such as population, urban built-up area,and GDP. With their ease of access, population data were particularly widely used (e.g. Karl, Diaz, and Kukla 1988;Jones et al. 1990; Wang, Zeng, and Karl 1990; Ren et al. 2008). Portman (1993) classified stations into urban and rural types according to population density. Zhou and Ren (2005) adopted the resident population for station classification. The argument against this approach is that the thresholds of these indices for station classification are subjectively determined, and estimates of the urban signal could be sensitive to the thresholds (Peterson and Owen 2005). Moreover, much sociological information is outdated; certain ‘rural' stations might now be ‘urban'. The urbanization-induced changes in the underlying surface surrounding the station could be misinterpreted by static sociological indices. For instance, ‘urban' stations located in large parks might barely represent the urban case.
2.1.2. Classification by satellite data
Satellite remote-sensing data (e.g. nighttime light intensity, land brightness temperature, NDVI) provide a basis to identify more objectively whether stations are located in rural or urban areas. For example, satellite-derived nighttime light intensity was applied to determine the landuse types around observational sites in the US (Imhoff et al. 1997; Owen et al. 1998; Hansen et al. 1999, 2001),and Ren and Ren (2011) applied land surface brightness temperature in identifying reference stations. However,the extent of influence of the urban effect may be quite different in different regions, and hence the threshold for classifying an urban or rural site remains problematic. Gallo, Easterling, and Peterson (1996) found that the observed diurnal temperature range is highly associated with the predominant land-use type within a 100-m radius of the station. However, Yang, Hou, and Chen (2011) used the information within the surrounding area of a radius of 7 km to define the station type. The meteorological station in Chaoyang Park in Beijing serves as an example. When using the satellite data within a radius of less than 1 km,it can be classified as rural, since the surrounding areas are mostly covered by green vegetation. However, it is situated in a highly urbanized metropolitan center from a larger-scale perspective. Gallo et al. (1999) found that the trends in rural diurnal temperature range varied from -0.41 to -0.67 °C/100 yr, depending on the criteria used to define land-use types. More important is that urbanization is a complex and dynamical process. The currentlydetermined urban status may have been so for a long time,or may have just transformed recently from rural status. The climatic effects in these two cases can be quite different. Figure 1 shows the nighttime light patterns in the Greater Beijing region in 1992, 2000, and 2008, which outline the urbanization process during recent decades. The environment surrounding some stations has changed from rural to urban, whereas some sites have long been urban or rural.
2.1.3. Classification with statistical analysis
Some researchers have classified station types via objective statistical analysis. For example, EOF decomposition was applied to the temperature data in the region of study in order to divide stations into different categories(Huang, Liu, and Li 2004; Chu and Ren 2005). Wang et al. (2012) used a varimax-rotated EOF analysis to verify their empirical station divisions. Statistical analyses are particularly suitable for identifying urban-related signals in precipitation records (e.g. Han et al. 2014), as the impact of urbanization on precipitation is indirect and tends to exist over specific directions of the urban area depending on the local circulation and geographical conditions. Using three temperature indices (annual mean temperature, number of hot days, and number of chilly days), Wang et al. (2013a) applied a cluster analysis to classify observational stations into urban and non-urban types. Figure 2 presents the results of the cluster analysis in a 3D scatter diagram. On the basis of the geographic information of each station, four categories were named: urban, suburban, rural, and mountain. In general, classification based on statistical analyses is more objective than the results of other methods. However, such an approach should be based on a sufficiently dense network of observational stations within a particular region. In fact, station density is often not sufficient for identifying the urban signal in climate observations.
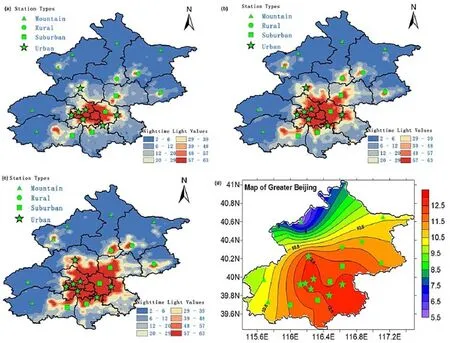
Figure 1. Geographic patterns of nighttime light intensity in the Greater Beijing region in (a) 1992, (b) 2000, and (c) 2008.(d) Locations of 20 meteorological stations in the Greater Beijing region used herein, and the geographic distribution of annual mean temperature in the Greater Beijing region during 1978—2008 (units: °C). Green stars, squares, solid dots,and triangles represent urban, suburban, rural, and mountain stations, respectively. Source: Wang et al. (2013a).

Figure 2. Three-dimensional scatter plot for the results of cluster analyses for three temperature indices (annual mean temperature, number of chilly days, and number of hot days).Source: Wang et al. (2013a).
2.1.4. Comparison with sounding temperature observations
Given the difficulties in designating the non-urban temperature trend in highly urbanized regions on the ground,some researchers have attempted to use the sounding temperature in the lower troposphere (e.g. at 850 and 700 hPa) as a reference to estimate the local warming induced by urbanization (Cayan and Douglas 1984; Ernesto 1997). However, sounding data are prone to inhomogeneous biases as well, e.g. due to implementing new instruments and, more complicatedly, long-term variability in the atmospheric circulation. Another complex problem arises from the fact that the surface air temperature may increase more (or less) than the tropospheric temperature does in a region, without a clear boundary. Therefore, it is hard to ascribe any regional difference of the trend between the surface air temperature and the higher-level air temperature solely to the effect of local urbanization.
2.2. Observation-minus-reanalysis method
Alongside studies based on station observations, discussed above, another avenue of research in this field involves the use of reanalysis data. Kalnay and Cai (2003) proposed the‘observation-minus-reanalysis' (OMR) method to estimate the impact of land-cover change over the US. The basic idea of OMR is that the NCEP—NCAR reanalysis temperature data (or other reanalysis datasets) represent large-scale climate change but do not take into account the local effects of urban land-use. Therefore, the relative warming in site observations can be ascribed to land-use changes such as urbanization. However, Trenberth (2004) argued that the NCEP—NCAR reanalysis data do not consider the effects of changing atmospheric composition on radiation either. Cai and Kalnay (2005) replied that the trend due to the increase in greenhouse gases should be present in the reanalysis data, even if a model used for reanalysis does not include this external forcing.
Using the OMR method with NCEP—DOE reanalysis data, Zhou et al. (2004) found that urban effects induced an additional warming trend of 0.05 °C/10 yr over southeastern China for the period 1979—1998. Their results showed that the urban warming in winter minimum temperature over the Pearl River Delta region was significant,whereas that over the Yangtze River Delta region was negligible. However, Yang, Hou, and Chen (2011) used the same method and found a strong urban warming of up to 0.466 °C/10 yr (small city: 0.242 °C/10 yr; medium city: 0.273 °C/10 yr; large city: 0.307 °C/10 yr; metropolis: 0.466 °C/10 yr) in the Yangtze River Delta region for the period 1981—2007. Considering that both regions have experienced rapid urbanization during the last three decades, it is difficult to reconcile these temporal and spatial inconsistencies among the OMR results. Contradictory results of OMR analyses were also found by Vose et al.(2004), who found it hard to explain that the OMR trends in the study of Kalnay and Cai (2003) decreased with time. Wang et al. (2013b) suggested that the systematic bias in the multi-decadal variability (MDV) of the reanalysis data could modulate the magnitude of OMR trends considerably during different periods. Figure 3 shows the MDV components in the mean surface air temperature series over the land areas of the NH based on the twentieth century reanalysis (20CR) and ground observations (CRUTEM4). It is notable that the amplitude of the MDV in the reanalysis is weaker than that in the observations, especially for thelatter half of the last century. This raises a clear caveat for applying OMR and reanalysis data in relevant studies.
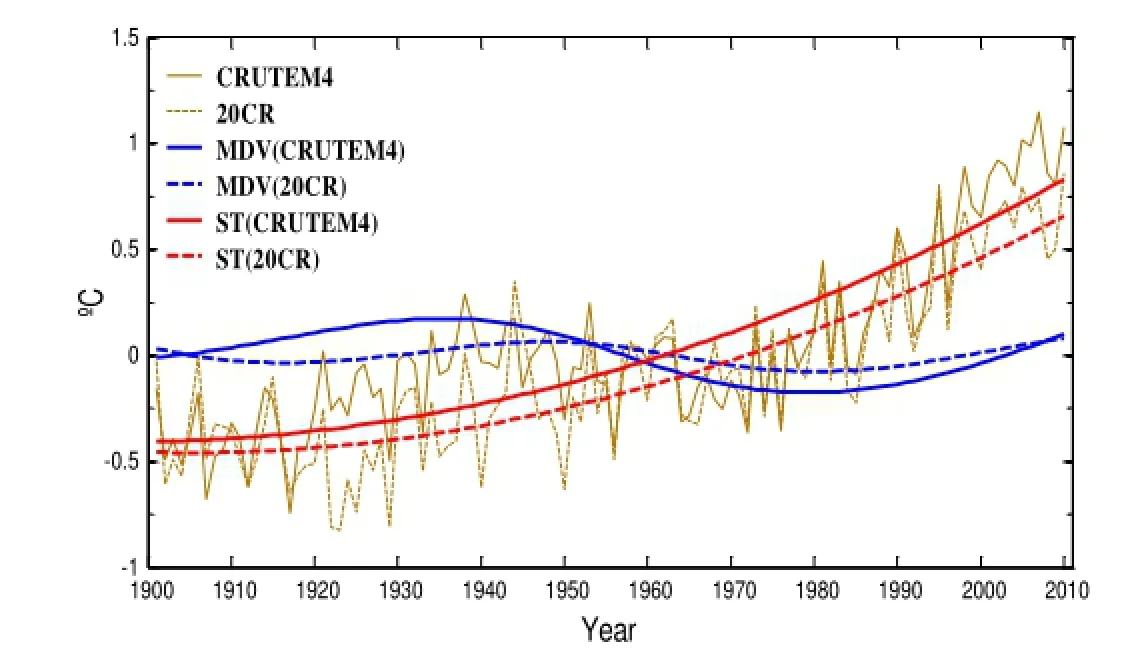
Figure 3.Averaged NH land surface air temperature series (brown lines), secular trend (ST: long-term and non-linear trend; red lines) and MDV (blue lines), based on CRUTEM4 (solid lines) and 20CR (dashed lines). Source: Wang et al. (2013b).
2.3. More indirect reasoning examples
Karl, Diaz, and Kukla (1988) found a relationship between the urban—rural temperature difference and the population over urban areas and applied it to estimate the urban warming bias in area-averaged surface air temperature trends over the US (Karl and Jones 1989). This UHI—population regression is applicable only if there are a large number of stations to calculate the regional averages.
On the premise that urban warming is intense on calm days but suppressed on windy days, Parker (2004, 2006)compared global and regional trends of daily surface air temperatures on calm and windy days, separately, for the period 1950—2000. It was found that the temperature trends were almost unaffected by such subsampling, indicating that local urban warming contributed little to the observed warming trends.
By calculating the contribution of some large-scale climate indices to the observed warming trend in eastern China, Zhao et al. (2014b) indirectly estimated that any local urban warming bias should be less than 20% of the observed warming trend for the last century. Ren et al. (2015) estimated that the urbanization contribution was 24.9% for the national stations of mainland China during 1961—2004. It is reasonable that the effect should be larger for recent decades than for the past century, but the different data networks and methods of data processing also matter.
3. Inhomogeneity of station temperature records
A more widespread problem arises from the inhomogeneities in long-term station temperature series due to many non-climatic factors in the local observing system, such as changes in observing location, time, instruments,and rules. Homogenized temperature records with those non-climate jumps adjusted are essential for the detection of climate change and the estimation of urbanization effects. Peterson (2003) suggested that no statistically significant impact of urbanization could be found in the homogenized temperature records over the US. Based on homogenized observations, Li et al. (2004) found that the regional average trend of urban-related warming over China for the last half century was only 0.012 °C/10 yr. In contrast, the estimates of local urban warming from those studies using unadjusted temperature observations were often much larger. A typical example is the estimation of the urbanization effect at Beijing Observatory: an early analysis based on the original temperature observations in the region estimated that the contribution of urbanization to the recorded warming trend during recent decades was 80% (Ren et al. 2007); however, having adjusted the biases in the temperature series at Beijing due to two major relocations, Yan et al. (2010) estimated the urbanization-related warming to be about 40% of the observed warming trend; and by using a more complete homogenized dataset for the region, Wang et al. (2013a) estimated that the urban warming contribution for Beijing was even less than 20%. Clearly, inhomogeneous biases in station observations served as a source of uncertainty in estimating the urban signal, though the different estimates also partly depended on how the reference stations were defined.
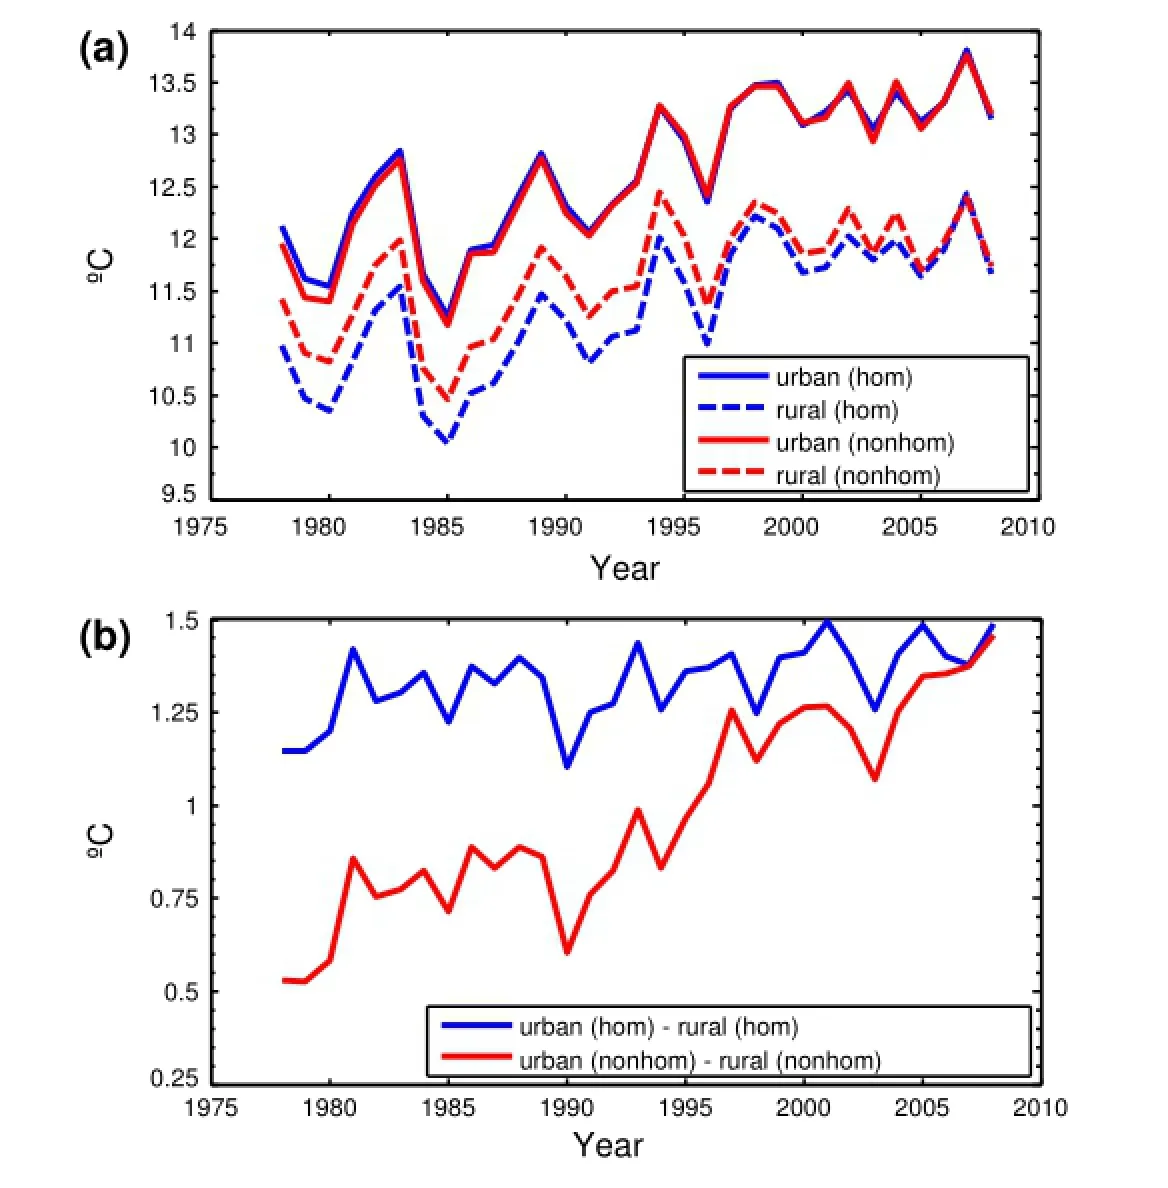
Figure 4.(a) Original (red lines) and homogenized (blue lines) surface air temperature series at urban (solid lines) and rural (dashed lines)stations in Beijing. (b) Urban—rural temperature differences determined by original (red line) and homogenized (blue line) observations,based on the daily temperature data-set in Li and Yan (2010). The urban stations include Beijing, Changping, Fengtai, Mentougou,Tongzhou, Haidian, and Shijingshan. The rural stations include Huairou, Pinggu, and Miyun. More details can be found in Wang et al.(2013a).
But why are the urban-related warming trends estimated in homogenized temperature observations smaller than in unadjusted data? In many cases, observation stations had to be relocated to more rural sites due to rapid urban development. Such relocations caused cooling biases in the original records. Thus, this kind of inhomogeneity leads to underestimation of temperature trends at rural stations and, hence, overestimation of the urbanization effect at urban stations. As shown in Figure 4(a),the rural temperature trend in the original records for the Greater Beijing region appears much weaker than in the homogenized series. This systematic bias likely results in an overestimation of urban warming at urban stations. Figure 4(b) shows that the urban—rural temperature difference increased sharply in the 1990s, which could hardly be regarded as some urbanization-related signal but due to inhomogeneity in the observation series. In fact, most of these stations have been relocated during their observing history. Detailed information can be found in Table I in Yan et al. (2010).
4. High-resolution regional modeling
Regional climate modeling can also serve as an applicable approach to the estimation of urbanization impacts. Feng et al. (2012) performed sensitivity experiments for two years to quantify the impacts of urbanization on the surface air temperature in China. Wang, Zhang, and Wang(2012) conducted a three-year high-resolution (~3.3 km)modeling study over three vast urban agglomerations in China and compared the differences between non-urban(representing a number of decades ago) and current urban cases. Their results indicated that the urbanization-induced increase in surface air temperature over the well-urbanized regions was 0.28—0.44 °C on average — smaller than those based on coarser-resolution modeling. Figure 5 shows the simulated patterns of urban warming over the three vast city clusters in China.
However, running a high-resolution regional climate model coupled with multi-decadal urbanization processes requires a great deal of computing resource. Longterm simulations using an offline land surface model is an alternative approach (Lin, Feng, and Wang 2015). A problem, however, is that current climate modeling is still barely able to represent microclimatic changes surrounding observing stations. To obtain a more reliable urbanization effect, one needs regional climate simulations at sub-kilometer resolution, highly precise landuse information and, correspondingly, sophisticated representation of physical and chemical processes in the atmospheric boundary layer over land. In addition, the estimated result is also influenced by uncertainties in the physical parameterizations of models. Nevertheless,with the explosive growth of computing power and further advances in the urban modeling sciences, more reliable quantitative estimates of the local urban warming effect are foreseeable in the near future.

Figure 5. Simulated changes in annual surface air temperature (units: °C) due to urbanization over three vast urban agglomerations in China: (a) Pearl River Delta; (b) Yangtze River Delta; (c) Beijing—Tianjin—Hebei.Source: Wang et al. (2012).
5. Conclusions
This letter reviews quantitative estimates of the urbanization warming effect in local temperature records and discusses the possible sources of uncertainty. While the urbanization-related warming in global temperature series should be negligible, that in local or regional temperature observation series for regions such in China could be considerable. Controversies remain regarding its magnitude,due to uncertainties arising from either the data or the techniques used. Recent studies suggest that the urbanization warming effect should be less than 20% of the observed warming trend for most urban stations in China for the last century, and much less for the entire region.
Many previous studies estimated the urbanization effect by comparing observed temperature trends between urban and rural stations. However, obtaining a reasonable classification of station types is a major challenge. Socioeconomic indices, satellite data, and statistical methods are commonly used techniques,but all with their limitations. One way of reducing the uncertainty in the estimation of the urbanization-related warming effect in local temperature records is establishing an integrated procedure to determine a referencestation network (Ren et al. 2015). However, this remains a difficult and debatable approach. Apart from station observations, an alternative technique involves the use of reanalysis data. However, systematic discrepancies in the MDV between observational and reanalysis data limited the power of this method.
Homogenization of the observed temperature series is also essential for the estimation of the urbanization effect. Estimates of the urbanization effect obtained using unadjusted observations are often much larger. A reason behind this arises from the fact that many stations in China have relocated at some point in their histories, in general inducing cooling biases and, hence, causing underestimation of warming trends at rural stations and overestimation of the urbanization effect at urban stations.
It should be noted that calculated urban warming trends are also influenced by the various sources of temperature data and the size of urban areas. Further understanding and quantification of urbanization-related effects in local climate records is expected through the application of high-resolution regional climate modeling,along with the gathering of high-precision information on the changing underlying surface and improvements in the representation of key urban processes in climate models.
Funding
This review was supported by the National Natural Science Foundation of China [grant number 41475078]; Strategic Priority Research Program — Climate Change: Carbon Budget and Relevant Issues of the Chinese Academy of Sciences [grant number XDA05090105].
References
Arnfield, A. J. 2003. “Two Decades of Urban Climate Research: A Review of Turbulence, Exchanges of Energy and Water, and the Urban Heat Island.” International Journal of Climatology 23: 1—26.
Böhm, R. 1998. “Urban Bias in Temperature Time Series — A Case Study for the City of Vienna, Austria.” Climatic Change 38: 113—128.
Cai, M., and E. Kalnay. 2005. “Can Reanalysis Have Anthropogenic Climate Trends without Model Forcing?” Journal of Climate 18: 1844—1849.
Cayan, D. R., and A. V. Douglas. 1984. “Urban Influences on Surface Temperatures in the Southwestern United States during Recent Decades.” Journal of Climate and Applied Meteorology 23: 1520—1530.
Chen, J., Q. Li, J. Niu, and L. Sun. 2011. “Regional Climate Change and Local Urbanization Effects on Weather Variables in Southeast China.” Stochastic Environmental Research and Risk Assessment 25: 555—565.
Chrysanthou, A., G. van der Schrier, E. J. M. van den Besselaar,A. M. G. Klein Tank, and T. Brandsma. 2014. “The Effects of Urbanization on the Rise of the European Temperature since 1960.” Geophysical Research Letters 41: 7716—7722. doi:10.1002/2014GL061154.
Chu, Z., and G. Ren. 2005. “Effect of Enhanced Urban Heat Island Magnitude on Average Surface Air Temperature Series in Beijing Region.” Acta Meteorologica Sinica 63: 534—540.
Collier, C. G. 2006. “The Impact of Urban Areas on Weather.”Quarterly Journal of the Royal Meteorological Society 132: 1—25.
Dou, H. Y., and X. Y. Zhao. 2011. “Climate Change and Its Human Dimensions Based on GIS and Meteorological Statistics in Pearl River Delta, Southern China.” Meteorological Applications 18: 111—122. doi:10.1002/met.219.
Easterling, D. R., B. Horton, P. D. Jones, T. C. Peterson, T. R. Karl, D. E. Parker, M. J. Salinger, et al. 1997. “Maximum and Minimum Temperature Trends for the Globe.” Science 277: 364—367.
Ernesto, J. 1997. “Heat Island Development in Mexico City.”Atmospheric Environment 31: 3821—3831.
Feng, J., Y. Wang, Z. Ma, and Y. Liu. 2012. “Simulating the Regional Impacts of Urbanization and Anthropogenic Heat Release on Climate across China.” Journal of Climate 25: 7187—7203.
Folland, C. K., N. A. Rayner, S. J. Brownet, et al. 2001. “Global Temperature Change and Its Uncertainties since 1861.”Geophysical Research Letters 28 (13): 2621—2624.
Gaffin, S. R., C. Rosenzweig, R. Khanbilvardi, L. Parshall, S. Mahani, H. Glickman, R. Goldberg, et al. 2008. “Variations in New York City's Urban Heat Island Strength over Time and Space.” Theoretical and Applied Climatology 94: 1—11.
Gallo, K. P., D. R. Easterling, and T. C. Peterson. 1996. “The Influence of Land Use/Land Cover on Climatological Values of the Diurnal Temperature Range.” Journal of Climate 9: 2941—2944.
Gallo, K. P., T. W. Owen, D. R. Easterling, and P. F. Jamason. 1999.“Temperature Trends of the U.S. Historical Climatology Network Based on Satellite-Designated Land Use/Land Cover.” Journal of Climate 12: 1344—1348.
Han, Z., Z. Yan, Z. Li, W. Liu, and Y. Wang. 2014. “Impact of Urbanization on Low-Temperature Precipitation in Beijing during 1960—2008.” Advances in Atmospheric Sciences 31 (1): 48—56.
Hansen, J., and S. Lebedeff. 1987. “Global Trends of Measured Surface Air Temperature.” Journal of Geophysical Research 92: 13345—13372.
Hansen, J., R. Ruedy, J. Glascoe, and M. Seto. 1999. “GISS Analysis of Surface Temperature Change.” Journal of Geophysical Research 104 (D24): 30997—31022.
Hansen, J. R., R. Ruedy, M. Seto, M. Imhoff, W. Lawrence, et al. 2001. “A Closer Look at United States and Global Surface Temperature Change.” Journal of Geophysical Research 106: 23947—23963. doi:10.1029/2001JD000354.
He, J. F., J. Y. Liu, D. F. Zhuang, W. Zhang, and M. L. Liu. 2007.“Assessing the Effect of Land Use/Land Cover Change on the Change of Urban Heat Island Intensity.” Theoretical and Applied Climatology 90: 217—226.
Hua, L., Z. Ma, and W. Guo. 2008. “The Impact of Urbanization on Air Temperature across China.” Theoretical and Applied Climatology 93: 179—194.
Huang, J., X. Liu, and Q. Li. 2004. “The Study of Relationship between Heat Island Effect and Population in Cities over South of China.” Journal of Tropical Meteorology 20: 713—722. Imhoff, M. L., W. T. Lawrence, D. C. Stutzer, and C. D. Elvidge. 1997. “A Technique for Using Composite DMSP/OLS “City Lights” Satellite Data to Map Urban Area.” Remote Sensing of Environment 61: 361—370.
Johnson, G. T., T. R. Oke, T. J. Lyons, D. G. Steyn, I. D. Watson, and J. A. Voogt, 1991: Simulation of Surface Urban Heat Island under “Ideal” Conditions at Night. Part 1: Theory and Tests against Field Data, Boundary-Layer Meteorology, 56, 275—294.
Jones, P. D., S. C. B. Raper, R. S. Bradley, H. F. Diaz, P. M. Kellyo,and T. M. L. Wigley. 1986. “Northern Hemisphere Surface Air Temperature Variations: 1851—1984.” Journal of Climate and Applied Meteorology 25: 161—179.
Jones, P. D., P. Y. Groisman, M. Coughlan, N. Plummer, W.-C. Wang,and T. R. Karl. 1990. “Assessment of Urbanization Effects in Time Series of Surface Air Temperature over Land.” Nature 347: 169—172.
Jones, P. D., D. H. Lister, and Q. Li. 2008. “Urbanization Effects in Large-Scale Temperature Records, with an Emphasis on China.” Journal of Geophysical Research 113: D16122. doi:10.1029/2008JD009916.
Kalnay, E., and M. Cai. 2003. “Impact of Urbanization and Land-Use Change on Climate.” Nature 423: 528—531.
Karl, T. R., and P. D. Jones. 1989. “Urban Bias in Area-Averaged Surface Air Temperature Trends.” Bulletin of the American Meteorological Society 70 (3): 265—270.
Karl, T. R., H. F. Diaz, and G. Kukla. 1988. “Urbanization: Its Detection and Effect in the United States Climate Record.”Journal of Climate 1: 1099—1123.
Kim, Y.-H., and J.-J. Baik. 2005. “Spatial and Temporal Structure of the Urban Heat Island in Seoul.” Journal of Applied Meteorology 44: 591—605.
Li, Z., and Z. Yan. 2010. “Application of Multiple Analysis of Series for Homogenization to Beijing Daily Temperature Series(1960—2006).” Advances in Atmospheric Sciences 27 (4): 777—787.
Li, Q., H. Zhang, X. Liu, and J. Huang. 2004. “Urban Heat Island Effect on Annual Mean Temperature during the Last 50 Years in China.” Theoretical and Applied Climatology 79: 165—174.
Li, Q., W. Li, P. Si, X. Gao, W. Dong, P. Jones, J. Huang, and L. Cao. 2010. “Assessment of Surface Air Warming in Northeast China,with Emphasis on the Impacts of Urbanization.” Theoretical and Applied Climatology 99: 469—478.
Lin, X., and S. Yu. 2005. “Interdecadal Changes of Temperature in the Beijing Region and Its Heat Island Effect.” Chinese Journal of Geophysics 48 (1): 47—54.
Lin, S., J. Feng, and J. Wang. 2015. Modeling the Impacts of Historical Urbanization on Surface Air Temperature in Three Vast Urban Agglomerations in China. Journal of Geophysical Research, submitted.
Oke, T. R. 1973. “City Size and the Urban Heat Island.” Atmospheric Environment 7: 769—779.
Oke, T. R. 1982. “The Energetic Basis of the Urban Heat Island.”Quarterly Journal of the Royal Meteorological Society 108: 1—24.
Owen, T. W., K. P. Gallo, C. D. Elvidge, and K. E. Baugh. 1998.“Using DMSP-OLS Light Frequency Data to Categorize Urban Environments Associated with US Climate Observing Stations.” International Journal of Remote Sensing 19: 3451—3456.
Parker, D. E. 2004. “Climate: Large-Scale Warming is Not Urban.”Nature 432: 290.
Parker, D. E. 2006. “A Demonstration That Large-Scale Warming is Not Urban.” Journal of Climate 19: 2882—2895.
Parker, D. E. 2010. “Urban Heat Island Effects on Estimates of Observed Climate Change.” Wiley Interdisciplinary Review: Climate Change 1: 123—133.
Peterson, T. C. 2003. “Assessment of Urban versus Rural in Situ Surface Temperatures in the Contiguous United States: No Difference Found.” Journal of Climate 16: 2941—2959.
Peterson, T. C., and T. W. Owen. 2005. “Urban Heat Island Assessment: Metadata Are Important.” Journal of Climate 18: 2637—2646.
Peterson, T. C., K. P. Gallo, J. Lawrimore, A. Huang, and D. A. McKittrick. 1999. “Global Rural Temperature Trends.” Geophysical Research Letters 26: 329—332. doi:10.1029/1998GL900322.
Portman, D. A. 1993. “Identifying and Correcting Urban Bias in Regional Time Series: Surface Temperature in China's Northern Plains.” Journal of Climate 6: 2298—2308.
Ren, Y., and G. Ren. 2011. “A Remote-Sensing Method of Selecting Reference Stations for Evaluating Urbanization Effect on Surface Air Temperature Trends.” Journal of Climate 24: 3179—3189.
Ren, G., Z. Chu, Z. Chen, and Y. Ren. 2007. “Implications of Temporal Change in Urban Heat Island Intensity Observed at Beijing and Wuhan Stations.” Geophysical Research Letters 34: L05711. doi:10.1029/2006GL027927.
Ren, G., Y. Zhou, Z. Chu, J. Zhou, A. Zhang, J. Guo, and X. Liu. 2008.“Urbanization Effects on Observed Surface Air Temperature Trends in North China.” Journal of Climate 21: 1333—1348.
Ren, G. Y., J. Li, Y. Y. Ren, Z. Y. Chu, A. Y. Zhang, Y. Q. Zhou, L. Zhang, Y. Zhang, and T. Bian. 2015. “An Integrated Procedure to Determine a Reference Station Network for Evaluating and Adjusting Urban Bias in Surface Air Temperature Data.”Journal of Applied Meteorology and Climatology 54: 1248—1266.
Trenberth, K. E. 2004. “Climatology (Communication Arising): Rural Land-Use Change and Climate.” Nature 427: 213.
Vose, R. S., T. R. Karl, D. R. Easterling, C. N. Williams, and M. J. Menne. 2004. “Climate (Communication Arising): Impact of Land-Use Change on Climate.” Nature 427: 213—214.
Wang, F., and Q. Ge. 2012. “Estimation of Urbanization Bias in Observed Surface Temperature Change in China from 1980 to 2009 Using Satellite Land-Use Data.” Chinese Science Bulletin 57: 1708—1715.
Wang, W.-C., Z. Zeng, and T. R. Karl. 1990. “Urban Heat Islands in China.” Geophysical Research Letters 17 (13): 2377—2380.
Wang, J., R. Zhang, and Y. Wang. 2012. “Areal Differences in Diurnal Variations in Summer Precipitation over Beijing Metropolitan Region.” Theoretical and Applied Climatology 110: 395—408.
Wang, J., J. Feng, Z. Yan, Y. Hu, and G. Jia. 2012. “Nested High-Resolution Modeling of the Impact of Urbanization on Regional Climate in Three Vast Urban Agglomerations in China.” Journal of Geophysical Research: Atmospheres 117: D21103. doi:10.1029/2012JD018226.
Wang, J., Z. Yan, Z. Li, W. Liu, and Y. Wang. 2013a. “Impact of Urbanization on Changes in Temperature Extremes in Beijing during 1978—2008.” Chinese Science Bulletin 58 (36): 4679—4686. doi:10.1007/s11434-013-5976-y.
Wang, J., Z. Yan, P. D. Jones, and J. Xia. 2013b. “On “Observation minus Reanalysis” Method: A View from Multidecadal Variability.” J. Geophys. Res. 118: 1—9. doi:10.1002/jgrd.50574. Wang, F., Q. Ge, S. Wang, Q. Li, and P. Jones. 2015. “A New Estimation of Urbanization's Contribution to the Warming Trend in China.” Journal of Climate 28: 8923—8938. doi:10.1175/ JCLI-D-14-00427.1.
Wu, K., and X. Yang. 2013. “Urbanization and Heterogeneous Surface Warming in Eastern China.” Chinese Science Bulletin 58: 1363—1373. doi:10.1007/s11434-012-5627-8.
Yan, Z., Z. Li, Q. Li, and P. Jones. 2010. “Effects of Site Change and Urbanisation in the Beijing Temperature Series 1977—2006.”International Journal of Climatology 30: 1226—1234.
Yang, X., Y. Hou, and B. Chen. 2011. “Observed Surface Warming Induced by Urbanization in East China.” Journal of Geophysical Research 116: D14113. doi:10.1029/2010JD015452.
Zhao, L., X. Lee, R. B. Smith, and K. Oleson. 2014a. “Strong Contributions of Local Background Climate to Urban Heat Islands.” Nature 511: 216—219.
Zhao, P., P. Jones, L. Cao, Z. Yan, S. Zha, Y. Zhu, Y. Yu, and G. Tang. 2014b. “Trend of Surface Air Temperature in Eastern China and Associated Large-Scale Climate Variability over the Last 100 Years.” Journal of Climate 27: 4693—4703.
Zhou, Y., and G. Ren. 2005. “Identifying and Correcting Urban Bias for Regional Surface Air Temperature Series of North China over Period of 1961—2000.” Clim. Environ. Res. 10: 743—753.
Zhou, L., R. E. Dickinson, Y. Tian, J. Fang, Q. Li, R. K. Kaufmann,C. J. Tucker, and R. B. Myneni. 2004. “Evidence for a Significant Urbanization Effect on Climate in China.” Proceedings of the National Academy of Sciences 101 (26): 9540—9544.
城市化; 中国; 地面气温; 均一化; 观测数据减再分析
资料方法; 不确定性
13 October 2015 Revised 1 December 2015 Accepted 7 December 2015
CONTACT YAN Zhong-Wei yzw@tea.ac.cn
© 2016 The Author(s). Published by Taylor & Francis.
This is an Open Access article distributed under the terms of the Creative Commons Attribution License (http://creativecommons.org/licenses/by/4.0/), which permits unrestricted use, distribution, and reproduction in any medium, provided the original work is properly cited.
猜你喜欢
杂志排行

Atmospheric and Oceanic Science Letters的其它文章
- Analysis of the extremely cold and heavy snowfall in North America in January 2015
- Heat budget analysis in three typical warm periods simulated by FGOALS-s2
- Cloud microphysical differences with precipitation intensity in a torrential rainfall event in Sichuan, China
- Simulated seasonal variations in nitrogen wet deposition over East Asia
- Real-data assimilation experiment with a joint data assimilation system: assimilating carbon dioxide mole fraction measurements from the Greenhouse gases Observing Satellite
- A review of recent studies on extreme heat in China