Simulated seasonal variations in nitrogen wet deposition over East Asia
2016-11-23YUJinHaiZHANGMeiGenandLIJiaLin
YU Jin-Hai, ZHANG Mei-Gen and LI Jia-Lin
State Key Laboratory of Atmospheric Boundary Layer Physics and Atmospheric Chemistry, Institute of Atmospheric Physics, Chinese Academy of Sciences, Beijing, 100083,China
Simulated seasonal variations in nitrogen wet deposition over East Asia
YU Jin-Hai, ZHANG Mei-Gen and LI Jia-Lin
State Key Laboratory of Atmospheric Boundary Layer Physics and Atmospheric Chemistry, Institute of Atmospheric Physics, Chinese Academy of Sciences, Beijing, 100083,China

ARTICLE HISTORY
Accepted 11 September 2015
precipitation; aerosol concentration
近20年来我国的酸雨和酸沉降分布发生了较大变化,其中一个重要变化是硝酸根离子明显增加,这主要是氮氧化物排放增加所导致的。为了评估氮氧化物排放对酸雨和酸沉降的影响,本文利用区域大气化学模式RAMS-CMAQ模拟分析了东亚地区氮氧化物排放、输送和化学转化过程以及降水时空变化对氮氧化物和氮沉降量时空分布的影响,并借助于中国气象台站和东亚酸沉降监测网的观测数据评估了模式结果的合理性。模拟结果显示,东亚地区氮湿沉降的季节变化十分显著,氮湿沉降通量在1~18 kg N ha-1yr-1之间;春夏两季湿沉降占全年的71%,其中夏季占42.7%。
1. Introduction
Nitrogen wet deposition is an issue of increasing importance in China. Although nitrogen deposition can supply nutrition for plants, excessive nitrogen may induce a series of problems, including soil acidification (Bowman et al. 2008), eutrophication, loss of biodiversity, air pollution,and climate change. A major source of nitrate) in rain are the nitrogen oxides (NOx) (nitric oxide + nitrogen dioxide) emitted from fossil fuel combustion, and a major source of ammonium) is ammonia (NH3) volatilized from fertilizer and the excrement of humans and animals. Economic development and population expansion have increased the demand for chemical fertilizer and fossil fuel consumption, resulting in considerable increases in nitrogen deposition.
Since its inception in 1978, the National Atmospheric Deposition Program has monitored precipitation chemistry across the United States, and the European Monitoring and Evaluation Program was developed to measure air and precipitation quality over Europe. Systematic measures have contributed to the understanding, and in some cases reduction, of nitrogen deposition in the aforementioned regions. Numerous nitrogen deposition measurement programs have been launched in China since the 1980s (Huang et al. 2010; Pan et al. 2012; Zhao et al. 2009). However, the fluxes in nitrogen wet deposition were calculated only by using a few sites. A systematic nationwidemonitoring network to obtain nitrogen deposition distribution data is absent in China, leading to insufficient information on regional-scale nitrogen deposition.
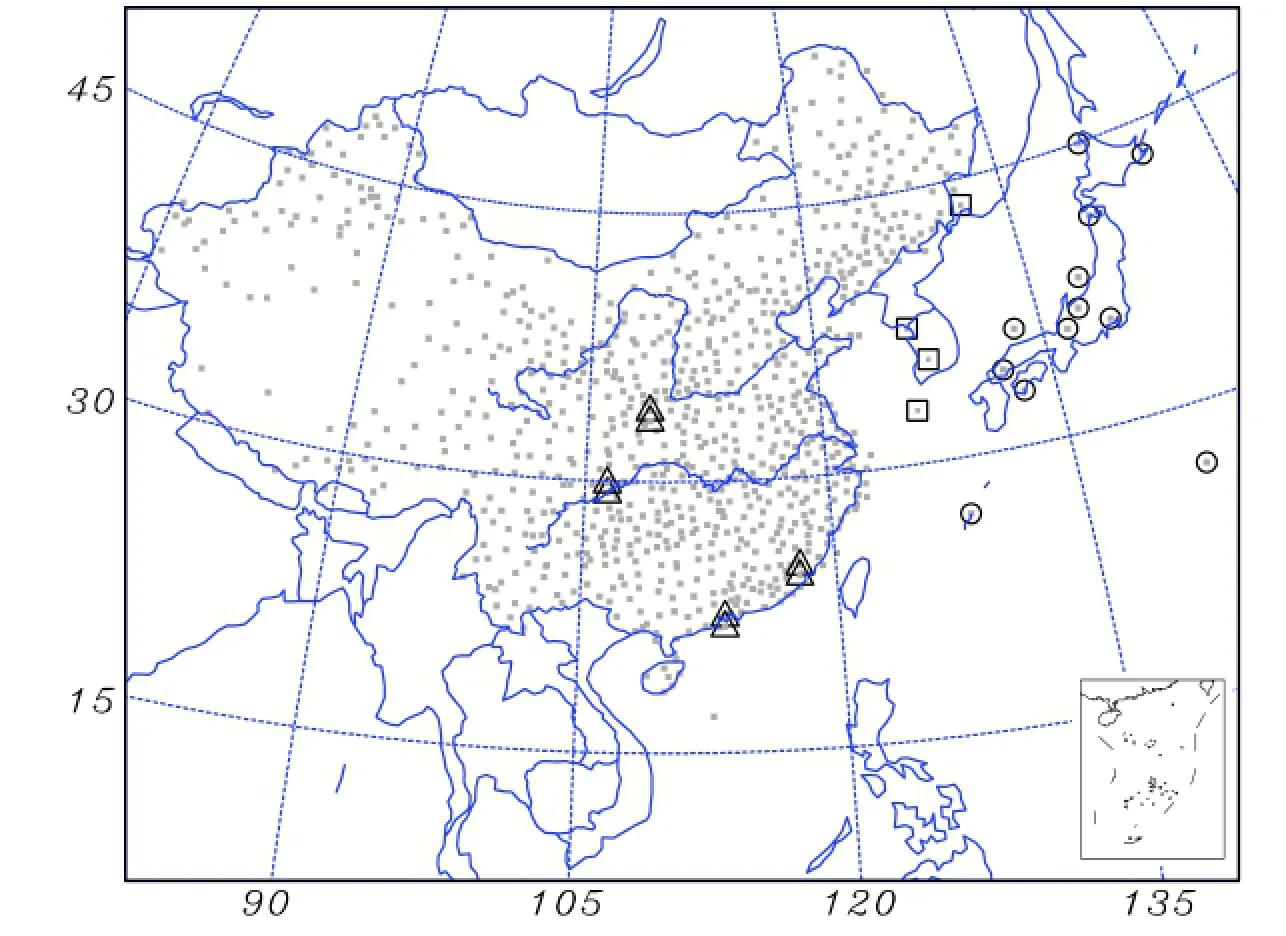
Figure 1.Locations of 839 rain gauge stations and 24 EANET stations in the model domain. Notes: Eight triangles represent stations in China, four squares represent those in Korea and Russia, and 12 circles represent those in Japan.
For quantifying spatiotemporal distributions of atmospheric nitrogen deposition, modeling tools are very useful(Simpson et al. 2014; Zhang, et al. 2012). However, no such simulations have thus far been conducted with respect to the seasonal variation in nitrogen wet deposition over China. Nitrogen deposition pattern determination and the role of anthropogenic sources in China have not been clarified. Accordingly, in the present study, the seasonal variation in nitrogen wet deposition distributions over East Asia were estimated using the Regional Atmospheric Modeling System—Community Multiscale Air Quality (RAMS—CMAQ)air quality modeling system. In the remainder of the paper,the modeling system and its input data are introduced in Section 2. In Section 3, the simulated results are evaluated based on the precipitation and concentrations of major species, and the spatial and seasonal distribution patterns of nitrogen wet deposition over East Asia are discussed. Results from analyzing the role of precipitation and aerosol concentrations, and the quantification of the relative contributions to nitrogen wet deposition fromand, are also presented. Conclusions are given in Section 4.
2. Model description
RAMS—CMAQ can concurrently simulate the atmospheric and land processes affecting the transport, transformation,and deposition of air pollutants and their precursors on both regional and urban scales. It has been used successfully to simulateand sulfate aerosol (Han et al. 2010; Zhang et al. 2007, 2012b; Zhang, Han, and Zhu 2007;Zhang, Shen, et al. 2012), in addition to wet acidic depositions (Ge et al. 2011), over East Asia. The cloud module in the modeling system includes parameterizations for several types of clouds, including sub-grid convective (precipitating and non-precipitating) and grid-scale resolved. This module can redistribute pollutants in sub-grid clouds,calculate in-cloud and precipitation scavenging, treat aqueous chemistry, and calculate wet deposition amounts.
The model domain (Figure 1) was 6,656 km × 5,440 km with a 64 km grid cell on a rotated polar stereographic map projection centered at (35°N, 110°E), which included most of East Asia. The model height of RAMS is consistent with that of CMAQ, and the lowest seven layers in the two different models are identical. In RAMS, 25 vertical layers in the σzcoordinate system are unevenly distributed from ground level to approximately 23 km, with nearly nine layers in the lowest 2 km used to simulate the planetary boundary layer. CMAQ uses 15 levels, with the lowest at approximately 100 m.
RAMS was executed in a four-dimensional data assimilation mode by using analysis nudging with re-initialization every four days, in which the first 24 h was the initialization period. The background meteorological fields for RAMS were obtained from the final analysis datasets of the National Centers for Environmental Prediction, with 1° × 1° resolution every 6 h. The boundary conditions for the RAMS calculations used weekly mean sea surface temperatures and observed monthly snow cover information.
The anthropogenic emissions (0.25° × 0.25°) of precursors and primary aerosols including carbon monoxide, carbon dioxide, NOx, sulfur dioxide, volatile organiccompounds, black carbon, organic carbon, and fine and coarse particulate matter (PM2.5, and PM10), were based on the estimates by Zhang et al. (2009) and Li et al. (2014),which included the following categories: power, industry,residential, and transport. Agricultural NH3emissions were based on the estimates by Huang et al. (2012). In addition,the boundary conditions for CMAQ were obtained from the outputs of Model for Ozone and Related Chemical Tracers, version 4 (MOZART-4).
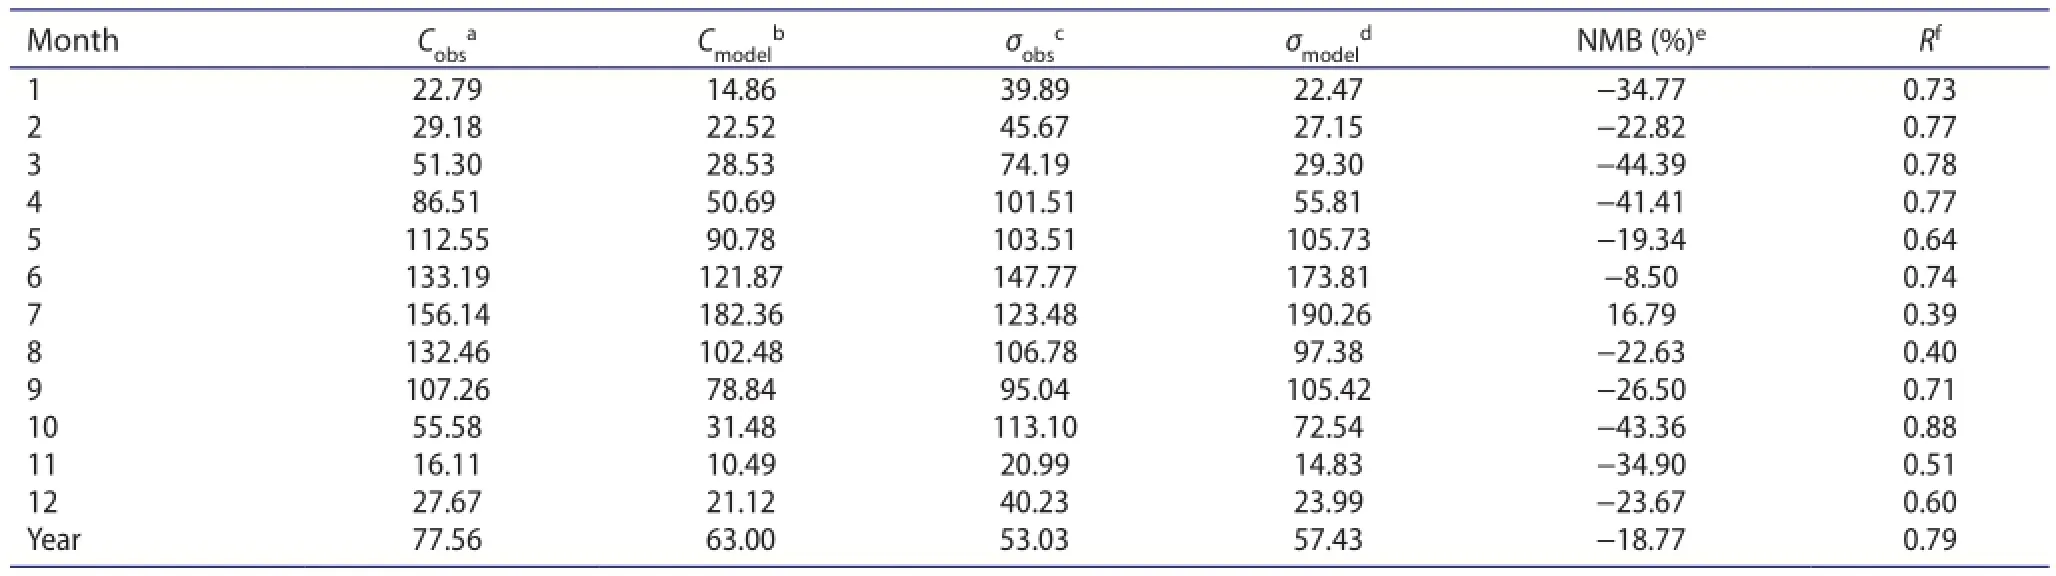
Table 1.Quantitative performance statistics for the monthly precipitation amount (mm) simulated by RAMS—CMAQ at 839 stations in China.
3. Results and discussion
3.1. Comparison of observed and simulated results
RAMS—CMAQ was executed from 26 December 2009 to 31 December 2010. The observed monthly precipitation amounts at 839 rain gauge stations in China were used in the evaluation of precipitation. The locations of these stations are shown in Figure 1. The measured concentrations of non-sea-salt sulfateat 24 EANET (Acid Deposition Monitoring Network in East Asia)stations were used to assess CMAQ. The locations of the EANET sites are also provided in Figure 1.
Table 1 shows the statistics for observed and modeled monthly precipitation amounts at 839 stations in 2010. Generally, the model simulated the observed precipitation pattern reasonably well, and the modeled annual mean precipitation, 63.00 mm, was nearly the same as that of the observation, 77.56 mm, with an annual normalized mean bias (NMB) of -18.77% and an annual mean correlation coefficient (R) of 0.79. Table 1 also shows that the model system overestimated in July, with an NMB of 16.79%, but underestimated in March (-44.39%). These discrepancies were caused mainly by uncertainties in related cumulus convection parameterizations (Huang, Zhang, and Zhu 2009).
Generally, observed rainfall gradually decreased from southeast to northwest, which was well simulated by RAMS—CMAQ (Figure 2). Seasonal precipitation variations were sharp in East Asia, with the highest amount,120 mm, occurring in summer in South China, and the lowest amount, 20 mm, occurring in winter in most of China. These temporal and spatial distribution characteristics were reasonably reproduced by the model.
In winter, modeled rainfall levels in most of China were less than 20 mm. However, substantial precipitation occurred in South China and in the coastal areas of the Japan Sea. In spring, a remarkable rise in modeled rainfall occurred across Southeast and Northeast China. During summer, high modeled rainfall mainly occurred in Northeast China, several regions between the middle reaches of the Yellow and Yangtze rivers and Southeast China, with maximum precipitation levels of more than 220 mm. Autumn is the period of transition from summer to winter monsoon. A downward precipitation trend compared with summer was revealed, although substantial precipitation still existed in the coastal regions of South China.
Figure 3 shows the fit between simulated and observed monthly mean concentrations o, andfor precipitation at the 24 EANET stations. The simulated results in Japan and Korea were in good agreement with these observations. However, obvious discrepancies between the model and observation were found in inland cities of China. Some Chinese sites are close to large cities, such as Chongqing and Xi'an, where emissions are intensive, but the regional model grid size is too large to resolve expansive emissions and terrain gradients (Li and Han 2012). The model overestimated the concentration of
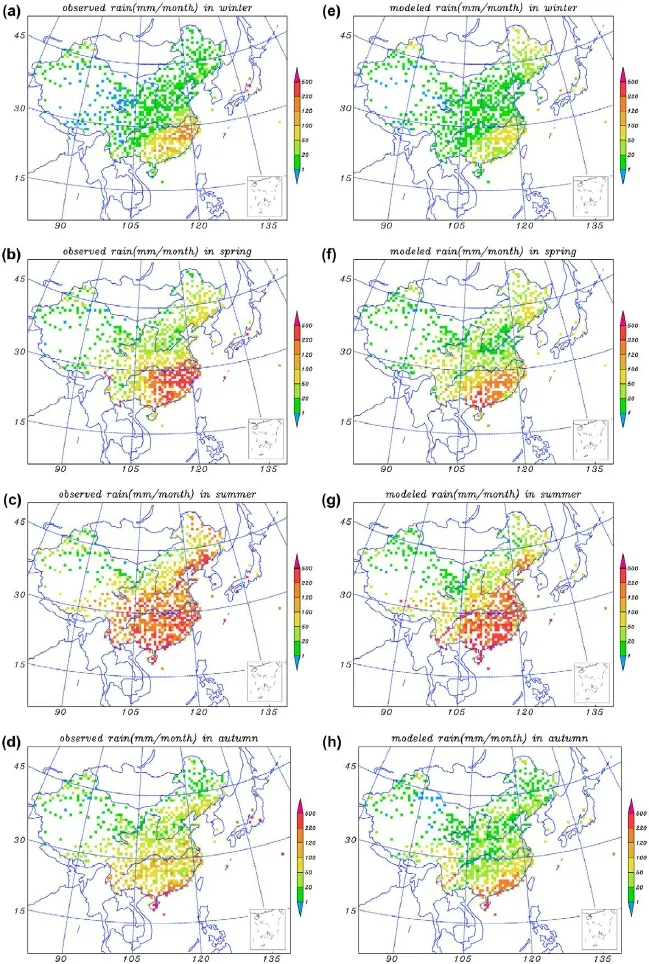
Figure 2.Observed seasonal mean precipitation amounts for (a) winter (December—February), (b) spring (March—May), (c) summer(June—August), and (d) autumn (September—November) of 2010 and simulated seasonal mean precipitation amounts for (e) winter, (f)spring, (g) summer, and (h) autumn.
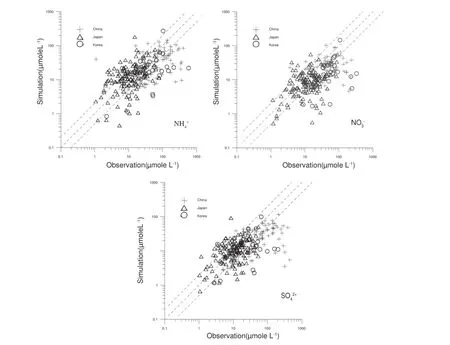
Figure 3.Comparison of observed and modeled monthly mean concentrations of, andin precipitation at 24 EANET stations. The dashed lines are 1:2 plot, 1:1 plot, and 2:1 plot.
in Tokyo. Volcanic eruptions could have produced a large amount of
, although the regional model grid size is too large for distinguishing between Tokyo values and nearby volcanic activity. In addition
simulation is relatively poor in chemical transport models. The mechanism of
formation, which is significantly more complex than that of sulfate, is not accurately described in current models. For example, obvious differences occur at coastal sites in Japan and Korea, partly because of heterogeneous reactions between nitric acid and sea salt, which may affect
formation, are not clearly understood (Li and Han 2012).
3.2. Temporal and spatial distribution ofand nitrate concentrations in precipitation
Although the distributions ofandconcentrations in precipitation were similar, the concentration of the former was higher than that of the latter. A comparison of the concentration levels in the four seasons revealed that the value in dry seasons (winter and autumn) was larger than that in rainy seasons (summer and spring). This negative relationship between rainfall and nitrogen concentrations is consistent with the results of previous studies (Huang et al. 2010). However, values in Northeast and Northwest China, where lower emissions were found, were higher in summer than those in other seasons. This result implies that long-range transport, particularly the prevalent southerly or southeasterly wind in summer, may cause elevated concentrations in remote areas downwind of polluted regions under low-precipitation conditions (An et al. 2002).
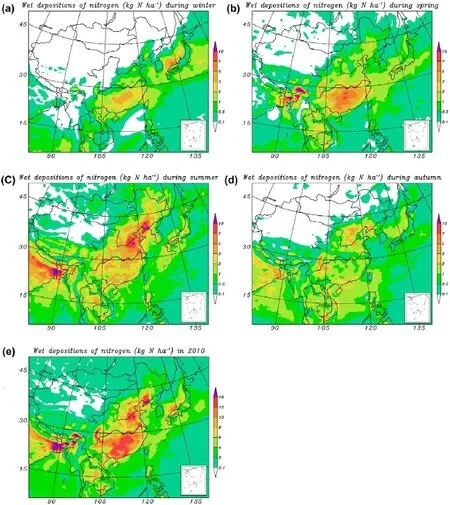
Figure 4.Modeled nitrogen) wet deposition in (a) winter (December—February), (b) spring (March—May), (c) summer (June—August), (d) autumn (September—November), and (e) throughout 2010.
3.3. Temporal and spatial distribution of nitrogen wet deposition over East Asia
The simulated wet deposition of nitrogen for winter,spring, summer, and autumn, 2010, in addition to that for the entire year, is given in Figure 4. During all seasons,higher wet deposition of nitrogen was noted in the area surrounding Sichuan Province, owing to high emissions and its particular terrain. In winter, the maximum amounts of wet deposition, the highest of which was larger than 3 kg N ha-1, were detected in the Hunan Province area and in the coastal areas of the Japan Sea. In spring, elevated amounts of wet deposition were detected along the transport path from South China through the Yellow Sea to Japan. Levels larger than 5 kg N ha-1occurred in Sichuan Province and in the southern region of the Yangtze River. In the southern foothills of the Tibetan Plateau the values were larger than 10 kg N ha-1. Because the rain belt moved northward and emissions of NH3increased in summer, the maximum, >10 kg N ha-1, was detected in the North China Plain, Shanxi Province, and Bohai Bay. Decreased amounts of nitrogen wet deposition were detected over the southern region of the Yangtze River, whereas elevated levels occurred in some regions between the Yellow and Yangtze rivers. In autumn, high nitrogen wet deposition levels greater than 3 kg N ha-1occurred near the Beijing—Tianjin—Hebei region and in Sichuan Province. The maximum magnitudes occurred mainly in the southern region of the Yangtze River during winter and spring, whereas higher levels occurred in the northern Yangtze River region during summer and autumn. This phenomenon may have been caused by differences in prevailing wind direction during the four seasons, which affects both precipitation and aerosol concentration.
In winter, high concentrations ofandin air existed in areas north of the Yangtze River, whereas substantial precipitation occurred in South China. This conflict resulted in a significantly low amount of wet deposition over China. With an increase in precipitation amount, wet deposition increased significantly in South China during spring, although the concentrations ofanddecreased slightly. In summer, a remarkable increase in rainfall occurred in the high-concentration area of North China, which caused maximum amounts of wet deposition during the four seasons. Rainfall was concentrated mainly in the south during autumn, although substantial deposition occurred in the northern region of the Yellow River. This was mainly because high concentrations ofandoccurred in that area. Precipitation and aerosol concentrations are two important factors controlling wet deposition. This analysis showed that precipitation plays a larger dominant role in seasonal variation of wet deposition.
For the year, the model results were 1—18 kg N ha-1yr-1,which is slightly greater than those reported in the U.S. High wet depositions greater than 12 kg N ha-1occurred in Bohai Bay, the North China Plain, Shanxi and Sichuan provinces, the southern region of the Yangtze River,and the southern foothills of the Tibetan Plateau. Most researchers have reported critical loads of terrestrial ecosystems at approximately 10—20 kg N ha-1yr-1(Duan et al. 2001; Grigal 2012; Lu and Tian 2007). Considering only wet deposition in this study, we conclude that nitrogen deposition exceeds the critical loads in many areas of China. Liu et al. (2011) reported that critical loads in Northeast and Northwest China are commonly very low, at less than 15 kg N ha-1yr-1. In contrast, the critical loads of nitrogen in the southeast region are relatively high (Duan et al. 2000). The highest wet depositions in Northeast China were larger than 16 kg N ha-1yr-1, which indicates that the potential risk of nitrogen saturation is higher in Northeast China than that in other regions of the country.
4. Conclusion
The RAMS—CMAQ modeling system was employed to simulate seasonal variations in nitrogen wet deposition in East Asia recorded in 2010. Comparison of the simulated and observed precipitation for the various seasons showed that RAMS can reproduce major precipitation zones and dry areas. Comparison of modeled and observed major ionic species showed that the simulation generally reproduced the major features observed for wet deposition,with most of the scatter falling within the reference lines within a factor of 2.
The annual nitrogen wet deposition fluxes over China ranged from 1 to 18 kg N ha-1yr-1in 2010. It was also found that the annual total wet deposition of nitrogen in mainland China was 3.9 Tg N yr-1. The main nitrogen in wet deposition wasaccounting for 65.76% of the total amount,indicating a relative larger effect of agriculture activities. Nitrogen wet deposition in the summer accounted for 42.7% of the annual total. The present analysis shows that precipitation and aerosol concentrations are major factors controlling the seasonal variation in wet deposition.
Funding
This study was supported by the National Basic Research Program of China [grant number 2014CB953802]; the “Strategic Priority Research Program (B)” of the Chinese Academy of Sciences [grant numbers XDB05030105, XDB05030102, and XDB05030103].
References
An, J. L., H. Ueda, Z. F. Wang, K. Matsuda, M. Kajino, and X. J. Cheng. 2002. “Simulations of Monthly Mean Nitrate Concentrations in Precipitation over East Asia.” Atmospheric Environment 36: 4159—4171. doi:10.1016/S1352-2310(02)00412-0.
Bowman, W. D., C. C. Cleveland, Ĺuboš Halada, J. Hreško, and J. S. Baron. 2008. “Negative Impact of Nitrogen Deposition on Soil Buffering Capacity.” Nature Geoscience 1: 767—770. doi:10.1038/Ngeo339.
Duan, L., S. D. Xie, Z. P. Zhou, and J. M. Hao. 2000. “Critical Loads of Acid Deposition on Soil in China.” Water, Air, and Soil Pollution 118: 35—51. doi:10.1023/A:1005197414074.
Duan, L., S. D. Xie, Z. P. Zhou, X. M. Ye, and J. M. Hao. 2001.“Calculation and Mapping of Critical Loads for S, N and Acidity in China.” Water, Air, and Soil Pollution 130: 1199—1204. doi:10.1023/A:1013908629150.
Ge, C., M. G. Zhang, L. Y. Zhu, X. Han, and J. Wang. 2011. “Simulated Seasonal Variations in Wet Acid Depositions over East Asia.”Journal of the Air and Waste Management Association 61: 1246—1261. doi:10.1080/10473289.2011.596741.
Grigal, D. F. 2012. “Atmospheric Deposition and Inorganic Nitrogen Flux.” Water, Air, and Soil Pollution 223: 3565—3575. doi:10.1007/s11270-012-1128-2.
Han, X., M. G. Zhang, Z. W. Han, J. Y. Xin, L. L. Wang, J. H. Qiu,and Y. J. Liu. 2010. “Model Analysis of Aerosol Optical Depth Distributions over East Asia.” Science China Earth Sciences 53: 1079—1090. doi:10.1007/s11430-010-3079-z.
Huang, X., Y. Song, M. M. Li, J. F. Li, Q. Huo, X. H. Cai, T. Zhu, M. Hu,and H. S. Zhang. 2012. “A High-Resolution Ammonia Emission Inventory in China.” Global Biogeochemical Cycles 26: GB1030. doi:10.1029/2011gb004161.
Huang, D. Y., Y. G. Xu, B. Zhou, H. H. Zhang, and J. B. Lan. 2010.“Wet Deposition of Nitrogen and Sulfur in Guangzhou, a Subtropical Area in South China.” Environmental Monitoring and Assessment 171: 429—439. doi:10.1007/s10661-009-1289-7.
Huang, A. N., Y. C. Zhang, and J. Zhu. 2009. “Effects of the Physical Process Ensemble Technique on Simulation of Summer Precipitation over China.” Acta Meteorologica Sinica 23: 713—724.
Li, J. W., and Z. W. Han. 2012. “A Modeling Study of Seasonal Variation of Atmospheric Aerosols over East Asia.” Advances in Atmospheric Sciences 29: 101—117. doi:10.1007/s00376-011-0234-1.
Li, K. H., X. J. Liu, W. Song, Y. H. Chang, Y. K. Hu, and C. Y. Tian. 2013. “Atmospheric Nitrogen Deposition at Two Sites in an Arid Environment of Central Asia.” Plos One 8: e67018. doi:10.1371/journal.pone.0067018.
Li, M., Q. Zhang, D. G. Streets, K. B. He, Y. F. Cheng, L. K. Emmons,and H. Huo. 2014. “Mapping Asian Anthropogenic Emissions of Non-Methane Volatile Organic Compounds to Multiple Chemical Mechanisms.” Atmospheric Chemistry and Physics 14: 5617—5638. doi:10.5194/acp-14-5617-2014.
Liu, X. J., L. Duan, J. M. Mo, E. Z. Du, J. L. Shen, X. K. Lu, and Y. Zhang. 2011. “Nitrogen Deposition and Its Ecological Impact in China: An Overview.” Environmental Pollution 159: 2251—2264. doi:10.1016/j.envpol.2010.08.002.
Lu, C. Q., and H. Q. Tian. 2007. “Spatial and Temporal Patterns of Nitrogen Deposition in China: Synthesis of Observational Data.” Journal Geophysical Research: Atmosphere 112: D22S05. doi:10.1029/2006jd007990.
Pan, Y. P., Y. S. Wang, G. Q. Tang, and D. Wu. 2012. “Wet and Dry Deposition of Atmospheric Nitrogen at Ten Sites in Northern China.” Atmospheric Chemistry and Physics 12: 6515—6535. doi:10.5194/acp-12-6515-2012.
Simpson, D., C. Andersson, J. H. Christensen, M. Engardt, C. Geels, A. Nyiri, and M. Posch. 2014. “Impacts of Climate and Emission Changes on Nitrogen Deposition in Europe: A Multi-Model Study.” Atmospheric Chemistry and Physics 14: 6995—7017. doi:10.5194/acp-14-6995-2014.
Zhang, M. G., L. J. Gao, C. Ge, and Y. P. Xu. 2007. “Simulation of Nitrate Aerosol Concentrations over East Asia with the Model System RAMS-CMAQ.” Tellus B 59: 372—380. doi:10.1111/ j.1600-0889.2007.00255.x.
Zhang, M. G., Z. W. Han, and L. Y. Zhu. 2007. “Simulation of Atmospheric Aerosols in East Asia Using Modeling System RAMS-CMAQ: Model Evaluation.” China Particuology 5: 321—327. doi:10.1016/j.cpart.2007.07.002.
Zhang, L., D. J. Jacob, E. M. Knipping, N. Kumar, J. W. Munger,C. C. Carouge, and A. van Donkelaar. 2012. “Nitrogen Deposition to the United States: Distribution, Sources, and Processes.” Atmospheric Chemistry and Physics 12: 4539—4554. doi:10.5194/acp-12-4539-2012.
Zhang, H., Z. Shen, X. Wei, M. Zhang, and Z. Li. 2012. “Comparison of Optical Properties of Nitrate and Sulfate Aerosol and the Direct Radiative Forcing due to Nitrate in China.” Atmospheric Research 113: 113—125. doi:10.1016/j.atmosres.2012.04.020.
Zhang, Q., D. G. Streets, G. R. Carmichael, K. B. He, H. Huo, A. Kannari, and Z. Klimont. 2009. “Asian Emissions in 2006 for the NASA INTEX-B Mission.” Atmospheric Chemistry and Physics 9: 5131—5153.
Zhao, X., X. Y. Yan, Z. Q. Xiong, Y. X. Xie, G. X. Xing, S. L. Shi, Z. L. Zhu. 2009. “Spatial and Temporal Variation of Inorganic Nitrogen Wet Deposition to the Yangtze River Delta Region,China.” Water, Air, and Soil Pollution 203: 277—289. doi:10.1007/ s11270-009-0011-2.
7 August 2015
CONTACT ZHANG Mei-Gen mgzhang@mail.iap.ac.cn
© 2016 The Author(s). Published by Taylor & Francis.
This is an Open Access article distributed under the terms of the Creative Commons Attribution License (http://creativecommons.org/licenses/by/4.0/), which permits unrestricted use, distribution, and reproduction in any medium, provided the original work is properly cited.
猜你喜欢
杂志排行

Atmospheric and Oceanic Science Letters的其它文章
- Analysis of the extremely cold and heavy snowfall in North America in January 2015
- Heat budget analysis in three typical warm periods simulated by FGOALS-s2
- Cloud microphysical differences with precipitation intensity in a torrential rainfall event in Sichuan, China
- Real-data assimilation experiment with a joint data assimilation system: assimilating carbon dioxide mole fraction measurements from the Greenhouse gases Observing Satellite
- A review of recent studies on extreme heat in China
- Warming over the North Pacific can intensify snow events in Northeast China