Applicability of an eddy covariance system based on a close-path quantumcascade laser spectrometer for measuring nitrous oxide fluxes from subtropical vegetable fields
2016-11-23WANGDongWANGKiEugenioAZPINZHENGXunhundKlusBUTTERBACHBAHL
WANG Dong, WANG Ki, Eugenio DÍAZ-PINÉS, ZHENG Xunhund Klus BUTTERBACH-BAHL
aState Key Laboratory of Atmospheric Boundary Layer Physics and Atmospheric Chemistry, Institute of Atmospheric Physics, Chinese Academy of Sciences (IAP-CAS), Beijing, China;bCollege of Earth Science, University of Chinese Academy of Sciences, Beijing, China;cInstitute of Meteorology and Climate Research, Atmospheric Environmental Research, Karlsruhe Institute of Technology, Garmisch-Partenkirchen, Germany
Applicability of an eddy covariance system based on a close-path quantum
cascade laser spectrometer for measuring nitrous oxide fluxes from subtropical vegetable fields
WANG Donga,b, WANG Kaia, Eugenio DÍAZ-PINÉSc, ZHENG Xunhuaaand Klaus BUTTERBACH-BAHLc
aState Key Laboratory of Atmospheric Boundary Layer Physics and Atmospheric Chemistry, Institute of Atmospheric Physics, Chinese Academy of Sciences (IAP-CAS), Beijing, China;bCollege of Earth Science, University of Chinese Academy of Sciences, Beijing, China;cInstitute of Meteorology and Climate Research, Atmospheric Environmental Research, Karlsruhe Institute of Technology, Garmisch-Partenkirchen, Germany
The soil of subtropical vegetable felds is an important source of the atmospheric greenhouse gas nitrous oxide (N2O). In a feld study in subtropical China, the authors used an eddy covariance (EC)system based on a close-path quantum cascade laser (QCL) spectrometer to measure N2O fuxes from a vegetable feld. During the experimental period from 9 October 2014 to 18 February 2015,the observed half-hourly N2O fuxes ranged from -10.7 to 1077.4 μg N m-2h-1, with a mean value of 99.3 μg N m-2h-1. The detection limit (95% confdence level) of the EC system for half-hourly fuxes was estimated at 18.5 μg N m-2h-1, i.e. smaller than 97.5% of all measured fuxes, and within the range of the lower limit of reported N2O emissions from subtropical vegetable felds. The random uncertainties in the half-hourly fuxes were estimated at 60% on average, of which 62% was due to stochastic variations caused by turbulence and 38% by instrumental noise. The fux systematic uncertainties were estimated at -18% on average, mainly due to the spectral attenuation; however,this negative bias had already been corrected for by calculating half-hourly fuxes. In conclusion,the close-path QCL-based EC technique is capable of measuring the N2O fuxes from the subtropical vegetable felds of China with high reliability and accuracy.
ARTICLE HISTORY
Revised 11 May 2016
Accepted 13 May 2016
Nitrous oxide; fux; quantum cascade laser; eddy covariance; subtropical vegetable feld
亚热带蔬菜地是氧化亚氮 (N2O) 的重要排放源, 本研究首次采用基于闭路量子级联激光吸收光谱仪的涡动相关 (QCLAS-EC) 法观测亚热带蔬菜地秋冬季非施肥阶段的N2O排放通量, 以评估QCLAS-EC法测量亚热带蔬菜地N2O通量的适用性。结果表明, QCLAS-EC观测系统在野外条件下能长期稳定运行, 可观测到N2O排放的季节变化趋势, 其检测限为18.5 μg N m-2h-1(95%置信水平), 试验期间获得的97.5%的N2O通量大于此检测限, 表明QCLAS-EC观测系统可有效并准确测量亚热带蔬菜地的N2O排放通量, 仪器本身的灵敏度不是通量检测的限制因素。
1. Introduction
Nitrous oxide (N2O) is a very important greenhouse gas(IPCC 2007). Agricultural soils have been identifed as the dominant source of anthropogenic N2O emissions, contributing approximately 1.7-4.8 Tg N yr-1on the global scale(IPCC 2006). Emissions from agricultural soils are mainly due to the intensive use of nitrogen fertilizers. However,there are signifcant uncertainties in estimated N2O emissions at both regional and global scales, mainly due to the lack of fux data for representative crop and management systems.
During the last two decades there has been rapid development in the application of fast response N2O analyzers based on spectroscopic techniques, e.g. the tunable diode laser (TDL) spectrometer and the quantum cascade laser(QCL) spectrometer. Due to the achieved gains in measuring sensitivity, N2O fuxes for diferent ecosystems can now be measured by the micrometeorological method of eddy covariance (EC) (e.g. Kroon et al. 2007; Wang et al. 2013). As compared to other commonly used techniques,e.g. the static chamber method, the EC technique has the advantage of providing spatially averaged fuxes at the feld scale without disturbing the environment of the measured objects, and also produces temporally continuous data (Wang et al. 2013).
The production of vegetables under subtropical climate conditions has been identifed as a major source of atmospheric N2O (e.g. Mei et al. 2011; Yao et al. 2015; Zhang et al. 2016). These studies have shown that the lowest level of N2O emissions from subtropical vegetable felds rangesfrom 10 to 30 μg N m-2h-1, usually occurring during the non-fertilization period in winter due to lower temperature and lowered soil nitrogen availability, as compared to the vegetable growing seasons. However, none of the above studies were carried out using the EC technique. First attempts at measuring soil N2O fuxes from crop felds using the EC technique with a close-path TDL spectrometer (Wang et al. 2013) were found to be not entirely satisfactory, because the detection limit of 37.6 μg N m-2h-1for half-hourly N2O fuxes was too high to measure fuxes in low-emissions periods. The question therefore arises as to whether an EC method based on the state-of-the-art closepath QCL approach might reliably measure the lowest level of N2O fuxes from subtropical vegetable felds.
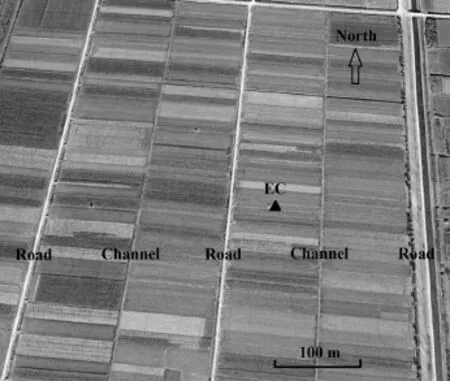
Figure 1.Satellite image of the experimental felds on 19 December 2014 (source: Google Earth).
In this study, we assembled an EC system linked to a close-path N2O analyzer based on a QCL spectrometer(model QC-TILDAS-DUAL, Aerodyne Research Inc., U.S.A)to measure N2O fuxes from a vegetable feld in subtropical China. Compared with the traditional laser spectrometer,this type of laser is more sensitive and carries a number of other advantages such as compactness, high selectivity in operating frequencies, and without using liquid-nitrogen for laser cooling. QCL instruments have been previously used for N2O fux measurements on managed grasslands(Kroon et al. 2007; Neftel et al. 2007, 2010; Merbold et al. 2014) and agricultural felds (Huang et al. 2014; Rannik et al. 2015). However, the performance of the laser in these studies varied due to many factors, such as the wavelength and mode of the laser adopted during operation, the feld and environmental conditions, and the manner of the daily maintenance applied by the instrument users, which led to diferences in the performance of the QCL-EC system. Therefore, the aims of this study were to evaluate the applicability of the QCL-EC technique for measuring N2O fuxes from vegetable felds in subtropical China, as well as to investigate the characteristics of the N2O emissions during the non-fertilization period and assess fux uncertainties.
2. Field measurements and data processing
2.1. Field site
Field measurements were conducted on a vegetable feld located in the suburbs of Yueyang, Hunan, China((29°30′21.24′′N, 112°53′42.95′′E), 29 m MSL). The site has a subtropical monsoon climate with a hot and rainy summer and a temperate winter. The mean annual temperature is 17.0 °C, while the mean annual precipitation is 1,260 mm. The soil of the site is classifed as sandy loam,with a pH 7.0-8.0 in the top layer of 10 cm. As is usual for this region, the vegetable feld was divided into many plots managed by diferent farmers (Figure 1). Vegetables(cabbage, hot pepper, or pumpkin) are grown in two consecutive seasons, which normally start in March and August, respectively. Nitrogen fertilizers are applied at the beginning of both seasons at a rate of 300-400 kg N ha-1. Our measurements began in early October 2014, when all plots were still planted with cabbages (maximum canopy height: 0.35 m), and with nitrogen fertilization having already commenced two months earlier, meaning it was unlikely to have had any substantial efect on N2O emissions during this period. Due to management diferences, the date of cabbage harvest for the plots within the EC footprint varied from mid-October to mid-December,which led to spatial heterogeneity in the canopy height from 0.10 to 0.35 m during this period. Following harvest,the felds were left fallow until the end of the measuring campaign.
2.2. Field measurements
N2O fux measurements were taken from 9 October 2014 to 18 February 2015. We used an EC system consisting of a QCL gas analyzer (QC-TILDAS-DUAL, Aerodyne Research Inc., U.S.A.), a three-dimensional sonic anemometer(CSAT3, Campbell Scientifc Inc., U.S.A.), a scroll vacuum pump (XDS35i, BOC Edwards, U.K.), a data logger (CR3000,Campbell Scientifc Inc., U.S.A.), and a sampling tube. The gas analyzer was equipped with a 76-m multi-path sample cell and two QC lasers, with one of them operating with a continuous wave at a wave number of 2,246.3 cm-1for N2O detection. It was placed in a house equipped with an air conditioner. The house was located to the east of the mast to avoid fow distortion. The sonic anemometer was mounted on the mast, 2.3 m above the ground, from9 October to 15 November 2014, and was then lowered to 2 m until the end of the experiment. The air inlet was installed 12 cm to the east of the sonic anemometer. The vacuum pump was used to draw ambient air to the multi-pass cell via an 11 m-long Tefon tube (inner diameter: 6.4 mm) at a nominal fow rate of 15 l min-1. To avoid water condensation, the tube was heated and coated with heat insulation material. Besides, inlet flters (polycarbonate;pore size: 0.45 μm) were added to prevent contamination of the multi-pass mirrors. The pressure of the sample cell was kept at around 53.2 hPa, and the flters were replaced regularly. Automatic zero calibration was implemented on the QCL every 4 h using pure N2. We released a standard gas of 380 nmol mol-1of N2O in N2/O2into the sample cell at the beginning and the end of the campaign. The measured N2O difered less than 5% from the standard concentration. Therefore, no further span calibration was performed. Data from the sonic anemometer and the QCL were simultaneously stored in the data logger at a frequency of 10 Hz.
A meteorological station (WS3000, Beijing Techno Solutions, China) was used to observe the environmental conditions every 30 min, including the air and soil (5 cm depth) temperature, precipitation, and solar radiation. The volumetric water content of the soil (0-6 cm) was measured manually every day with a portable probe (ML2x,Delta-T Devices, U.K.). The volumetric records were converted into water-flled pore space (WFPS) using a theoretical particle density of 2.65 g cm-3and the bulk density of the measured soil.
2.3. Flux calculation and quality control
In this study, the EddyPro software (Li-COR, U.S.A.) was used for fux calculation and correction. The vertical N2O fux was calculated as
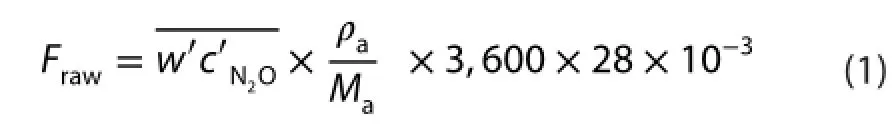
where Frawis the raw turbulent fux (μg N m-2h-1); w′ andrepresent the instantaneous deviations of the vertical wind velocity (m s-1) and N2O concentration (nmol mol-1)from the mean values, respectively; the overbar indicates the averaging period of 30 min; ρais the air density(kg m-3); Mais the molar mass of air (0.029 kg mol-1), 3,600 denotes 3,600 s h-1, and 28 is the molar mass of two N atoms in N2O (g mol-1).
The routine schemes proposed by Aubinet et al. (2000)were used to calculate the covariance in Equation (1), which included the steps of spike detection, double rotation of wind components, lag-time compensation, block averaging, and de-trending. The fux correction due to water dilution efect(Webb, Pearman, and Leuning 1980) and water broadening line efect (Neftel et al. 2010) were ignored, because the Aerodyne analyzer simultaneously measured the water vapor and reported the mixing ratio of N2O with respect to dry air with an empirical algorithm (Rannik et al. 2015). The methods proposed by Moncrief et al. (2004) and Ibrom et al. (2007)were used to correct the fux losses in the low and high ranges of the spectra, respectively.
The half-hourly N2O fuxes were quality controlled using the following steps: First, fux records during instrument maintenance were discarded. Second, fuxes assigned with a quality fag of ‘2’ were rejected after stationarity and integral turbulence characteristic tests (Mauder and Foken 2004). Third, nighttime fuxes with weak wind conditions were fltered out using a friction velocity threshold of 0.12 m s-1, according to the method proposed by Gu et al.(2005). Fourth, fux outliers were removed if they exceeded three times the standard deviation in a window of one day. Finally, fuxes that were more negative than the lower detection limit of the EC system were rejected, based on the assumption that signifcant N2O uptake in agroecosystems with extensive nitrogen fertilizer input is not well explained by common knowledge; the determination of the detection limit of the EC system is described in the following section.
2.4. Estimation of random uncertainty
The random uncertainties in the measured N2O fuxes(δF) were mainly produced by the stochastic characteristics of the turbulence (δF_turb) and the instrumental noise(δF_noise). In this study, δFwas calculated using Equation(8) in Finkelstein and Sims (2001). The component δF_noisecan also be regarded as the detection limit of the EC system (Rannik et al. 2015), which can be estimated as δF_noise=2σw×2σc×(fT)-1/2, here f is the measurement frequency; T is the averaging time; σwand σcrepresent the noise level of the vertical wind speed and the N2O concentration, respectively; and the factor of 2 represents the detection limit at the 95% confdence level.
3. Results and discussion
3.1. Environmental conditions and N2O fluxes
The daily mean air temperature ranged from -0.3 to 22.0 °C, with a mean value of 10.2 °C, during the campaign. The variation pattern of the daily mean soil temperature was similar to that of the air temperature (Figure 2(a)). During the experiment from 6 October 2014 to 18 February 2015, precipitation totaled 424.6 mm. Changes in WFPS were closely related with rainfall events (Figure 2(b)).The sonic data showed that nearly 80% of the winds during the campaign came from northern directions (0°-60° and 300°-360°).

Figure 3.Time series of the 10 Hz N2O mixing ratio (grey dots)and the corresponding Allan variance plot (black line) under feld conditions.
We collected a total of 5944 half-hourly N2O fuxes during the campaign. 3761 of the fux data remained following the frst four quality control steps described above, and a further 19 were rejected after the ffth step. This resulted in a fnal data coverage of 58.2%. The emissions were characterized by bursts of higher fuxes after rainfall and by lower fuxes during other periods; and the minimum,median, mean, and maximum values of the half-hourly fuxes were -10.7, 60.8, 99.3, and 1077.4 μg N m-2h-1,respectively (Figure 2(c)). The coefcient of variation of the half-hourly fuxes within each day varied between 10% and 169%, with a mean value of 44%. The daily fuxes that averaged over the half-hourly data ranged from 21.8 to 676.0 μg N m-2h-1(Figure 2(d)), which were well correlated with the variation of the WFPS (data not shown). According to footprint analysis (Kormann and Meixner 2001), 90% of the fuxes were coming from the area 80-100 m away from the EC mast under unstable conditions. The fetch was long enough even for stable conditions because the borders of the vegetable feld in the upwind directions were more than 200 m away.
3.2. Performance of the EC measuring system
Using the Allan variance technique (Werle, Miike, and Slemr 1993), we estimated the precision of the QCL spectrometer to be 0.26 nmol mol-1at a sampling rate of 1 Hz under feld conditions (Figure 3). This piece of data was collected in the afternoon of 20 December 2014, when turbulence was well developed and N2O emissions were weak. Although the precision may have been even better by taking samples of standard gas, it was very close to the average estimates (0.31 ± 0.29 nmol mol-1at 1 Hz)reported by previous studies that applied this kind of QCL analyzer (Kroon et al. 2007; Neftel et al. 2007, 2010; Huang et al. 2014; Rannik et al. 2015).


Figure 4.Normalized co-spectra of the vertical wind speed and N2O (solid circles) during the period (a) 1000-1530 BT 2 December 2014, and (b) 1230-1700 BT 17 February 2015. Both periods were under unstable conditions, with Monin-Obukhov length L < 0 and friction velocity u*> 0.15 m s-1.
During previous feld experiments based on chamber measurements, it has been found that the lowest N2O emissions from subtropical vegetable felds normally occur during winter, with fuxes being in the range of 10-30 μg N m-2h-1(e.g. Mei et al. 2011; Yao et al. 2015;Zhang et al. 2016). The detection limit of our instrument(95% confdence level) was within this range, indicating that the current EC system can reliably measure N2O fuxes from subtropical vegetable felds all year around, except for a short period in winter in some cases. Moreover, the detection limit can be improved by regular optical alignment and mirror cleaning, as suggested by the manufacturer (Aerodyne), since the current instrumental noise of the QCL was one to two times larger than that in the instrumental specifcation. This means that in future work the sensitivity and performance of the EC system can be potentially improved.
3.3. Co-spectra
In general, N2O fuxes measured by the EC system were underestimated due to data acquisition and processing and the non-ideal measuring system (e.g. Moore 1986). This can be illustrated by the co-spectra attenuation in the low and high frequency ranges. We analyzed the co-spectra of N2O and vertical wind velocity during the periods of 1000-1530 Beijing Time (BT) 2 December 2014(Figure 4(a)) and 1230-1700 BT 17 February 2015(Figure 4(b)). The results were averaged to achieve better statistics of the co-spectra, and were obtained under unstable conditions with a Monin-Obukhov length L of less than 0 and a friction velocity u*of greater than 0.15 m s-1. The theoretical undamped co-spectra according to Kaimal et al.(1972) and the temperature co-spectra are also presented in Figure 4. We noticed that the temperature co-spectra were smooth and had almost no damping along the entire frequency range. The pattern of the N2O co-spectra was almost consistent with the theoretical one, as well as the temperature co-spectra, but disagreed slightly at the high frequency ends, indicating losses of fuxes. According to the methods introduced by Moncrief et al. (2004) and Ibrom et al. (2007), the fnal N2O fuxes were corrected for this systematic underestimation by on average of 18%. The magnitude of the co-spectra correction agreed with the results reported by Huang et al. (2014).
The two periods we analyzed had diferent canopy conditions. The underlying surface of the major footprint area was fat on 17 February 2015. However, the feld was much rougher on 2 December 2014, owing to the presence of cabbage plants in two feld plots in the northern direction of the EC mast. We compared the co-spectra behavior of the two periods, since the spectral pattern may have been distorted due to the drag produced by the cabbages. However, we did not fnd a signifcant difference between the two curves of the N2O co-spectra in Figure 4. Nevertheless, we do not have adequate evidence to quantify the infuence of the heterogeneous surface on fux measurements.
3.4. Random uncertainty of the fluxes
The total relative random uncertainty of the half-hourly N2O fuxes varied greatly. Most of the estimates were smaller than 150%, and the mean value was 57% (95% confdence level). Meanwhile, the random uncertainties caused by the turbulence characteristics and instrumental noise contributed 62% and 38% to the total, respectively. Rannik et al. (2015) used a similar N2O gas analyzer,but equipped with only one laser (model CW-TILDAS-CS,Aerodyne Research Inc., U.S.A.) for EC measurements, and used the same method for random uncertainty estimation. They reported that the mean relative random uncertainty was around 120% while applying a confdence level of 95%. Since the relative estimates depend on the fux magnitude, the absolute fux random uncertainty in this study was on average twice as large as the one reportedin Rannik et al. (2015). The diference can be explained by the lower instrumental noise and more homogeneous underlying surface in their study.
4. Conclusions
The close-path QCL-based EC system was running smoothly during the whole experimental period, with a mean detection limit of 18.5 μg N m-2h-1for half-hourly N2O fuxes. Although this precision was within the range of the lower limit of the N2O emissions from the subtropical vegetable felds of China reported by previous chamber studies, the EC system detected more than 97% of the half-hourly fuxes from the vegetable felds of the current study, as the magnitude of fuxes was mostly higher than the detection limit. The random and systematic uncertainties in the measured N2O fuxes were within the same order of magnitude as those reported by other studies that utilized similar QCL gas analyzers. We conclude that the QCL-based EC system is capable of reliably measuring N2O fuxes from vegetable felds in subtropical China. This useful tool will enable future work related to biosphere-atmosphere exchanges of N2O in a wide range of agricultural and natural ecosystems.
Acknowledgements
The authors thank YAO Zhisheng, LIU Chunyan, WANG Rui, and LI Ping from IAP-CAS, and David NELSON and Stanley HUANG from Aerodyne, for their generous help with this work.
Disclosure statement
No potential confict of interest was reported by the authors.
Funding
This work was supported from the Ministry of Science and Technology of China [grant number 2012CB417106]; the Chinese Academy of Sciences [grant number XDA05020100]; the German Science Foundation [contract number BU1173/12-1]; and the National Natural Science Foundation of China [grant numbers 41405137 and 41321064].
References
Aubinet, M., A. Grelle, A. Ibrom, Ü. Rannik, J. Moncrief, T. Foken,A. S. Kowalski, et al. 2000. “Estimates of the Annual Net Carbon and Water Exchange of European Forests: The EUROFLUX Methodology.” Advances in Ecological Research 30: 113-175.
Finkelstein, P. L., and P. F. Sims. 2001. “Sampling Error in Eddy Correlation Flux Measurements.” Journal of Geophysical Research: Atmospheres 106: 3503-3509.
Gu, L., E. M. Falge, T. Boden, D. D. Baldocchi, T. A. Black,S. R. Saleska, T. Suni, et al. 2005. “Objective Threshold Determination for Nighttime Eddy Flux Filtering.” Agricultural and Forest Meteorology 128: 179-197.
Huang, H., J. Wang, D. Hui, D. R. Miller, S. Bhattarai, S. Dennis,D. Smart, T. Sammis, and K. C. Reddy. 2014. “Nitrous Oxide Emissions from a Commercial Cornfeld (Zea Mays) Measured Using the Eddy Covariance Technique.” Atmospheric Chemistry and Physics 14: 12839-12854.
Ibrom, A., E. Dellwik, S. E. Larsen, and K. Pilegaard. 2007. “On the Use of the Webb-Pearman-Leuning Theory for Closed-path Eddy Correlation Measurements.” Tellus B 59: 937-946.
IPCC. 2006. IPCC Guidelines for National Greenhouse Gas Inventories. Kanagawa: Institute for Global Environmental Strategies.
IPCC. 2007. The Physical Science Basis: In Contribution of Working Group I to the Fourth Assessment Report of the Intergovernmental Panel on Climate Change. Cambridge: Cambridge University Press.
Kaimal, J. C., J. C. Wyngaard, Y. Izumi, and O. R. Coté. 1972. “Spectral Characteristics of Surface Layer Turbulence.” Quarterly Journal of the Royal Meteorological Society 98: 563-589.
Kormann, R., and F. X. Meixner. 2001. “An Analytical Footprint Model for Nonneutral Stratifcation.” Boundary-Layer Meteorology 99: 207-224.
Kroon, P. S., A. Hensen, H. J. J. Jonker, M. S. Zahniser, W. H. van’t Veen, and A. T. Vermeulen. 2007. “Suitability of Quantum Cascade Laser Spectroscopy for CH4and N2O Eddy Covariance Flux Measurements.” Biogeosciences 4: 715-728.
Mauder, M., and T. Foken. 2004. “Documentation and Instruction Manual of the Eddy Covariance Software Package.” http:// www.geo.uni-bayreuth.de/mikrometeorologie/ARBERG/ ARBERG26.pdf.
Mei, B., X. Zheng, B. Xie, H. Dong, Z. Yao, C. Liu, Z. Zhou, R. Wang,J. Deng, and J. Zhu. 2011. “Characteristics of Multiple-year Nitrous Oxide Emissions from Conventional Vegetable Fields in Southeastern China.” Journal of Geophysical Research 116: D12113.
Merbold, L., W. Eugster, J. Stieger, M. Zahniser, D. Nelson, and N. Buchmann. 2014. “Greenhouse Gas Budget (CO2, CH4and N2O) of Intensively Managed Grassland Following Restoration.” Global Change Biology 20: 1913-1928.
Moncrief, J., R. Clement, J. Finnigan, and T. Meyers. 2004.“Averaging, Detrending, and Filtering of Eddy Covariance Time Series.” Chap. 2 in Handbook of Micrometeorology. Dordrecht: Kluwer Academic.
Moore, C. J. 1986. “Frequency Response Corrections for Eddy Correlation Systems.” Boundary-Layer Meteorology 37: 17-35.
Neftel, A., C. R. Flechard, C. Ammann, F. Conen, L. Emmenegger, and K. Zeyer. 2007. “Experimental Assessment of N2O Background Fluxes in Grassland Systems.” Tellus B 59: 470-482.
Neftel, A., C. Ammann, C. Fischer, C. Spirig, F. Conen,L. Emmenegger, B. Tuzson, and S. Wahlen. 2010. “N2O Exchange over Managed Grassland: Application of a Quantum Cascade Laser Spectrometer for Micrometeorological Flux Measurements.” Agricultural and Forest Meteorology 150: 775-785.
Rannik, Ü., S. Haapanala, N. J. Shurpali, I. Mammarella, S. Lind,N. Hyvönen, O. Peltola, M. Zahniser, P. J. Martikainen, and T. Vesala. 2015.“Intercomparison of Fast Response Commercial Gas Analysers for Nitrous Oxide Flux Measurements under Field Conditions.” Biogeosciences 12: 415-432.
Wang, K., X. Zheng, M. Pihlatie, T. Vesala, C. Liu, S. Haapanala,I. Mammarella, Ü. Rannik, and H. Liu. 2013. “Comparison between Static Chamber and Tunable Diode Laser-based Eddy Covariance Techniques for Measuring Nitrous Oxide Fluxes from a Cotton Field.” Agricultural and Forest Meteorology 171-172: 9-19.
Webb, E. K., G. I. Pearman, and R. Leuning. 1980. “Correction of Flux Measurements for Density Efects Due to Heat and Water Vapour Transfer.” Quarterly Journal of the Royal Meteorological Society 106: 85-100.
Werle, P., R. Miike, and F. Slemr. 1993. “The Limits of Signal Averaging in Atmospheric Trace-gas Monitoring by Tunable Diode-laser Absorption Spectroscopy (TDLAS).” Applied Physics B Photophysics and Laser Chemistry 57: 131-139.
Yao, Z., C. Liu, H. Dong, R. Wang, and X. Zheng. 2015. “Annual Nitric and Nitrous Oxide Fluxes from Chinese Subtropical Plastic Greenhouse and Conventional Vegetable Cultivations.”Environmental Pollution 196: 89-97.
Zhang, Y., F. Lin, Y. Jin, X. Wang, S. Liu, and J. Zou. 2016. “Response of Nitric and Nitrous Oxide Fluxes to N Fertilizer Application in Greenhouse Vegetable Cropping Systems in Southeast China.” Scientifc Reports 6: 20700.
25 April 2016
CONTACT WANG Kai kai.wang@mail.iap.ac.cn
© 2016 The Author(s). Published by Informa UK Limited, trading as Taylor & Francis Group.
This is an Open Access article distributed under the terms of the Creative Commons Attribution License (http://creativecommons.org/licenses/by/4.0/), which permits unrestricted use, distribution, and reproduction in any medium, provided the original work is properly cited.
猜你喜欢
杂志排行

Atmospheric and Oceanic Science Letters的其它文章
- Real-time simulation and mechanistic analysis of a squall line case in East China
- MJO potential predictability and predictive skill in IAP AGCM 4.1
- Pathways of intraseasonal Kelvin waves in the Indonesian Throughflow regions derived from satellite altimeter observation
- Delving into the relationship between autumn Arctic sea ice and central-eastern Eurasian winter climate
- Freshening biases in the freshwater flux of CORE data
- A weakly coupled data assimilation system of a coupled physical-biological model for the northeastern South China Sea