气体在无定型聚异戊二烯中扩散的分子动力学模拟
2016-11-22汪亚顺谭源源高木子源
鲁 相 陈 循 汪亚顺 谭源源 高木子源
(1国防科学技术大学机电工程与自动化学院,装备综合保障技术重点实验室,长沙410073;2阿尔伯塔大学化学与材料工程系,埃德蒙顿T6G0X6,加拿大)
气体在无定型聚异戊二烯中扩散的分子动力学模拟
鲁相1,*陈循1汪亚顺1谭源源1高木子源2
(1国防科学技术大学机电工程与自动化学院,装备综合保障技术重点实验室,长沙410073;2阿尔伯塔大学化学与材料工程系,埃德蒙顿T6G0X6,加拿大)
采用分子动力学模拟方法研究了多个温度下氧气、氮气及甲烷在无定型顺式1,4-聚异戊二烯中的扩散系数。在模拟过程中,使用COMPASS力场作为分子力场。应用COMPASS力场的势能函数,聚合物的密度及玻璃化转变温度的计算结果与实验值有较好吻合。在278-378 K的温度范围内,通过3或1.5 ns时长的正则系综动力学模拟,计算了不同温度下氧气、氮气及甲烷的扩散系数。结果表明,根据爱因斯坦关系式计算得到的扩散系数与实验结果比较接近。对气体扩散系数与温度的关系进一步研究,发现在278-378 K温度范围内,甲烷的扩散系数随温度变化的半对数曲线图是非线性的,而氧气和氮气的扩散系数随温度变化的半对数曲线图是线性的。本文研究结果有助于理解温度对气体扩散的影响机制,并为高温下气体在天然橡胶中扩散系数的测定及天然橡胶热氧老化建模分析提供依据。
气体;扩散系数;聚异戊二烯;分子动力学;分子模拟
1 Introduction
The transport(diffusion)of gas in polymers has been a subject of ongoing interest for several decades.Many important practical applications depend on the information of transport phenomena, such as protective coatings,food packaging materials,and selective membranes for separation technology1-3.In addition,the diffusion data of oxygen are vital parameters for understanding and modeling the thermo oxidative degradation of polymers4,5. However,experimental measurements of the diffusion coefficients of gas over a wide temperature range are difficult and expensive, especially for the case of high temperatures4,6.When the temperature exceeds 373 K,elastomers begin to give off gas and the traditional measurements could not be continued6.Moreover, oxygen inevitably reacts with the polymer during the diffusion process at sufficiently high temperatures,thus the measured diffusion rate without special correction will not increase but decrease with temperatures under these conditions4.
By reasonable solutions of Fick′s law,the process of gas transport in polymers can be well depicted from a macroscopic point of view7,8.In order to get a better understanding of the phenomena of gas diffusion in polymers,the elucidation of diffusion mechanism on a microscopic level is necessary.Unfortunately,although there are many theoretical models at present, including the free-volume9and the dual-mode sorption10models, the elucidations based on these models are not satisfactory11-13.The chemical structure of polymers can be considered to be the predominant factor which controls the magnitude of permeability(or diffusion)coefficient14.However,even if knowledge on the polymer structure is obtained,the diffusion coefficient can not be estimated by these theoretical models because the unknown parameters in these models are not directly related to the polymer structure.
To overcome the above-mentioned obstacles existing in the experiment and theory,computer modeling is increasingly used as a standard tool in the investigation of gas diffusion in polymeric materials.MD simulation based on computer modeling has been proven to be a useful tool for exploring the structure-property relationship of amorphous polymeric materials15-17.Due to the fast development of high-speed computational facilities in recent years,MD becomes a powerful tool for predicting diffusion constants of gas in natural and synthetic polymers at room temperature,and it can be utilized to describe the complex transport mechanism18,19.For example,Tao et al.20discussed the effect of polymerization degree of polypropylene on the diffusion coefficient of oxygen.Lü et al.21calculated the diffusion coefficients of the oxygen molecules in NaOH and KOH solutions.Liu and Huang22studied the transport properties of oxygen and nitrogen in the para-substituted polystyrenes.
Much work on MD simulation of gas diffusion through rubbery and glassy polymers has been reported15-18,22-28,but only a few studies deal with the temperature dependence of diffusion coefficients and diffusion mechanism29-32.Gee and Boyd29employed MDsimulation to estimate the methane diffusion in amorphous cis-1,4-polybutadiene(rubbery polymer)in the temperature range of 250-450 K.Their study showed a decrease of activation energy with the temperature for methane.Mozaffari et al.32performed MD simulation to study the gas diffusion in polystyrene over a wide range of temperatures,300-500 K.For the logarithm of diffusivity versus inverse temperature data,their calculated results showed that a discontinuity in slope of these data was seen at the glass transition temperature for some gases.But the plot was linear over the whole temperature range for some other light gases.The diffusion coefficients calculated by their model were in good agreement with the experimental data.
The cis-1,4-polyisoprene(natural rubber)is selected as the polymer system in this study.It is still a widely used rubber at present and many experimental studies with regard to its physical properties and diffusivity to gases have been carried out14.Experimental data concerning the diffusion of nitrogen have been obtained over a temperature range of 293-373 K33.For comparison with experimental data,MD simulations are performed for the calculation of diffusion of gases(oxygen,nitrogen and methane)at temperatures ranging from 278 to 378 K.Meanwhile the calculated density and glass transition temperature are used to validate the availability of the utilized force field in the simulation. Finally,the temperature dependence of diffusion coefficients and diffusion mechanism are examined.
2 Methodology
The transmission of gas through polymer films is defined as permeability P.Permeability is in nature the normalized permeating flux with reference to thickness and pressure.Fick′s law and Henry′s law apply to the actual process of gas permeation through nonporous polymer film.The permeability coefficient P can also be referred to as the product of the diffusivity and solubility,that is P=DS,where D stands for diffusion coefficient and S stands for the solubility coefficient.The value of diffusivity could be determined by the product.Consequently,the error in values of D comprises the experimental error in measurements of P and S,and it may be very large under the worst case1,6.A more accurate diffusivity is derived from the lag time of the permeation6.
In MD simulation,the trajectories of an ensemble of particles are tracked by iteratively solving Newton′s equation of motion. For the sake of calculation of the diffusion coefficient,the particle center-of-mass mean-square displacement(MSD)has to be calculated using the obtained trajectory.When the long-time limit has been reached,the MSD is linear in time,and then the diffusion coefficient of penetrants can be calculated by means of the Einstein equation11,32

where ridenotes the cartesian position vector of atom i,N is the total number of identical atoms,t is the simulation time and the bracket denotes the average over all possible time origins alongthe trajectory.It deserves notice that the diffusion coefficient calculated from Eq.(1)is designated as the self diffusion coefficient,whereas the experimental measurements yield mutual diffusion coefficients1,7.However,the self diffusion coefficient is equal to the mutual diffusion coefficient in the limit of infinite dilution7,26.The gas concentration is usually very low both in the simulation and measurement for the diffusion of gas molecules. Thus the discrepancy between calculated diffusion coefficient and experimental value should be small.
In general,the plot of MSD can be divided into three distinct parts.The first part is characterized by the short-time ballistic motion.Then the case of anomalous diffusion occurs,which is first reported by Müller-Plathe2,and the slope of log-log representation of MSD versus time is smaller than unity.Finally when the simulation time is long enough,the case of normal diffusion occurs and the mean square displacement is proportional to the time t.Eq.(1)depends on the assumption that the penetrant follows a random walk in the simulation runs.For a short simulation time, the motion of penetrant at various times may be correlated and this may lead to the anomalous diffusion18.In the case of anomalous diffusion,the Einstein equation is no longer valid and it will lead to an overestimation of diffusion constants.To ensure that the system has reached the normal diffusion regimes,the slope of loglog plot of MSD versus time must approach to unity11,22.
According to the free volume model,there is a volume unoccupied by the polymeric molecules(namely free volume)in the polymer matrix.Gas molecules could reside in the suitable microcavities of free volume.With the motion of segments of the polymer chain,a microcavity adjacent to the gas molecule may be created during the redistribution of the free volume.From time to time,the molecule obtains sufficient thermal energy to be able to jump into the neighboring cavity.If the microcavity is vacant and capable of holding the molecule simultaneously,a diffusive motion is completed by the successful jump of the molecule to the cavity.
When polymer system with penetrant is at equilibrium,the jumping model of diffusion stated above may also be related to the stochastic equation proposed by Bueche25,31

where δ is the average jump displacement or hopping distance and τ is the average residence time between jumps.For sufficient statistics used in the calculation of diffusion coefficient,10 jump occurrences for a single gas molecule may need to be sampled from the trajectory of dynamics simulation.
3 Simulation details
The Materials Studio(MS)software of Accelrys Inc.was used to perform the MD simulation.To successfully predict the transport property by MD simulation,the choice of proper force filed type is of great importance.United-atom(UA)force field has been commonly used in the past simulations to reduce the computational time.However,the obtained calculation results often differ from the experimental value by 1-2 orders of magnitude, which shows that the UA is not detailed enough to describe the local barrier to the penetrant motion15.In contrast,COMPASS force field represents all atoms explicitly,and it has been well validated in prediction of transport properties of small molecules in polymers26.Therefore,the COMPASS force field was used in all the simulations in this study.The detailed atom parameters and potential function are included in the validation of COMPASS34.
Previous studies on the polymer chain length effect have indicated that many free ends always lead to an overestimation of diffusivity11,22.To reduce such effect of chain ends on the simulation results,the cis-1,4-polyisoprene was modeled by a single chain consisting of 100 monomer units.The length of sides of the cubic unit cell was about 2.3 nm.The generated polymer chain was subsequently subjected to geometry optimization by the Forcite module.Then the cubic amorphous cell of the single chain was developed using the Amorphous module in MS.cis-1,4-polyisoprene is a kind of simple flexible chain polymers,and the original density of the amorphous cell was set to be the measured density 0.913 g·cm-3at 298 K.It should be noted that the atoms contained in the simulated system is much smaller than that in a real molecular system.If simulation is carried out on this isolated system containing such a small quantity of atoms,significant surface effect would be evident.Consequently,periodic boundary conditions were imposed on the cubic cell to avoid surface effects while the number of atoms was still tractable11.The construction of the amorphous cell was based on the“self-avoiding”randomwalk method of Theodorou and Suter35and on the Meirovitch scanning method36.During the construction process,the length of the backbone chain was increased stepwisely under periodic boundary conditions.A total of 10 cells have been constructed using this method.
The gas diffusion under low temperatures is slow,and the hop of gas in the polymer matrix is rare.Reliable prediction of the diffusion coefficient needs more statistics under this case. Therefore,four molecules of gas(oxygen,nitrogen,and methane) were inserted into each cell to improve sampling from the subsequent dynamic trajectories at various temperatures.
The initial microstructures constructed by the procedure stated above were usually not distributed uniformly in the cubic unit cell. Because of the overlap of atoms,the total potential energy of the initial system was abnormally higher than that of practical system1. Therefore,the geometry optimization of the Forcite module was used to minimize the potential energy of the initial system.After geometry optimization on ten cells,the specific cell with the lowest energy is taken as the representative of the simulated system.Fig.1 shows the cubic cell for the system of polyisoprene and oxygen.
Next the microstructure was equilibrated to make sure that the system is close to the state of equilibrium before the production runs of the simulation.Annealing was performed by the isothermal-isobaric(NPT)dynamic runs at 1.013×10⁵Pa using Annealing procedure of the Forcite module.During an annealingcycle,the cell was first heated by a step of 20 K from 278 to 378 K,and then the cell was cooled back to 298 K using the same step increments.There are 2 to 3 cycles in the entire annealing process and the duration for the NPT dynamic run at each temperature was 10 ps.The annealed cell was further relaxed by a NPT dynamic run of 250-350 ps at a target temperature(278-378 K)and a pressure of 1.013×10⁵Pa.The fluctuations of potential and kinetic energies with the simulation time were plotted.The small deviation from the average of the plot needs to be verified to ensure the microstructure in equilibrium.

Fig.1 Acubic cell for the system of cis-1,4-polyisoprene and oxygen
The summation method for nonbond interactions has great effect on the accuracy and efficiency of the energy calculation11. The commonly used summation method includes Ewald and group based summation method.Ewald summation method may provide better accuracy for the calculation of coulombic terms than other summation methods,but it is more computationally intensive26. Thus group-based and Ewald summation method were used for the van der Waals and electrostatic interactions respectively in the present study.This manner could take advantages of both the accuracy of Ewald and the efficiency of group-based summation method.The cutoffs are used in group-based summation method to increase the speed of calculation of nonbond interactions.It is crucial to note that the cutoff distance must be less than one half of the shortest side length of the cell11,12.The spline function is simultaneously employed to avoid the discontinuities caused by the direct cutoffs.During the simulations,a cutoff distance of 1 nm with a spline function of 0.1 nm was applied to the energy calculation.The accuracy of Ewald was 0.004 kJ·mol-1.The time step of 1 fs was employed throughout the simulations.
A short simulation time may lead to the overestimation of diffusivity and an overlong simulation time induces a waste of the computational facilities.To obtain accurate predictions of diffusion coefficients at reasonable cost,the length of production run at each temperature should be determined in advance.According to Eq.(3),if D is considered to be 1.5×10⁻¹⁰m2·s-1,a 3-ns simulation will meet 10 jump occurrences on the assumption thatδis 0.5 nm.Based on this fact and the measured diffusion coefficients of gases at 298 and 315 K,the arrangement on the production run time is shown in Table 1.In all simulation runs,both the temperature and pressure was controlled by the Berendsen′s method37, where the decay constant was 0.1 ps.
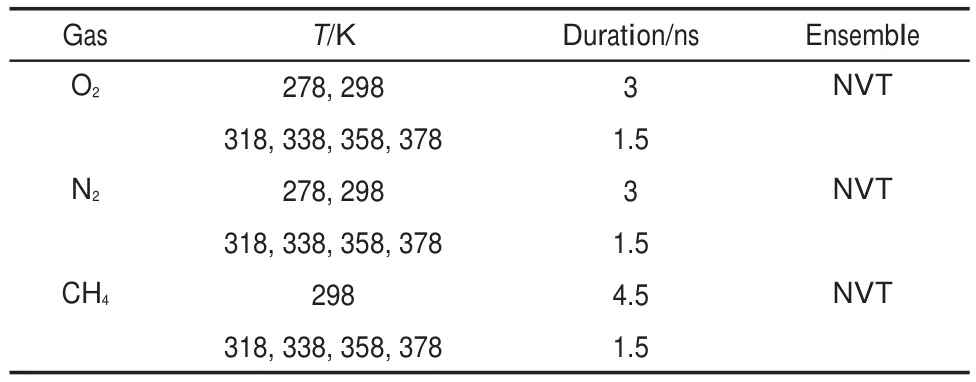
Table 1 Settings for the simulation time of production runs at various temperatures
4 Results and discussion
4.1Model verification
The density of polymers greatly affects the diffusion coefficient of penetrant within the polymeric materials16,18.Correspondingly, the predictions of density at various temperatures should be close to the available experimental values.As a validation,the specific volume is determined from NPT dynamic runs with a stepwise cooling procedure.The plot of the obtained specific volume versus temperature is shown in Fig.2.
The simulation data falling above and below the reported glass transition temperature was fitted by the least-square fitting method. Then volumetric thermal expansion coefficient can be derived from the obtained fitting equation combined with the expression38

whereαdenotes the thermal expansion coefficient andυis the specific volume at one temperature.Large change in density is found at the glass transition temperature Tgdue to the drastic change in the local movement of polymer chains at this temperature.Thus glass transition temperature is determined as the temperature at the intersection of the two line segments in Fig.239. Simulation results and corresponding experimental data at 298 K are shown in Table 2.
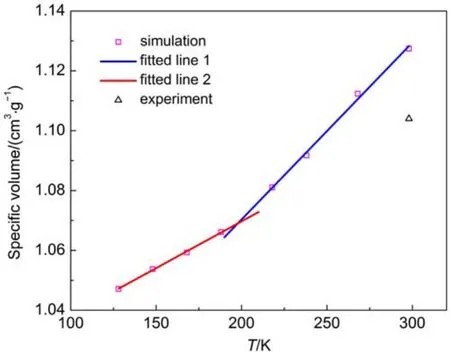
Fig.2 Specific volume versus temperature for amorphous cis-1,4-polyisoprene
Table 2 shows that the relevant experimental data are reproduced well by the results calculated from the model used in this study,especially for the case of glass transition temperature.Dueto the finite chain length effect,the estimated density is a little smaller than the experimental value31.It is also noticeable that the experimental values of density and glass transition temperature are subject to some uncertainties.In summary,the simulation result of density is accurate enough to be expected to have a minor effect on the calculation of diffusion coefficient.

Table 2 Comparison of estimated and experimental properties
4.2Motion of gas molecules
One of the simple ways of qualitatively studying the motion of individual gas molecules is to monitor the trace of the molecule. Fig.3(a)and(b)show the typical trace of an oxygen molecule diffusing through amorphous cis-1,4-polyisoprene at 298 and 358 K,respectively.Two types of motion can be identified in the diffusion process described by the picture.On the one hand,the gas molecules stay in the microcavities in the polymer for a long period of time.When they are confined in the microcavities,their motions cover most regions of the microcavity because of their randomly oscillatory motion.The amplitude of oscillations depends on the size of the visited microcavities.On the other hand, the gas molecules occasionally stop to perform a quick hop from one microcavity to another neighboring microcavity.The length of the trajectory in Fig.3(b)is apparently larger than that in Fig.3 (a).This discrepancy between Fig.3(a)and 3(b)implies that the gas molecules move faster at high temperatures,which is also an indication of the faster redistribution of the free volume at high temperatures.
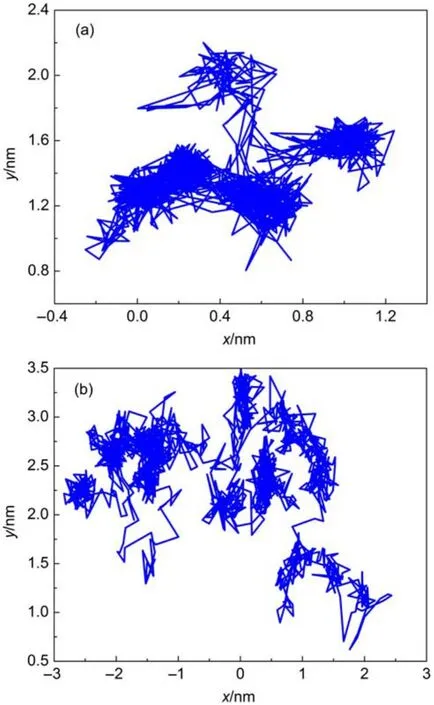
Fig.3 Typical trajectories of an oxygen molecule in amorphous cis-1,4-polyisoprene(a)at 298 K and(b)at 358 K during a period of 1.5 ns
According to the procedure described in the second section of this study,the MSD of all gas molecules is calculated over a wide range of temperatures 278-378 K.Fig.4 displays the mean square displacement of oxygen molecules at 298 and 318 K respectively. It can be seen that each MSD is indeed a linear function over a period of time in this plot.The slopes of the straight lines fitted for the log-log plot of MSD versus time at 298 and 318 K are 1.05 and 1.08,respectively,which confirm the case of normal diffusion. Fig.4 is characterized with different starting times of normal diffusion at various temperatures.Further investigation of the MSD at various temperatures in Fig.4 reveals that the transition from abnormal diffusion to Einstein diffusion takes place earlier at high temperatures.
Based on the definition in Eq.(2),MSD is calculated by averaging the square displacements over all gas molecules and all possible time origins along the time trajectory.However,the total number of possible time origins is much less at long simulation times.This event leads to an increase of statistics error towards the end of the trajectory2,29.Consequently,the resultant nonlinear part adjacent to the end of the run is abandoned during the calculation of diffusion coefficients.A linear regression is performed on the remaining linear portion of MSD to calculate the diffusion coefficients.The calculated diffusion coefficients of gas molecules at 298 K are summarized in Table 3,together with the experimental data.The calculation results are in good agreement with experimental data.To the best of our knowledge,there are few studies on diffusion of gas molecules in amorphous cis-1,4-polyisoprene at various temperatures.Attention is paid to theprevious study of Meunier on diffusion of gas molecules in similar polymer amorphous cis-1,4-polybutadiene31.The agreement between calculation results and experimental data is better in the present study than that in former simulation study of Meunier,due to the differences in summation method and polymer chain length.

Fig.4 MSD of oxygen molecules in amorphous cis-1,4-polyisoprene at 298 and 318 K

Table 3 Comparison of the calculated diffusion coefficients with experimental data for oxygen,nitrogen,and methane at 298 K
4.3Temperature dependence of diffusion coefficients
Many experimental observations suggest that the diffusion coefficients increase exponentially with increasing temperature on a narrow range of temperatures.The temperature dependence of diffusion coefficient can be expressed by means of Arrhenius equation

where D0is a pre-exponential factor,EDis the apparent activation energy and R is gas constant.Eq.(5)indicates that diffusion of small molecules in polymer is visualized as a thermal-activated process,which is first proposed by Barrer40.However,according to free volume models of diffusion,the temperature dependence is of the Williams-Landel-Ferry(WLF)form41.Regardless of the existing difference in detailed description of the diffusion process, both models suggest activation energy decreases with increasing temperature.
Diffusion coefficients of oxygen,nitrogen,and methane molecules in amorphous cis-1,4-polyisoprene are shown in Figs.5-7 as a function of temperature.Calculated activation energies are 36.0 and 30.1 kJ·mol-1for oxygen and nitrogen respectively in the temperature range of 278-378 K.Experimental activation energies are 31.4-33.5 and 31.4-36.4 kJ·mol-1for oxygen and nitrogen respectively in the temperature range of 293-323 K6,14. The calculation results for oxygen and nitrogen compare well with the experimental data in the same temperature range.As for the activation energy of methane,it decreases with the temperature, as shown in Fig.7.The linearity in Arrhenius plots of diffusion coefficients for oxygen and nitrogen is distinctly different from the curvature in the similar plot for methane.This discrepancy may be attributed to the differences in penetrant size and intermolecular interactions.
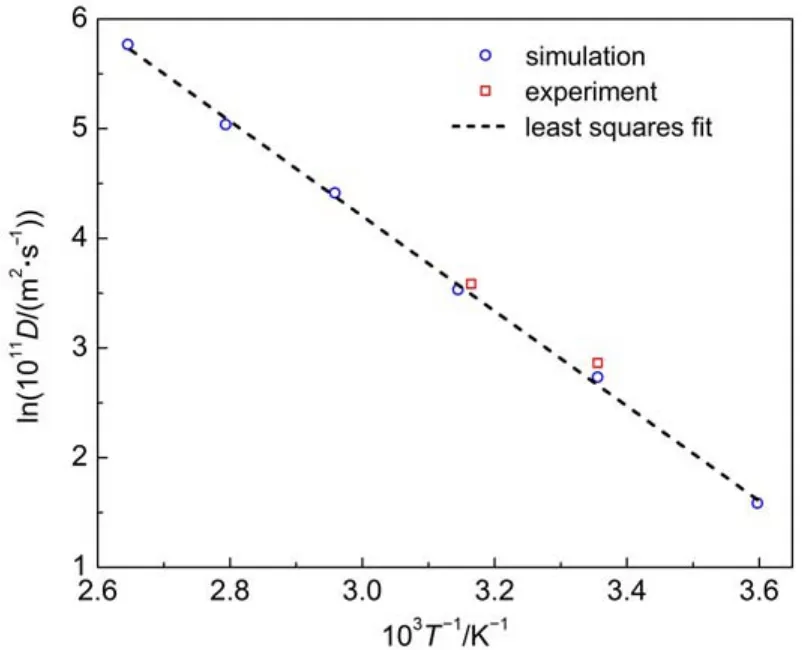
Fig.5 Temperature dependence of diffusion coefficients for oxygen in amorphous cis-1,4-polyisoprene
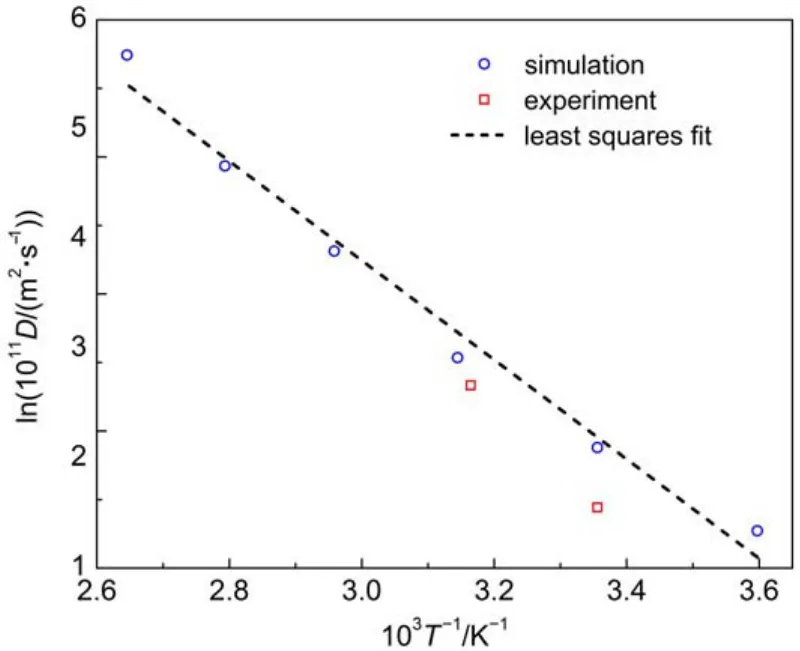
Fig.6 Temperature dependence of diffusion coefficients for nitrogen in amorphous cis-1,4-polyisoprene

Fig.7 Temperature dependence of diffusion coefficients for methane in amorphous cis-1,4-polyisoprene
Some literature has reported that the curvature is also observed for nitrogen diffusion through natural rubber over 293-373 K4,6. The curvature is gradually evident with the increase of the combined sulfur content in the previous study42.However,it should be noticed that the early experimental measurements are taken on the natural rubber vulcanizates,while the effect of vulcanization is not considered in this simulation.Further,the linearity is also reported by previous simulation for oxygen and nitrogen diffusion through polybutadiene and polystyrene,together with the nonlinearity for methane over a wide range of temperatures29-32.Consequently,the simulation results of diffusion for oxygen and nitrogen are still reasonable at high temperatures.From the results of our research and previous simulation study,it is concluded that for methane and other large-size penetrants in most amorphous polymers(except polyisobutylene),the temperature dependence of diffusion coefficients is of the WLF type over a large temperature regime.But for oxygen and nitrogen,theArrhenius-type temperature dependence appears to be valid for the diffusion coefficients over the whole temperature studied.
Fig.8 exhibits the displacements of methane in amorphous cis-1,4-polyisoprene at 318 and 358 K.The displacement of methane increases with the temperature.In addition,the jumps of gas molecules are more frequent and the jump size is larger at 358 Kthan that at 318 K.In fact,the movement of the polymer chain is slow at low temperatures,thus the formation and closing of those microcavities are infrequent.Moreover,the higher density of polymer at lower temperatures causes a small probability of largesize microcavities.Small probability of successful jump may correspond to the increase of activation energy at low temperature for large-size gas molecules.According to free volume models, gas molecules follow a liquidlike mechanism at high temperatures. When the temperature increases,the total accessible free volume for gas molecules increases and gas molecules can move more freely within amorphous polymers.Temperature greatly affects the motion of methane molecules,and the change of diffusion mechanism comes with the decrease of activation energy for methane molecules.To be more specific,the diffusion mechanism changes from jumping mechanism at low temperatures to the liquidlike mechanism at high temperatures for methane molecules. In contrast,the diffusion of oxygen and nitrogen molecules follows the hopping mechanism over the temperature range investigated.
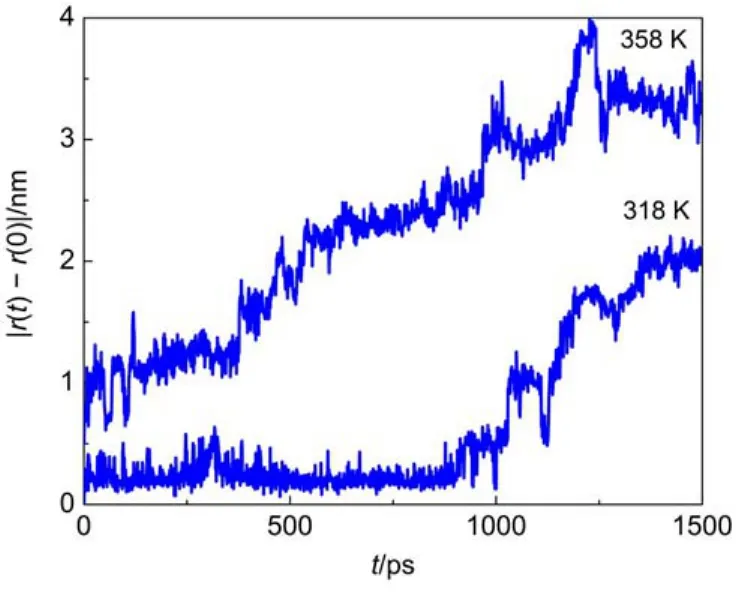
Fig.8 Displacements of a methane molecule fromits initial position at 318 and 358 K
5 Conclusions
MD simulations were used to study the diffusion of oxygen, nitrogen,and methane in amorphous cis-1,4-polyisoprene.The starting structures for classical MD simulations were generated and equilibrated using the full atomistic potential of COMPASS force filed.The model used in this study accurately reproduced the experimental values of density and glass transition temperature. The diffusion coefficients of gas molecules were calculated by MD simulations over a wide range of temperatures,278-378 K. The calculation results were in good agreement with available experimental data.Simulation results show that the higher the temperature,the earlier the transition from abnormal diffusion to normal diffusion will be.
As the calculation results at high and low temperatures show, the Arrhenius plot of diffusivity versus inverse temperature is nearly linear over the investigated temperatures for oxygen and nitrogen.But for the case of diffusion for methane,significant curvature to lower activation energy is observed in the Arrhenius plot as the temperature increases,which is consistent with the analysis based on the free volume model and Barrer′s theory.The change in the slope of Arrhenius plot indicates a gradual transition of diffusion mechanism,that is,a crossover from jumping mechanism at low temperatures to the liquidlike mechanism at high temperatures.
References
(1) Charati,S.G.;Stern,S.A.Macromolecules 1998,31(16),5529. doi:10.1021/ma980387e
(2) Müller-Plathe,F.J.Chem.Phys.1991,94(4),3192. doi:10.1063/1.459788
(3) Kucukpinar,E.;Doruker,P.Polymer 2003,44(12),3607. doi:10.1016/S0032-3861(03)00166-6
(4) Celina,M.;Gillen,K.T.Macromolecules 2005,38(7),2754. doi:10.1021/ma0487913
(5) Wise,J.;Gillen,K.T;Clough,R.L.Polymer 1997,38(8), 1929.doi:10.1016/S0032-3861(96)00716-1
(7) Frish,H.L.;Stern,S.A.CRC Crit.Rev.Solid State Mater.Sci. 1983,11(2),123.doi:10.1080/01611598308244062
(8) Crank,J.The Mathematics of Diffusion,2nd ed.;Clarendon Press:Oxford,1975;pp 2-8.
(9) Fujita,H.Fortschr.Hochpolym.-Forsch.1961,3,1. doi:10.1007/BFb0050514
(10) Stern,S.A.;Frisch,H.L.Annu.Rev.Mater.Sci.1981,11,523. doi:10.1146/annurev.ms.11.080181.002515
(11) Hofmann,D.;Fritz,L.;Ulbrich,J.;Schepers,C.;Bohning,M. Macromol.Theory Simul.2000,9(6),293.doi:10.1002/1521-3919(20000701)9:6<293::AID-MATS293>3.0.CO;2-1
(12) Hofmann,D.;Fritz,L.;Ulbrich,J.;Paul,D.Comput.Theor. Polym.Sci.2000,10(5),419.doi:10.1016/S1089-3156(00) 00007-6
(13) Guevara-Carrion,G.;Nieto-Draghi,C.;Vrabec,J.;Hasse,H.J. Phys.Chem.B 2008,112(51),16664.doi:10.1021/jp805584d
(14) Furuta,I.;Kimura,S.I.;Iwama,M.Physical Contants of Rubbery Polymers.In Polymer Handbook,4th ed.;Brandrup,J., Immergut,E.H.,Crulke,E.A.Eds.;Wiley:New York,1998;pp V5-V6.
(15) Tamai,Y.;Tanaka,H.;Nakanishi,K.Macromolecules 1994,27 (16),4498.doi:10.1021/ma00094a011
(16) Cuthbert,T.R.;Wagner,N.J.;Paulaitis,M.E.;Murgia,G.; D′Aguanno,B.Macromolecules 1999,32(15),5017. doi:10.1021/ma980997e
(17) Fried,J.R.;Goyal,D.K.J.Polym.Sci.:Part B:Polym.Phys. 1998,36(3),519.doi:10.1002/(SICI)1099-0488(199802)36:3< 519::AID-POLB13>3.0.CO;2-J
(18) Müller-Plathe,F.J.Chem.Phys.1992,96(4),3200. doi:10.1063/1.461963
(19) Feng,H.J.;Gao,W.;Sun,Z.F.;Lei,B.X.;Li,G.N.;Chen,L. P.J.Phys.Chem.B 2013,117(41),12525.doi:10.1021/ jp401824d
(20) Tao,C.G.;Feng,H.J.;Zhou,J.;Lü,L.H.;Lu,X.H.Acta Phys.-Chim.Sin.2009,25(7),1373.[陶长贵,冯海军,周健,吕玲红,陆小华.物理化学学报,2009,25(7),1373.] doi:10.3866/PKU.WHXB20090719
(21) Lü,Y.Q.;Zheng,S.L.;Wang,S.N.;Du,H.;Zhang,Y.Acta Phys.-Chim.Sin.2015,31(6),1045.[吕页清,郑诗礼,王少娜,杜浩,张懿.物理化学学报,2015,31(6),1045.] doi:10.3866/PKU.WHXB201504071
(22) Liu,Q.L.;Huang,Y.J.Phys.Chem.B 2006,110(35),17375. doi:10.1021/jp063174x
(23) Fried,J.R.;Ren,P.Comput.Theor.Polym.Sci.2000,10(5), 447.doi:10.1016/S1089-3156(00)00005-2
(24) Lim,S.Y.;Tsotsis,T.T.;Sahimi,M.J.Chem.Phys.2003,119, 496.doi:10.1063/1.1576755
(26) Fried,J.R.;Sadat-Akhavi,M.;Mark,J.E.J.Membr.Sci.1998, 149(1),115.doi:10.1016/S0376-7388(98)00151-3
(27) Tocci,E.;Bellacchio,E.;Russo,N.;Diroli,E.J.Membr.Sci. 2002,206(1-2),389.doi:10.1016/S0376-7388(01)00784-0
(28)Wang,X.Y.;Willmore,F.T.;Raharjo,R.D.;Wang,X.C.; Freeman,B.D.;Hill,A.J.;Sanchez,I.C.J.Phys.Chem.B 2006,110(33),16685.doi:10.1021/jp0622334
(29) Gee,R.H.;Boyd,R.H.Polymer 1995,36(7),1435. doi:10.1016/0032-3861(95)95922-N
(30) Pant,P.V.K.;Boyd,R.H.Macromolecules 1993,26(4),679. doi:10.1021/ma00056a019
(32) Mozaffari,F.;Eslami,H.;Moghadasi,J.Polymer 2010,51(1), 300.doi:10.1016/j.polymer.2009.10.072
(33) VanAmerongen,G.J.J.Polym.Sci.1950,5(3),307. doi:10.1002/pol.1950.120050304
(35) Theodorou,D.N.;Suter,U.W.Macromolecules 1985,18(7), 1467.doi:10.1021/ma00149a018
(36) Meirovitch,H.J.J.Chem.Phys.1983,79(1),502.doi:10.1063/ 1.445549
(37) Berendsen,H.J.C.;Postama,J.P.M.;Van Gunsteren,W.F.; DiNola,A.;Haak,J.R.J.Chem.Phys.1984,81(8),3684. doi:10.1063/1.448118
(38) Fried,J.R.;Ren,P.Comput.Theor.Polym.Sci.1999,9(2),111. doi:10.1016/S1089-3156(99)00002-1
(39) Yu,K.Q.;Li,Z.S.;Sun,J.Z.Macromol.Theory Simul.2001, 10(6),624.doi:10.1002/1521-3919(20010701)10:6<624::AIDMATS624>3.0.CO;2-K
(41) Williams,M.L.;Landel,R.F.;Ferry,J.D.J.Am.Chem.Soc. 1955,77(14),3701.doi:10.1021/ja01619a008
(42) Barrer,R.M.;Skirrow,G.J.Polym.Sci.1948,3(4),549. doi:10.1002/pol.1948.120030410
Molecular Dynamics Simulation of Gas Transport in Amorphous Polyisoprene
LU Xiang1,*CHEN Xun1WANG Ya-Shun1TAN Yuan-Yuan1GAOMU Zi-Yuan2
(1Laboratory of Science and Technology on Integrated Logistics Support,College of Mechatronic Engineering and Automation,National University of Defense Technology,Changsha 410073,P.R.China;2Department of Chemical and Materials Engineering,University of Alberta,Edmonton T6G0X6,Canada)
Molecular dynamics(MD)simulations were performed to study the transport properties of gases (oxygen,nitrogen,and methane)in amorphous cis-1,4-polyisoprene over a wide range of temperatures.The COMPASS force field was used as the molecular mechanics force field in the simulations.Experimental values of density and glass transition temperature were successfully reproduced using the atomistic potentials determined by COMPASS.Diffusion coefficients were determined from long NVT simulation times(up to 3 or 1.5 ns)in the temperature range of 278-378 K.The diffusion coefficients calculated fromthe Einstein relationship agree well with available experimental data.Further studies on the temperature dependence of diffusion coefficients indicate that curvature is observed in the Arrhenius plot of diffusivity versus inverse temperature for methane,but the plots are linear over the investigated temperature range for oxygen and nitrogen.These simulation results are useful to understand the temperature dependence of diffusion coefficients,and provide a basis for the determination of diffusion coefficients at high temperatures and the modeling of thermo-oxidative degradation of polyisoprene.
Gas;Diffusion coefficient;Polyisoprene;Molecular dynamics;Molecular simulation
April 28,2016;Revised:June 29,2016;Published online:June 29,2016.
.Email:luxiang9014@126.com;Tel:+86-13549681943.
O641
10.3866/PKU.WHXB201606292
The project was supported by the National Natural Science Foundation of China(51375487,51205402).国家自然科学基金(51375487,51205402)资助项目©Editorial office ofActa Physico-Chimica Sinica
(6) VanAmerongen,G.J.J.Appl.Phys.1946,17,972. 10.1063/1.1707667
(25) Hu,N.;Fried,J.R.Polymer 2005,46(12),4330.10.1016/j. polymer.2005.03.017
(31) Meunier,M.J.Chem.Phys.2005,123,134906.10.1063/ 1.2049274
(34) Sun,H.J.Phys.Chem.B 1998,102(38),7338.10.1021/ jp980939v
(40) Barrer,R.M.J.Phys.Chem.1957,61(2),178.10.1021/ j150548a012
