Seasonal discharge and chemical flux variations of rivers flowing into the Bayhead canal of Durban Harbour,South Africa
2016-11-21KavandrenMoodleySrinivasanPillayKeshiaPatherHariBallabh
Kavandren Moodley·Srinivasan Pillay·Keshia Pather·Hari Ballabh
Seasonal discharge and chemical flux variations of rivers flowing into the Bayhead canal of Durban Harbour,South Africa
Kavandren Moodley1·Srinivasan Pillay1·Keshia Pather1·Hari Ballabh1
The uMhlatuzana,uMbilo and aManzimnyama river catchments located on the eastern seaboard of the KwaZulu-Natal province,South Africa,form the core of urbanization and industrialization,contributing the only natural freshwater inflows to the Bayhead Canal portion of the Durban Harbour.In this study,seasonal discharges and physico-chemical water properties were used to quantitatively determine the material mass transport capacity of the river systems on the basis of hydrographic inputs and chemical loading from the surrounding land use sectors. The mass transport of the total dissolved solids(TDS),ammonia(NH4),phosphorous(P),aluminum(Al),calcium(Ca),copper(Cu),chromium(Cr),mercury(Hg),potassium(K),magnesium(Mg),sodium(Na),nickel(Ni),lead(Pb),sulphur(S)and vanadium(V)was determined for each river.Results indicated that land use,seasonality and river flow were significant determinants for the material loading in the rivers and the receiving port waters.The spatio-temporal distribution patterns of chemical fluxes indicated that industrial activity associated with the aManzimnyama canal contributed the most,with regards to TDS,NH4,Ca,K,Mg,Na,S and V,loading in both wet and dry seasons,as well as Al,Cu,Hg and Pb during the dry season.Similarly,industrial activity associated with the uMbilo/uMhlatuzana Canal at the lower reaches accounted for the highest P,Al,Cu and Pb fluxes in the wet season alone.Fluxes of these parameters are used to explain theobserved elemental concentrations and patterns of the receiving port waters of the Bayhead Canal.
✉ Hari Ballabh
ballabh2228@gmail.com
1School of Agricultural,Earth and Environmental Sciences,University of KwaZulu-Natal,Westville Campus,Durban 4000,South Africa
Discharge·Chemical flux·Durban Harbour
1 Introduction
The material fluxes of rivers are strongly related to river discharge and essentially control the timing and amount of water and pollutants that reach the adjoining aquatic systems and,ultimately,the coast.In recent years there has been a rapid decline in the freshwater quantity and quality of rivers due primarily to unsustainable land-use practices. Human-induced land-use changes have significant impacts on and relationships with the riverine transport and delivery of sediment,pollutants and nutrients,with implications on stream chemistry and water quality(Bullard 1996;Dauer et al.2000;Sigleo and Frick 2007).These alterations may have strong negative implications on the biodiversity of terrestrial,freshwater and marine ecosystems.
The impact of catchment related activities and processes on the water quality of associated river systems,and the areas into which they ultimately drain,emphasizes the need for careful management of the catchment(Cruzado et al. 2002).Therefore,a comprehensive study of the material mass transport capacity of the river systems from the source is important for understanding the cycles of seasonal fluxes and variable loads,as well as the ways in which these influence observed physical and chemical water quality patterns of the aquatic environments into which they drain(Li et al.2008;Masamba and Mazvimavi 2008).In this study,an attempt was made to explain the seasonal material mass transport capacity of three systems,namely the uMhlatuzana,uMbilo and aManzimnyamaRivers of Durban,KwaZulu-Natal province,all of which contribute freshwater inflows to the Bayhead Canal of the Durban Harbour.This was related to the land-use and seasonality for each of the systems in an attempt to understand the observed water quality trends from the source through to the sink.The study served as a useful indication of the natural and anthropogenic catchment influences on the material mass transport capability of the rivers from the source,and contributed to a broader understanding of water quality changes in each of the river systems.
2 Study area
The uMhlatuzana,uMbilo and aManzimnyama River catchments are the three major fluvial systems draining into the Bayhead Canalofthe Durban Harbour,primarily through rainfall runoff from various catchment land-use sectors.The land-use types of the broader catchment area comprise of light and heavy industry,residential sectors,and naturally vegetated areas(MER/ERM 2011).The catchments,being located in a summer rainfall area,experience peak river discharge in the summer months between December and February,and a reduced winter(June to August)discharge(MER/ERM 2011).The uMbilo river catchment has an approximate area and length of 67 km2and 35 km,respectively(reaching as far inland as the suburb of Gillits),the largeruMhlatuzana rivercatchmenthas an approximate area and length of 113 km2and 50 km,respectively(reaching as far inland as Assagay),and the much smaller aManzimnyama river catchment which has a total area and length of approximately 15 km2and 5.5 km,respectively(MER/ ERM 2011).Allthree rivers flow into the portwaters through associated canals,as depicted in Fig.1.
3 Materials and methods
Sampling locations were established on the basis of landuse change,as depicted in Fig.1,and were verified through topographic maps and ground trothing via site visits.
A total of 17 sites were sampled seasonally between December 2011 and September 2012.An indication of the sampling events in relation to seasonal rainfall distribution patternsduringthe sampling period isindicated in Fig.2 below:
An additional 8 sample sites were selected at equal intervals in the Bayhead Canal of the Durban Harbour(sites 18-25 in Fig.1),and were simultaneously sampled in order to assess the influence of the catchment river fluxes on the concentrations of the variables in the Bayhead Canal of the Durban Harbour.The sample locations of Fig.1 are described Table 1 below:
Reconnaissance survey results showed that material concentrations were fairly homogeneous across the channels due to relatively low discharge and highly turbulent flows,hence seasonally collected water samples were taken at approximately mid-channel and mid-depth at each site. Dry and wet season concentrations were thus obtained for a total dissolved solids(TDS),ammonium ions(NH4),phosphorous(P),sodium ions(Na),sulphur(S),copper(Cu),calcium(Ca),magnesium(Mg),chromium(Cr),aluminum (Al),nickel(Ni),lead(Pb),vanadium (V),mercury(Hg),and potassium ions(K)from the sample derived filtrate.Analysis of P,S,Cu,Ca,Mg,Cr,Al,Ni,Pb,V and Hg was conducted through atomic adsorption inductively coupled plasma(ICP)analysis,while TDS was measured using an electronic TDS meter.
An ion-selective electrode system comprising of polyvinylchloride(PVC)membrane sensitive to ammonium ions was used to analyze the concentration of ammonia in the sample(as per Tomar 1999).The Na and K cation concentrations were quantitatively determined using a flame photometer following the procedures described in Ngila(2008).
The discharges(Q)at each sampling location were determined as a product of the measured channel crosssectional area(A)and current velocity(V)at each sample site(Chapman 1992):
Q=V×A(1)
Thereafter,the nutrient flux φ-or the amount of suspended and dissolved matter passing through the sample location-was established as a product of discharge(Q)and nutrient concentration(C)as reflected below(Chapman 1992):
φ=Q×C(2)
4 Results and discussion
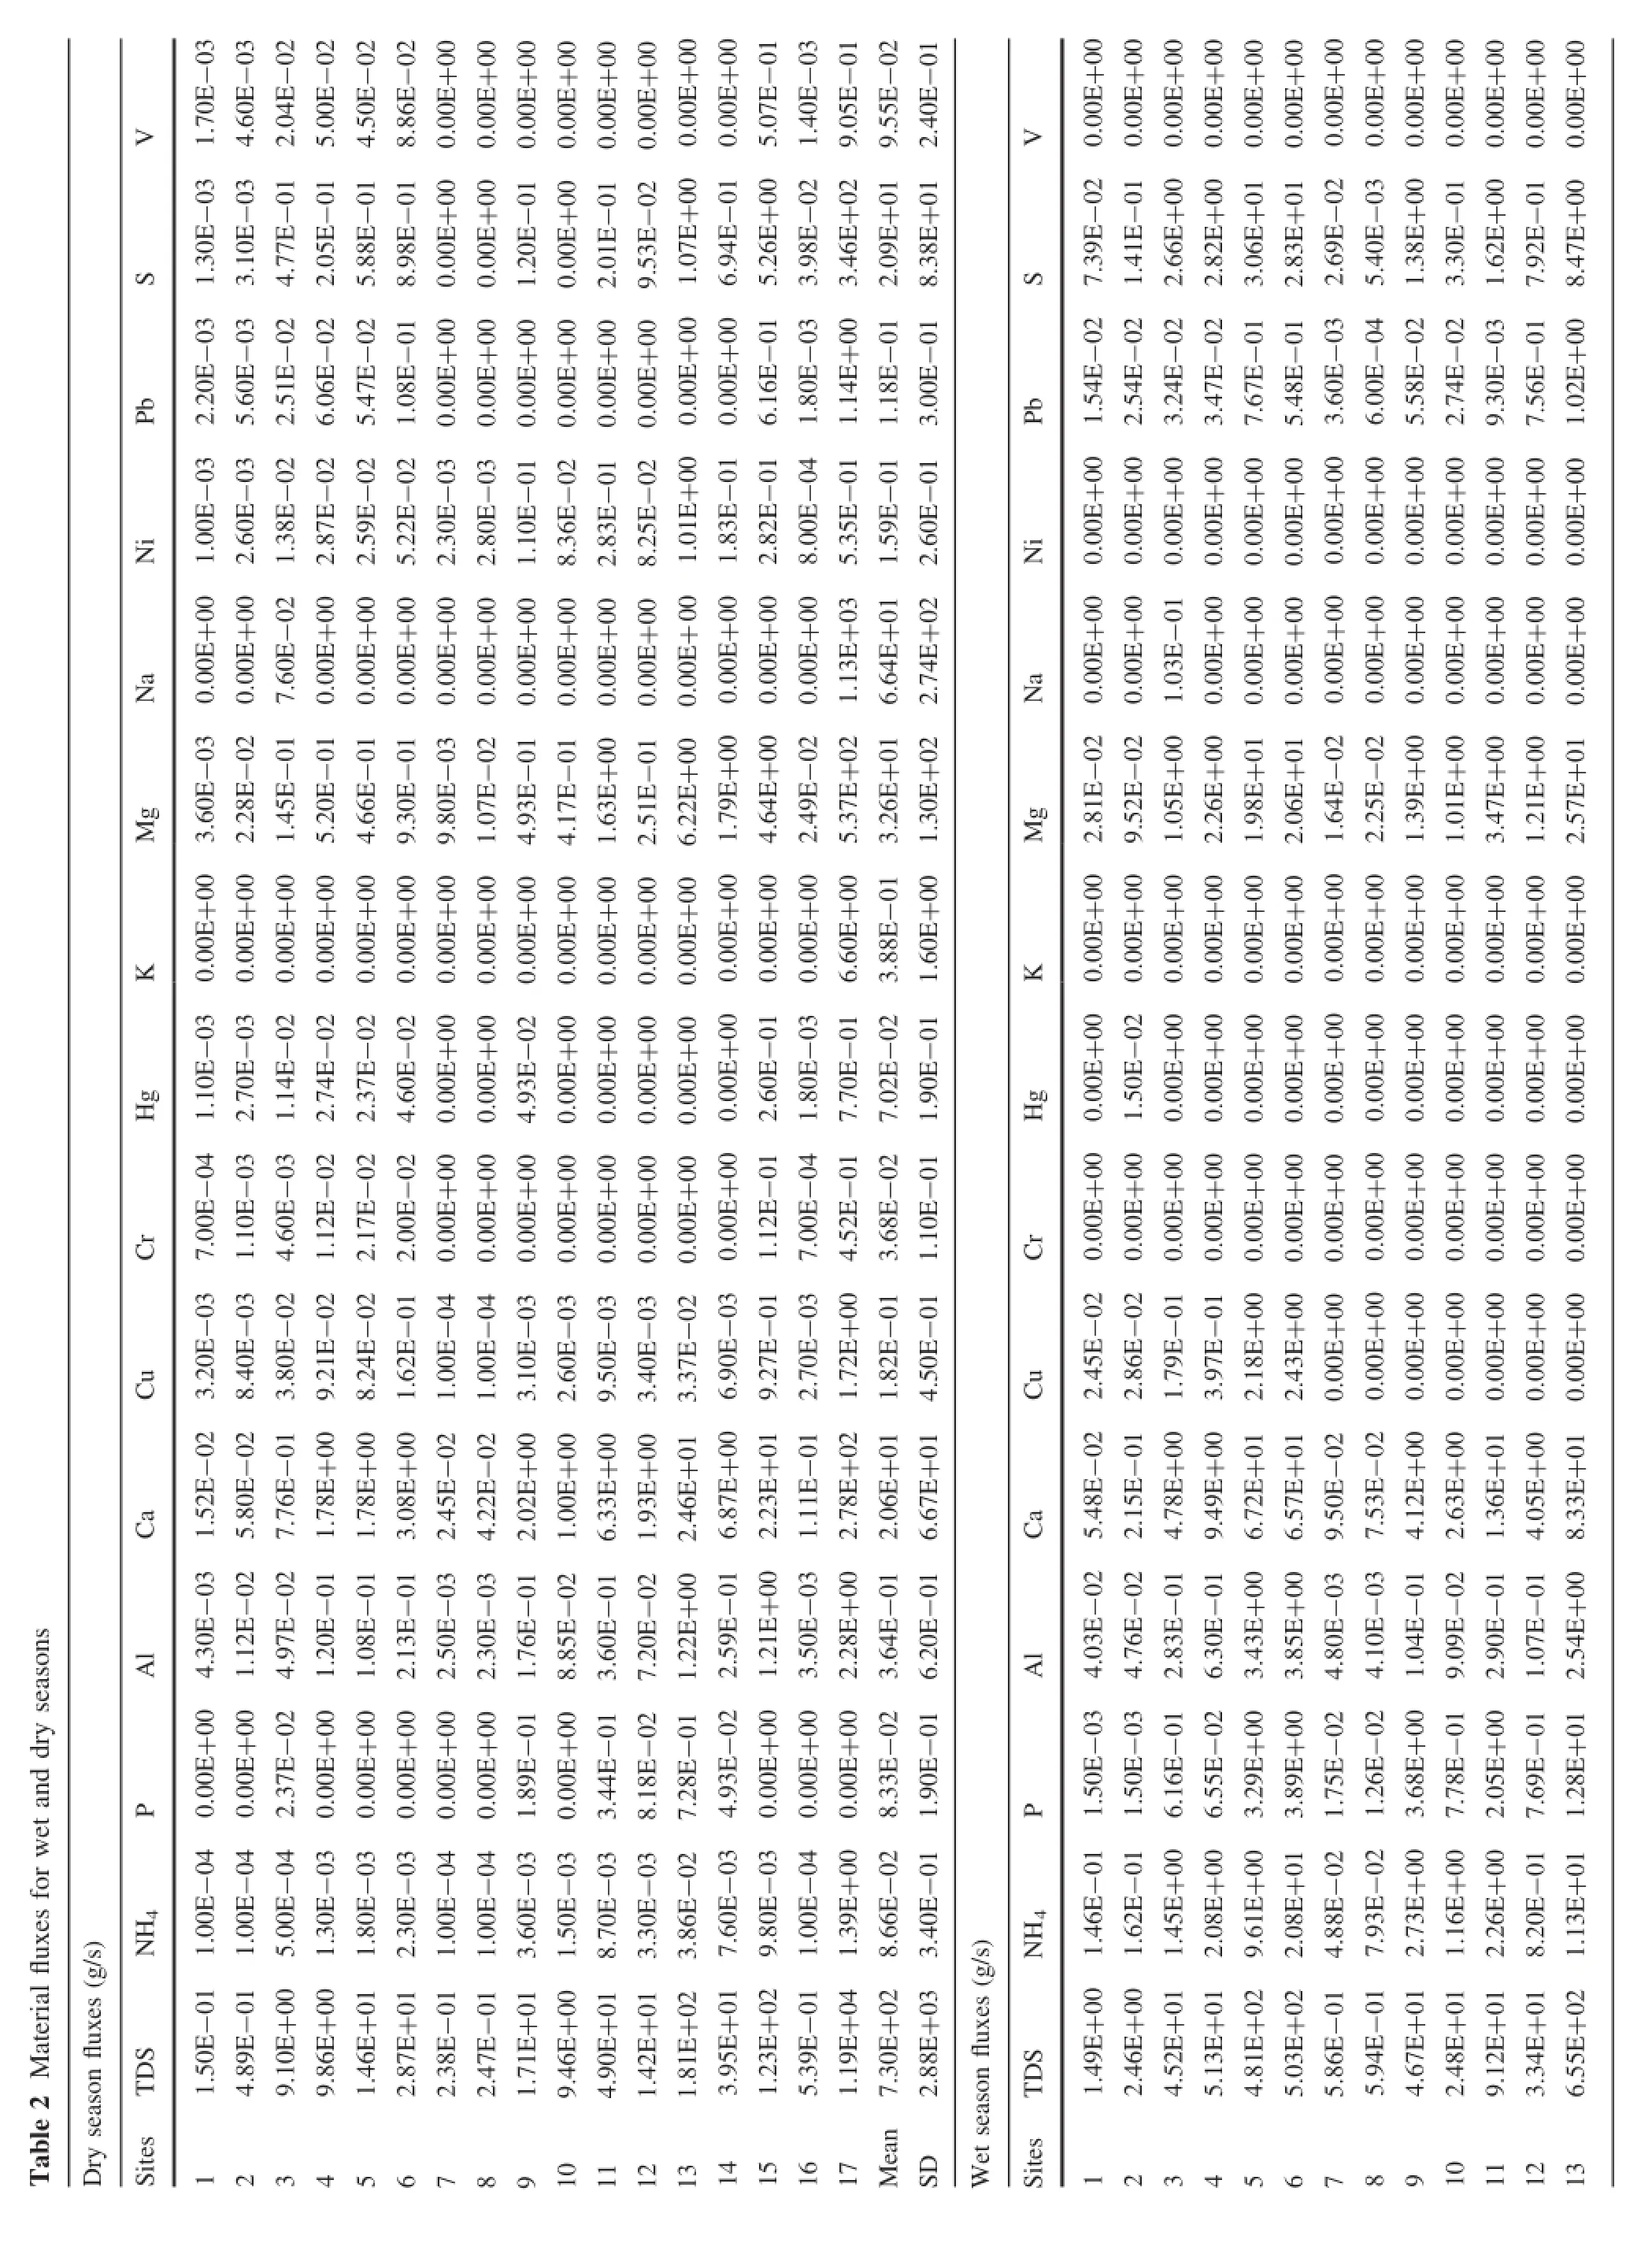
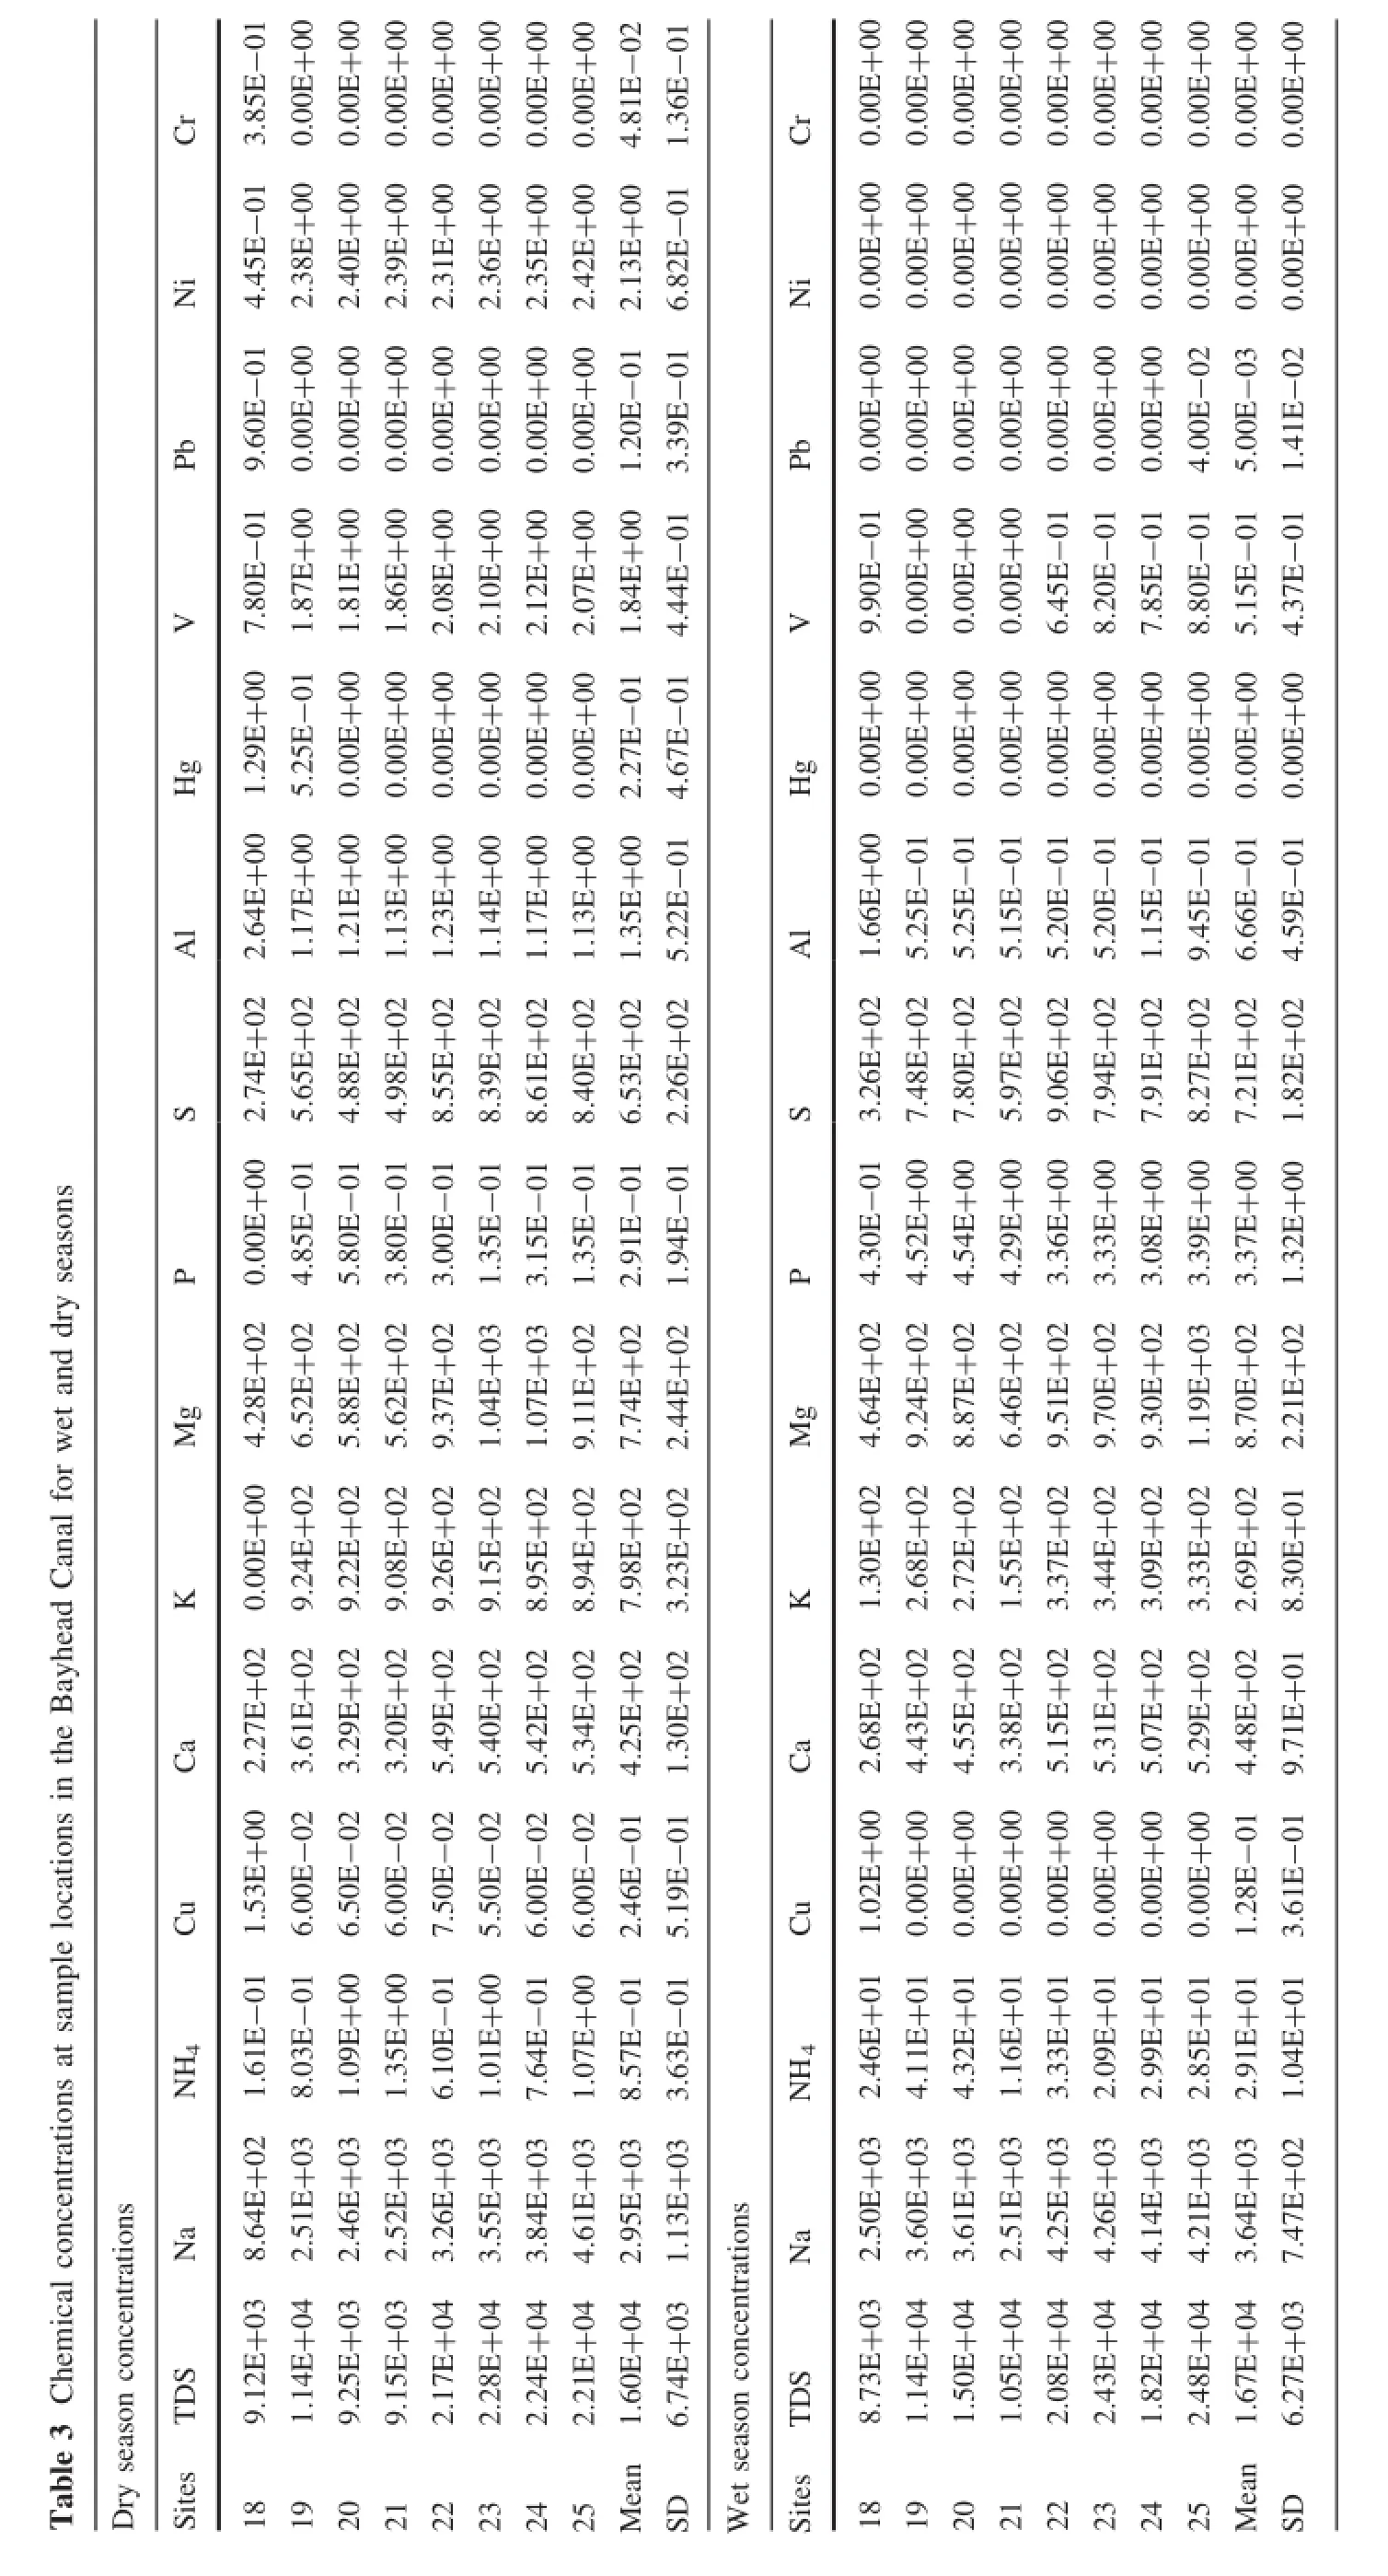
The seasonal variations in the material fluxes of measured parameters for the wet and dry seasons are illustrated in Table 2,and were explored statistically using Analysis of Variance(ANOVA).Corresponding chemical concentrations and discharge rates are represented in Fig.3a,b for comparative evaluation.In addition,chemical concentrations in the Bayhead Canal(Table 3)were used to generate interpolated images using ArcGIS 9®,to visually distinguish the effects of catchment material fluxes on the water quality of the Bayhead Canal(Fig.4).
4.1TDS flux
The average flux of TDS was found to be slightly higher for the dry season(Table 2),with no significant differences in the sites across seasons(ANOVA,p>0.05).Site 17displayed an anomalous increase for the dry season,which was primarily attributed to a substantial increase in the TDS concentration emanating from the high-density industrial area of the aManzimnyama catchment(Fig.3a). Other than sites 1,6,14 and 16 in the wet season,there was limited correspondence of seasonal fluxes with seasonal discharge rates,such that the mean dry season flux of TDS appeared to be higher than the wet season values.This could be a direct consequence of the limited dry season discharge rates,which allowed for the increased elemental concentrations and subsequent higher TDS concentrations observed(Fig.3a).The lower discharge rates of the dry season in relation to the wet season was further substantiated by the rainfall distribution patterns during the sampling events of this study,as depicted in Fig.2,where it was evident that lower rainfall events immediately preceded dry season sampling events(on 1st March 2012 and 1st June 2012),whilst higher rainfall events preceded wet season sampling events on(1st December 2011 and 1st September 2012).Examination of TDS concentrations inthe Bayhead Canal of the Durban Harbour showed a limited effect of canal freshwater inflows on the Bayhead Canal TDS concentrations at the confluences(Fig.4).This was not unexpected as the Bayhead Canal is a large marine-influenced body of water several orders of magnitude larger than the river discharge.
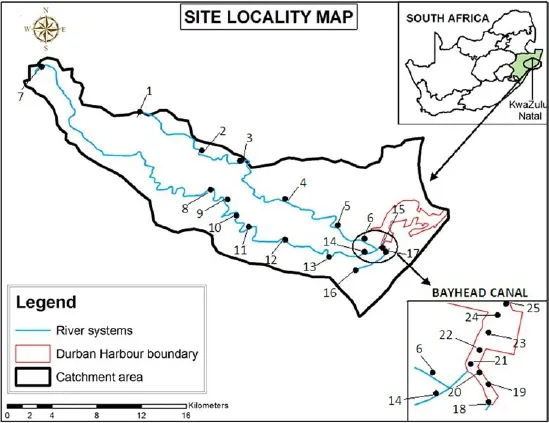
Fig.1 Catchments of the the three rivers and the Durban Harbour with sampling sites depicted
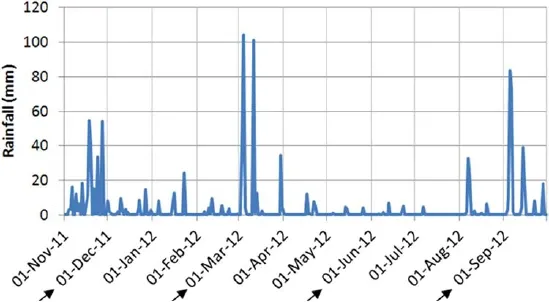
Fig.2 Rainfall distribution patterns in relation to four sampling events:1st Dec 2011(summer-wet season:28 mm),1st Mar 2012(autumn-dry season:7 mm),1st Jun 2012(winter-dry season:0 mm)and 1st Sep 2012(spring-wet season:3 mm).(Source SASRI 2013)
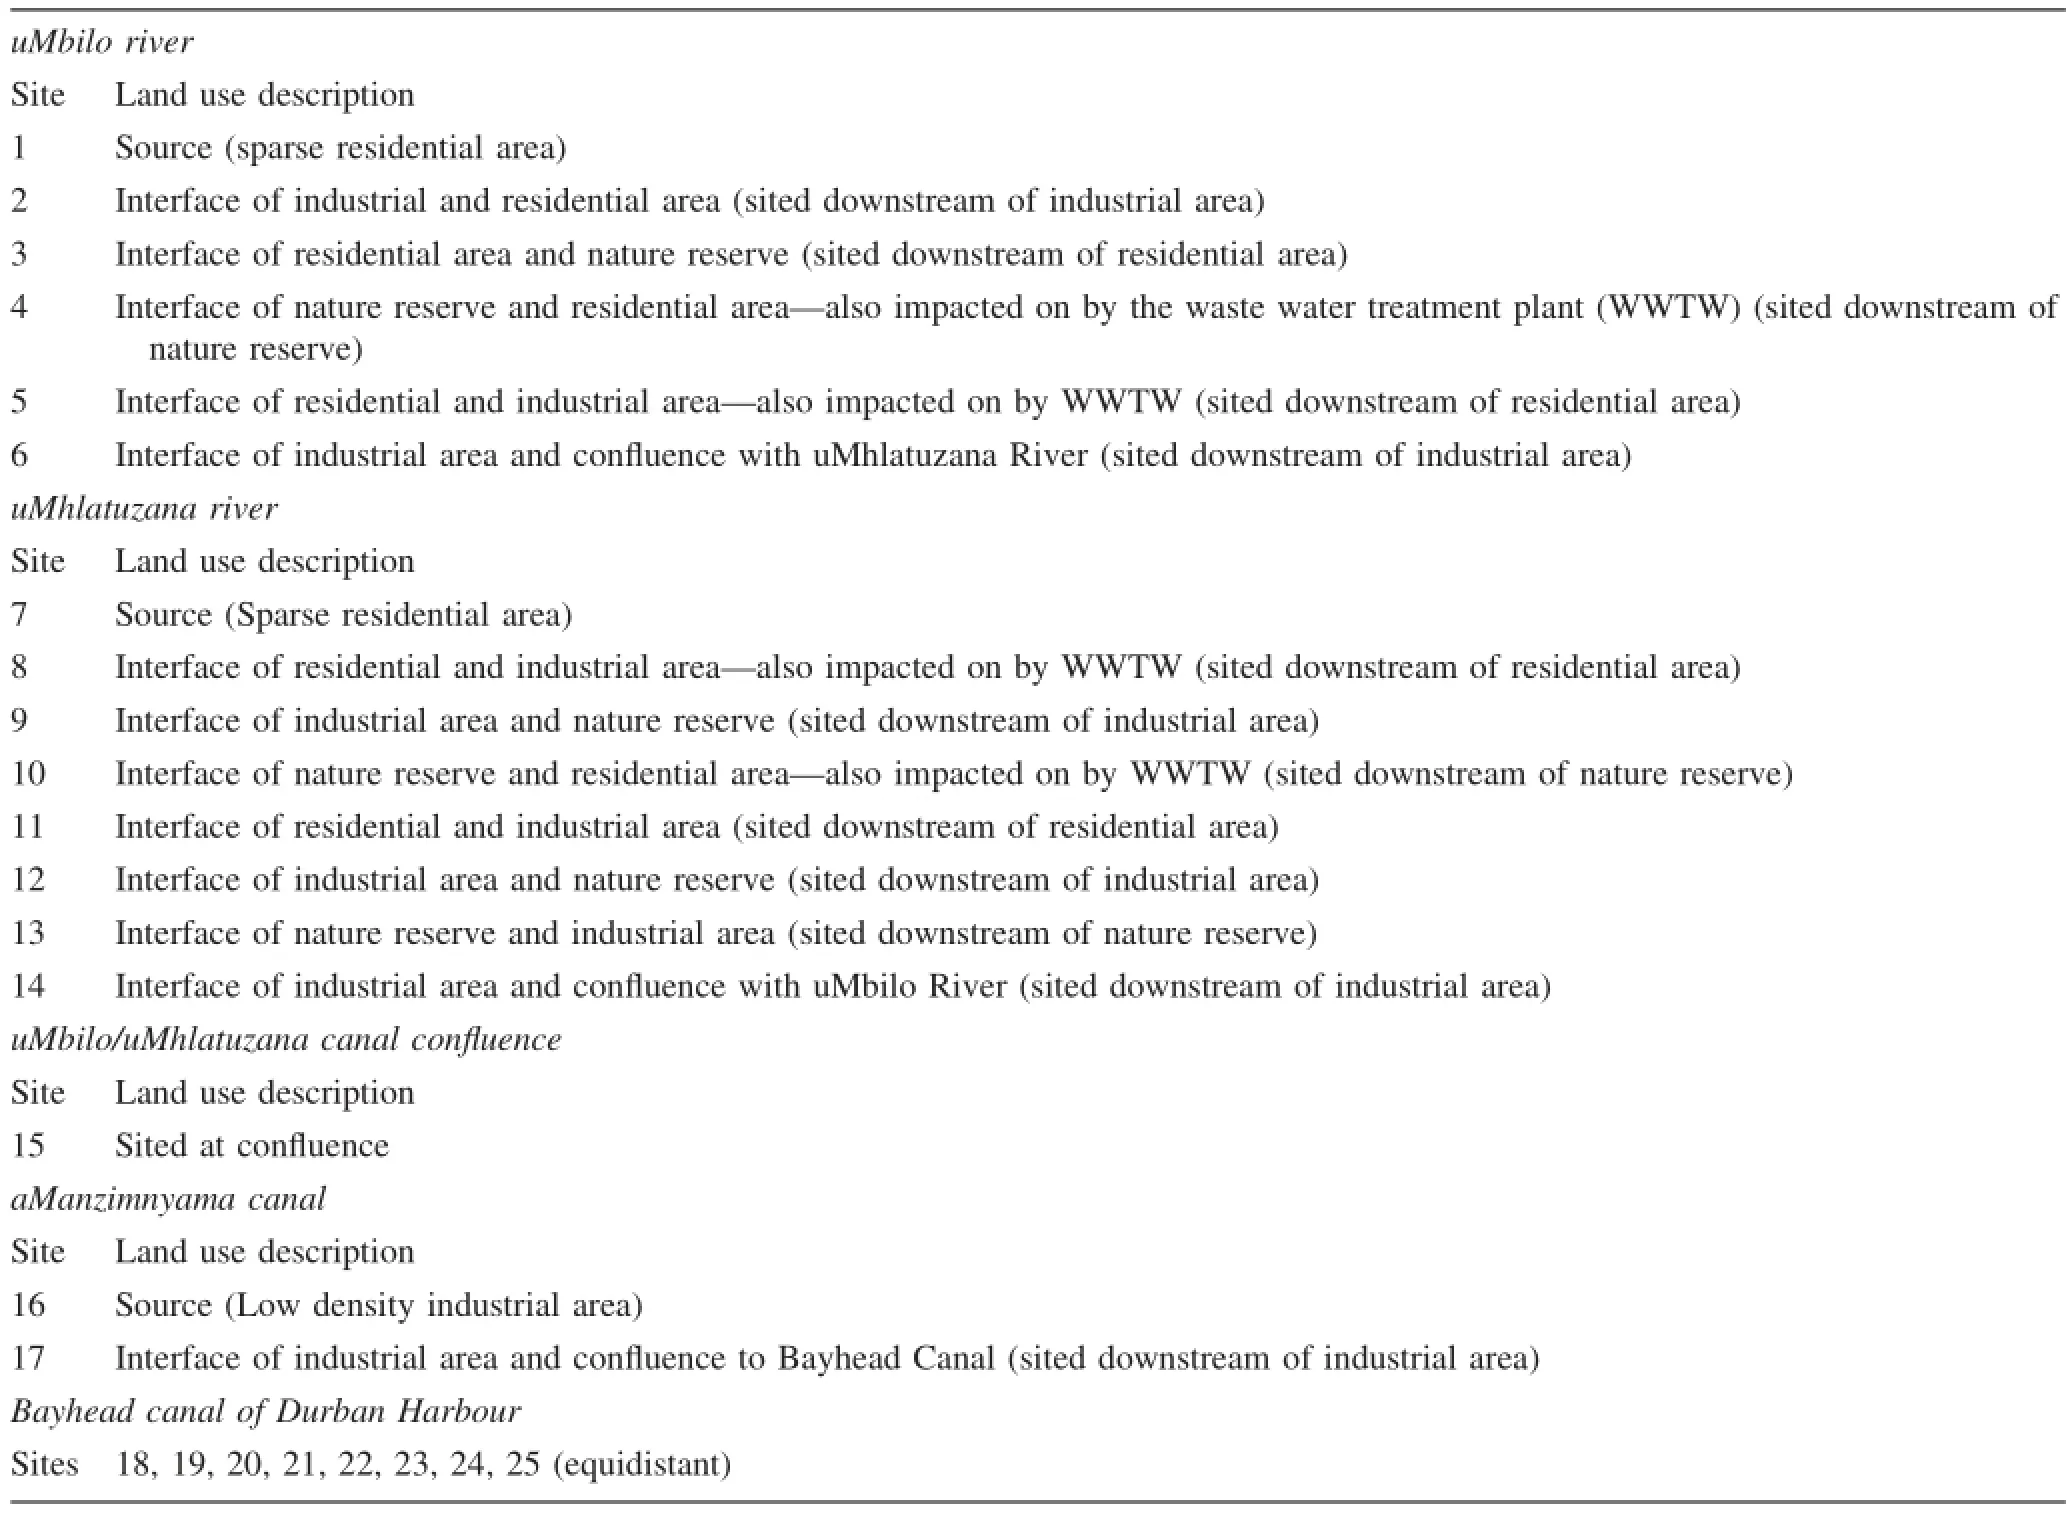
Table 1 Description of sample sites on the basis of land use
4.2NH4flux
The average flux of NH4was found to be significantly higher for sites in the wet season,as compared to the dry season(ANOVA,p<0.05).This was attributed to a combination of higher wet season discharge and subsequent NH4loading into the systems,following increased runoff from all catchment land-use zones(Figs.2,3a).The sources of increased NH4loading were attributed to runoff derived ammonia compounds from residential fertilizers and industrial activities(DWAF 1996a;Weijters et al. 2009),and were evident at sites 3,6,8,14 and 16.With reference to NH4loading,all sites exceeded the DWAF(1996a)prescribed target of 0.007 mg/L for aquatic life,rendering the systems unsuitable habitats for aquatic organisms.Sites 6,14,15 and 17 yielded anomalously high NH4fluxes in the wet season,reflective of industrial influences,whilst site 13,at the interface of the nature reserve and industrial land-use zone,also yielded a high wet season flux.Elevated discharge rates were observed at these sites in the wet season as a consequence of canalization and more impervious surfaces at these sectors. Despite the elevated flux at site 17 in both seasons,there appeared to be a limited effect of the aManzimnyama Canal inflows on NH4concentrations in the Bayhead Canal after the confluence(Fig.4).This was possibly a direct consequence of the dilution effects of the much larger Bayhead Canal.Similar observations were made for the confluence of the uMbilo/uMhlatuzana and Bayhead canals in both seasons.Increases in NH4concentrations were observed within the Bayhead Canal itself in the dry season,which related to point sources from storm water and sewer outfalls draining directly into the Bayhead Canal,as indicated in Fig.5 below.All sites in the Bayhead Canal exceeded the DWAF(1995)NH4target value of 0.02 mg/L in the coastal zone,highlighting the extent to which the water had become unsuitable for primary consumers.

4.3P flux
As in the case of NH4,Table 2 shows that P fluxes were found to be significantly higher across sites in the wet season as compared to the dry season(ANOVA,p<0.05). This was attributed to higher wet season P concentrations derived from increased surface runoff(Fig.2),which was possibly charged with P-containing compounds from residential and industrial land-use at sites 3,6,8 and 16(DWAF 1996a).Similar trends were evident internationally,with impervious urban catchment influence and increased surface runoff(Lee and Bang 2000;Tong and Chen 2002).P loading into the systems at all sites,except 1,2,4,5,6,7,8,10,15,16 and 17 in the dry season,exceeded the 0.025 mg/L freshwater guideline value rendering the systems toxic and hypertrophic(DWAF,1996a). Anomalously high fluxes were recorded at sites 13 and 14 in the wet season,primarily as a consequence of high discharge Fig.3a.The influence of the aManzimnyama and uMbilo/uMhlatuzana Canal fluxes on the P concentrations at the respective confluences of the Bayhead Canal was minimal across both seasons(Fig.4).As in the case of NH4,the increase in P concentrations in the Bayhead Canal was attributed as a direct consequence of point source pollutant loading through sewer outfalls and storm water discharges directly into the Bay Head Canal(Fig.5). DWAF(1995)states that the US-EPA target marine water quality range for P is 0.0001 mg/L.When present,P concentrations in the Bayhead Canal exceeded this limit.
4.4Al flux
The average wet season Al flux was higher than the average dry season values(Table 2),with no significant differ e nces in sites across seasons(ANOVA,p>0.05).An anomalously high Al flux was associated with site 15 in the wet season,which was attributed to a high Al concentration in conjunction with a high wet season discharge(Fig.3a). The high concentration at this site reflects combined contributions of the uMbilo and uMhlatuzana river systems,whilst the high discharge at this site was a result of the greater discharge through river canalization in these sectors.Al concentrations at all sites exceeded the prescribed Al freshwater quality range of 0.005-0.01 mg/L for aquatic habitats in both seasons(DWAF 1996a).The consistent presence of Al in sites 1-6(uMbilo River)in both seasons was unknown-possibly relating to the anthropogenic introduction of Al containing compounds at the upstream site 1,as evident in Fig.6.The substantial increase in fluxes at sites 5,6 and 17 in the wet season was mainly due to an increase in wet season discharge.Figure 4 shows that the aManzimnyama and uMbilo/uMhlatuzana inflows were influential on the Al concentrations in the Bayhead Canal,but to a lesser extent for the uMbilo/uMhlatuzana Canal in the dry season.Despite the lower Al flux contributions of the aManzimnyama Canal in relation to the uMbilo/uMhlatuzana Canal in both seasons,the zone of influence was greater at the confluence for the aManzimnyama Canal,indicating the presence of point source loading of Al from surrounding industries in close proximity to the confluence of the aManzimnyama and Bayhead Canals.
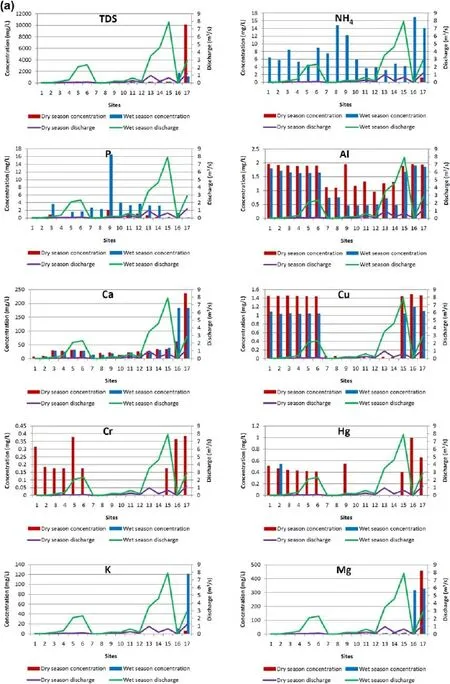
Fig.3 a Seasonal concentrations and discharge rates.b Seasonal concentrations and discharge rates
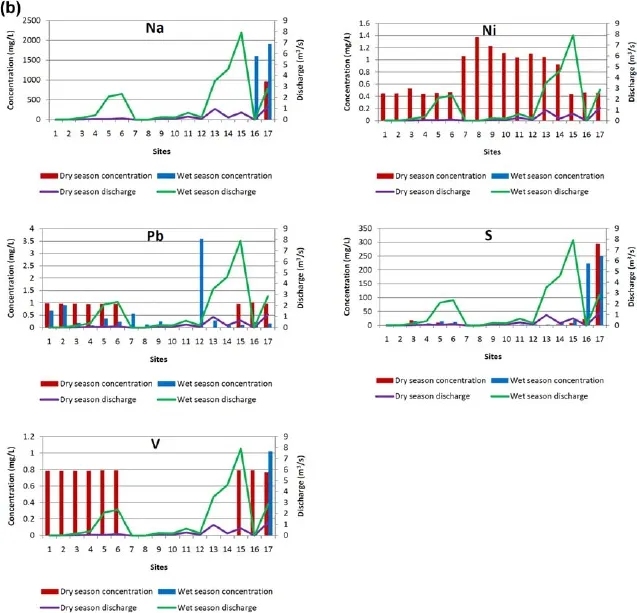
Fig.3 continued
4.5Ca flux
The average Ca fluxes were found to be higher for the wet season(Table 2),with no significant differences in sites across seasons(ANOVA,p>0.05).This was mainly attributed to elevated flux levels at sites 5,6,13,14,15 and 17 in the wet season.Figure 3(a)shows minimal inter-seasonal variations in Ca concentrations at these sites,with the higher wet season discharges most influential on the flux levels.The highest flux values were recorded at sites 14 and 15 in the wet season and at site 17 in both seasons.The increase in sites 14 and 15 was again attributed to high water discharge emanating as a consequence of the impervious canal in conjunction with higher rainfall.The canalized site 17 showed similar behavior,with the much higher values a direct consequence of industrial input in both seasons,as reflected in Fig.3a. This was supported by Robson and Neal(1997),who found that despite diffuse sources of Ca,an additional industrial contribution was always present.Analysis of Ca concentrations in the Bayhead Canal revealed a limited effect of fresh water inflows on Ca concentrations in the Bayhead Canal at the confluences(Fig.4).This is again reflective of the size difference of the Bay Head Canal and the feeding rivers.
?
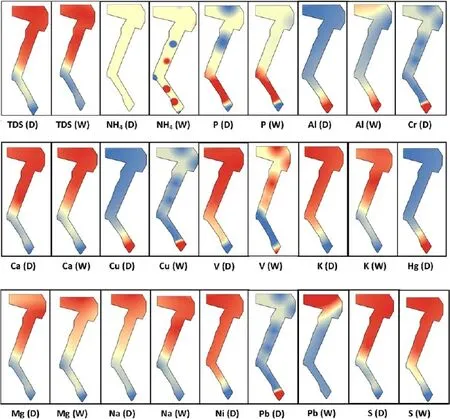
Fig.4 Interpolated images of Bayhead Canal chemical data-blue indicates low values transitioning to red indicating high values.Cr,Hg and Ni were undetected in the wet season

Fig.5 Storm water outflows(black piping)in the Bayhead Canal between both freshwater confluences
4.6Cu flux
Average Cu fluxes were found to be higher in the wet season with no significant differences in the sites across seasons(ANOVA,p>0.05)(Table 2).Cu concentrations exceeded the aquatic life guideline value of 0.0014 mg/L at all sites and seasons,other than sites 7-14 in the wet season(DWAF 1996a).The consistent presence of Cu in sites 1-6(uMbilo River)in both seasons was unknown-possibly relating to the introduction of Cu containing compounds atthe upstream site 1,as in the case of Al(Fig.6).The highest fluxes were recorded at sites 5,6,15 and 17 in the wet season.Marginal variations in Cu concentrations between both seasons at these sites lend confidence to our assumption that wet season discharge governs the higher wet season fluxes(Fig.3a).Despite the lower Cu flux contribution of the aManzimnyama Canal in the wet season in relation to the uMbilo/u Mhlatuzana Canal,the zone of influence was greater at the confluence of the aManzimnyama Canal in both seasons(Fig.4).As in the case of Al,this could be indicative of point source loading of Cu from surrounding industry in close proximity to the confluence of the aManzimnyama and Bayhead Canals.According to DWAF(1995),the target marine water quality range of Cu for primary consumers is 0.005 mg/L.With the exception of sites 19-25 in the Bayhead Canal in the wet season,all other sites in the Bayhead Canal exceeded this limit.
4.7Cr flux
The average dry season fluxes of Cr were higher than the wet season(Table 2),with no significant differences in sites across seasons(ANOVA,p>0.05).Cr concentrations at sites 1-6 and sites 15-17 in the dry season exceeded the target freshwater quality range of 0.012 mg/L for aquatic life(DWAF 1996a).The highest flux in the dry season occurred at site 17 before the confluence of the Bayhead Canal,as a consequence of increased industrial inputs from the associated aManzimnyama catchment(Fig.3a).This is substantiated by the fact that Cr salts are extensively used by most chemical manufacturing and metal industries(DWAF 1996a).Other water quality studies have also found that elevated Cr concentrations in the natural environment were almost entirely influenced by contributions from industrial sources(Robson and Neal 1997;Wilkinson and McElroy 2007).The effect of fluxes at site 17 in the dry season on the water quality of the Bayhead Canal is illustrated in Fig.4,where it is shown that the maximum zone of influence occurrs at the confluence of the aManzimnyama and Bayhead canals.No Cr was detected in the Bayhead Canal in the wet season(Table 2).However,with reference to the DWAF(1995)water quality standards,the concentration of Cr at site 18 near the confluence of the Bayhead and aManzimnyama Canals greatly exceeded the target marine water quality limit of 0.008 mg/L for primary producers in the dry season.
4.8Hg flux
Dry season average fluxes of Hg were found to be marginally higher than the wet season,as indicated in Table 2,with no significant differences in sites across seasons(ANOVA,p>0.05).Sites 2 in the wet and dry seasons,as well as sites 1-6,9 and 15-17 in the dry season,exceeded the target freshwater habitat guideline value of 0.00004 mg/L for Hg(DWAF 1996a).The consistent presence of Hg in sites 1-6(uMbilo River)in the dry season was not clearly understood and was possibly related to the introduction of Hg containing compounds at the upstream site 1,as in the case of Al and Cu(Fig.6).As in the case of Cr,the highestflux in the dry season was found to be at site 17 before the confluence of the Bayhead Canal.This could be related to industrial loading of Hg from the associated aManzimnyama catchment(Fig.3a),as Hg is commonly used in industrialprocesses(DWAF 1996a). This effect was transferred to the dry season water quality of the Bayhead Canal,as illustrated in Fig.4,where it was shown that the maximum zone of influence occurs at the confluence of the aManzimnyama and Bayhead canals after site 17.No Hg was detected in the Bayhead Canal in the wet season,which was probably due to the complete absence of Hg inflows into the Bayhead Canal from the respective catchment canals in the wet season(Table 2).Hg concentrations at sites 18 and 19(Table 3)exceeded the prescribed marine water quality guideline of 0.0003 mg/L for primary producers in the dry season(DWAF 1995).
4.9K flux
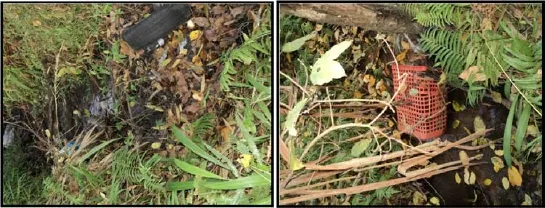
Fig.6 Evidence of illegal dumping at upstream site 1(uMbilo River)
The average K fluxes were higher for the wet season(Table 2),with no significant differences in sites acrossseasons(ANOVA,p>0.05).This was mainly attributed to the elevated flux recorded at site 17 in the wet season,which was directly related to an anomalous peak in K concentration at this site in conjunction with the elevated wet season discharge,as indicated in Fig.3a.The increase in K concentration at site 17 in the wet season was more than likely associated with industrial input from the aManzimnyama catchment.Despite the elevated K flux at site 17 in both seasons,Fig.4 shows that the K fluxes emanating from the aManzimnyama Canal before the confluence had a limited effect on the K concentrations in the Bayhead Canal.As in the case of TDS and Ca,this was a consequence of the dilution effect of a much larger marine water body(DWAF 1995).
4.10Mg flux
The average Mg fluxes were found to be higher for the wet season with no significant differences in sites across seasons(ANOVA,p>0.05).This was mainly attributed to elevated flux levels at sites 5,6,13,14,15 and 17 in the wet season-as in the case of the Ca values(Table 2),with minimal inter-seasonal variations at most sites(Fig.3a). Despite the much higher fluxes of the aManzimnyama Canal in relation to the uMbilo/uMhlatuzana Canal before the confluences in both seasons,there was a limited effect of catchment inflows on the Mg concentrations in the Bayhead Canal at the confluence with the aManzimnyama Canal(Fig.4),as was the case with TDS,Ca and K.
4.11Na flux
The average wet season Na flux was higher as compared to the dry season(Table 2),with no significant differences in sites across seasons(ANOVA,p>0.05).This was primarily attributed to distinct increases at sites 16 and 17 in the wet season-a direct result of increased loading through industrial inputs coupled with a higher wet season discharge(Fig.3b).The absence of Na in the uMbilo/ uMhlatuzana Canal implied no Na flux transfer into the Bayhead Canal from the uMbilo/uMhlatuzana catchment. However,the elevated Na fluxes recorded for both seasons at site 17 before the confluence of the aManzimnyama and Bayhead canals had minimal effects on Na concentrations in the Bayhead Canal after the confluence(Fig.4).
4.12Ni flux
The average dry season fluxes of Ni were found to be significantly higher than the wet season at sites across seasons(ANOVA,p<0.05)(Table 2).Whilst there was minimal variation in the Ni concentrations for the sites along the uMhlatuzana River in the dry season(sites 7-14),
there was a distinct increase in Ni flux at site 13(nature reserve)evidently related to leaching and the higher discharge at this site(Fig.3b).Despite the slightly higher flux of Ni emanating at site 17 from the aManzimnyama Canal,as compared to site 15 of the uMbilo/uMhlatuzana Canal before the confluence with the Bayhead Canal,this increase had a limited effect on Ni concentrations in the Bayhead Canal.This can be attributed to Ni predominantly derived from port related activities,as evident in Fig.4.The target marine water quality range of Ni for primary producers is 0.025 mg/L(DWAF 1995).All sites in the dry season exceeded this limit.
4.13Pb flux
The average wet season Pb flux was marginally higher than the corresponding dry season value(Table 2),with no significant differences in the sites across seasons(ANOVA,p>0.05).The highest Pb fluxes were associated with site 17 in the dry season and sites 13 and 15 in the wet season. The increase in site 17 in the dry season was a direct indication of an increased Pb concentration associated with the industrial input of the aManzimnyama catchment(Fig.3b).The flux increases at sites 13 and 15 in the wet season were directly related to the elevated wet season discharges.With the exception of sites 7-14 in the dry season,all sites exceeded the freshwater guideline of 0.0012 mg/L for aquatic environments in both seasons(DWAF 1996a).As illustrated in Fig.4,the elevated dry season flux of Pb at site 17 before the confluence with the Bayhead Canal accounted for a higher Pb concentration after the confluence(site 18),in relation to the corresponding wet season value.As with previous elements,the Pb fluxes emanating from the uMbilo/uMhlatuzana Canals in both seasons had a limited effect on the Pb concentrations in the Bayhead Canal.The target marine water quality Pb guideline value for primary producers is 0.012 mg/L(DWAF 1995).Site 18 in the dry season and site 25 in the wet season exceed this range,implicating aManzimnyama Canal inflows and port sources of Pb,respectively,as contaminant sources.
4.14S flux
The average wet season flux of S was found to be higher than the corresponding dry season values(Table 2),with no significant differences in sites across seasons(ANOVA,p>0.05).This was primarily due to increased fluxes associated with sites 5,6,14,15 and 17 in the wet season. Increases at sites 5 and 6 were associated with an elevated wet season discharge(Fig.3b).Such was the case for sites 14 and 15 in the wet season,which was characterised by a substantially higher discharge,owing to an imperviousunderlying canal surface at these sites.The substantial increase in S fluxes at site 17 in the wet season was a function of a high wet season S concentration through industrial input;in conjunction with a higher wet season discharge.The high S loading of site 17 greatly exceeded the long term freshwater guideline value of 50 mg/L(CEQG 2005),but displayed little influence on S concentrations of the Bayhead Canal(Fig.4).Whilst it was evident that the S concentrations tended to increase towards the port waters,implicating port activities as a possible source of S loading into the Bayhead Canal,limited effects of uMbilo/uMhlatuzana inflows on S concentrations in the Bayhead Canal in the wet season were recorded.This was supported by the fact that there appeared to be higher S flux emanating from site 15(uMbilo/uMhlatuzana Canal)before the confluence with the Bayhead Canal in the wet season as compared to the dry season(Table 2).
4.15V flux
Despite the increased average dry season V concentrations,the average wet season V fluxes were found to be higher primarily when relating to an elevated wet season discharge(Table 2;Fig.3b),with no significant differences in sites across seasons(ANOVA,p>0.05).The highest V flux was recorded at site 17 in the wet season and was substantially higher in relation to the remaining sites in both seasons.This was a direct result of elevated V loading due to industrial input from the aManzimnyama catchment in the wet season,in conjunction with a higher wet season discharge(Fig.3b).Industrial inputs may be attributed to the fact that V is commonly used in steel and metallurgical industries(WHO 2000).The consistent presence of V in sites 1-6(uMbilo River)in the dry season was unknown-possibly relating to the introduction of V containing compounds upstream at site 1(Fig.6).The high wet season V flux at site 17 before the confluence with the Bayhead Canal possibly explained the elevated V concentration after the confluence in the wet season.In contrast,the uMbilo/u Mhlatuzana Canal inflows had a limited effect on V concentrations in the Bayhead Canal in the wet season-most likely due to the absence of V at site 15 before the confluence.The higher dry season flux emanating from site 15 accounted for elevated V concentrations in the Bayhead Canal for the dry season after the confluence of the uMbilo/u Mhlatuzana and Bayhead canals(Fig.4).In the absence of relevant South African V guidelines for the coastal zone,DWAF(1995)states the EEC(after UK)international target value of 0.1 mg/L.With the exception of sites 19-21 in the wet season,all other sites in the Bayhead Canal exceeded this limit in both seasons.
5 Conclusion
The catchments of the uMbilo,uMhlatuzana and aManzimnyama River systems have been subject to intense human development over the past few decades,which has largely accounted for the spatial and temporal variability of the water quality.This study showed that the intensification of anthropogenic activities and processes operating within the catchment,primarily through industry,have caused a general deterioration of selected physico-chemical water quality parameters across all land-use types on the basis of the parameters analysed.The following summarizes key findings relating to the water quality of the studied area:
-When present,nutrients(NH4and P)and trace metals(Cu,Hg,Pb and Cr)exceeded prescribed South African freshwater and marine guidelines;
-Al exceeded prescribed South African freshwater guidelines.No South African marine water quality guidelines were available for Al;
-V and Ni exceeded South African marine water quality guidelines.No South African freshwater guidelines were available for these metals and,
-Land use,seasonality and river flow were significant determinants of material loading in the rivers and the receiving port waters.
In all the above cases,the relevant water quality guidelines categorized the systems as unsuitable for supporting aquatic life.
In terms of material fluxes for the parameters analysed,the following summarizes the key findings:
-Anomalously high discharge rates due to canalised portions of the river systems at sites 5,6,13,14,15 and 17 in the wet season generally accounted for elevated dissolved chemical fluxes of parameters at these sites when present;
-In contrast,anomalously high fluxes were noted for NH4(sites 8 and 9 in the wet season),P(site 9 in the wet season),Al(site 9 in the dry season),Cr(sites 1,5 and 15 in the dry season),Hg(site 2 during both seasons and sites 1,9 and 15 in the dry season),Ni(site 8 in the dry season),Pb(site 12 in the wet season)as a direct consequence of increased chemical loading into the systems,mainly from residential and industrial land-use associated with most of these sites;and
-High fluxes of Al,Cu,Hg(dry season)and V(dry season)were associated with sites 1-6(uMbilo catchment),which resulted in elevated fluxes of these metals at site 15,at the confluence of the uMbilo and uMhlatuzana river catchments.The source of the consistent presence of these elements in sites 1-6(uMbilo River)was not known-but was possiblyrelated to the anthropogenic introduction of these elements at the upstream site.
Additionally,analysis of the material mass transport capacities of the respective catchment canals just before the confluence with the Bayhead Canal of the Durban Bay Harbour showed minimal influence on chemical concentrations of the port waters for TDS,Na,NH4,Ca,K,Mg,P,Ni,V and S,due to the disparate size difference of the two environments,suggesting that the origin of these chemicals in the Bay to emanate from the port activity itself.The chemical fluxes emanating from the aManzimnyama Canal were most influential on the Cu,Cr,Hg,V,Pb and Al concentrations in the Bayhead Canal near the confluence.
Although not all possible water quality variables were analysed nor was analysis done in conjunction with detailed hydrodynamic modelling of the Bayhead Canal,this study has been very useful in highlighting the possible impacts of catchment land-use and associated canal inflows on the water quality of the river systems,as well as on that of the Bayhead Canal,in terms of the material mass transport capacity of the associated inflows.
Acknowledgments The authors are grateful to the National Research Foundation(NRF)for financial support during this study.
References
Bullard WE(1966)Effects of land use on water resources.Water Pollut Control Fed 38:645-659
CEQG(2005)Canadian environmental quality guidelines summary table.canadian council of ministers of the environment.http://stts.ccme.ca/.Accessed 02 Nov 2012
Chapman D(ed)(1992)Water quality assessments:a guide to the use of biota,sediments and water in environmental monitoring,2nd edn.E&FN Spon,London
Cruzado A,Velasquez Z,del Carmen Perez M,Bahamon N,Grimaldo NS,Ridolfi F(2002)Nutrient fluxes from the Ebro River and subsequent across-shelf dispersion.Cont Shelf Res 22:349-360
Dauer DM,Weisberg SB,Ranasinghe JA (2000)Relationships between benthic community condition,water quality,sediment quality,nutrient loads,and land use patterns in Chesapeake Bay. Estuaries 23:80-96
DWAF(1995)South African water quality guidelines,vol 1:for coastal and marine waters-natural environment.Department of Water Affairs and Forestry,Pretoria,South Africa
DWAF(1996a)South African water quality guidelines,vol 7:aquatic ecosystems.Department of Water Affairs and Forestry,Pretoria
Lee JH,Bang KW (2000)Characterization of urban stormwater runoff.Wat Res 34:1773-1780
Li S,Gu S,Liu W,Han H,Zhang Q(2008)Water quality in relation to land use and land cover in the upper Han River Basin,China. Catena 75:216-222
Masamba WRL,Mazvimavi D(2008)Impact on water quality of land uses along Thamalakane-Boteti River:an outlet of the Okavango Delta.Phys Chem Earth 33:687-694
MER/ERM (2011)Development of the bay of natal estuarine management plan:situation assessment.Report prepared for eThekwini municipality,transnet national port authority and the department of agriculture,Environmental Affairs and Rural Development
Ngila JC(2008)Environmental chemistry practical manual.School of pure and applied chemistry,University of KwaZulu-Natal,Westville Campus
Robson AJ,Neal C(1997)A summary of regional water quality for Eastern UK rivers.Sci Total Environ 194(195):15-37
SASRI(2013)Weather web:rainfall data for Mount Edgecombe monitoring station for 01 Nov 2011-30 Sept 2012
Sigleo A,Frick W(2007)Seasonal variations in river discharge and nutrientexport to a Northeastern Pacific estuary.Estuar,Coastal Shelf Sci 73:368-378
South African Sugarcane Research Institute.http://portal.sasa.org.za/ weatherweb/.Accessed 04 April 2013
Tomar M(1999)Quality assessment of water and wastewater.Lewis,New York
Tong STY,Chen W(2002)Modeling the relationship between land use and surface water quality.J Environ Manag 66:377-393
Weijters MJ,Janse JH,Alkemade R,Verhoeven JTA(2009)Quantifying the effect of catchment land use and water nutrient concentrations on freshwater river and stream biodiversity. Aquat Conserv 19:104-112
WHO(2000)Air quality guidelines,2nd edn.Regional office for Europe,Copenhagen
Wilkinson BH,McElroy BJ(2007)The impact of humans on continental erosion and sedimentation.GSA Bull 119:140-156
18 August 2015/Revised:29 December 2015/Accepted:23 February 2016/Published online:7 March 2016
©Science Press,Institute of Geochemistry,CAS and Springer-Verlag Berlin Heidelberg 2016
杂志排行
Acta Geochimica的其它文章
- Fractionation characteristics of rare earth elements(REEs)linked with secondary Fe,Mn,and Al minerals in soils
- Distribution,fractionation,and contamination assessment of heavy metals in offshore surface sediments from western Xiamen Bay,China
- Ra's Abdah of the north Eastern Desert of Egypt:the roleof granitic dykes in the formation of radioactive mineralization,evidenced by zircon morphology and chemistry
- Copper partitioning between granitic silicate melt and coexisting aqueous fluid at 850°C and 100 MPa
- The genetic relationship between Habo alkaline intrusion and its surrounding deposits,Yunnan Province,China:geological and S-Pb isotopic evidences
- Study on oil-source correlation by analyzing organic geochemistry characteristics:a case study of the Upper Triassic Yanchang Formation in the south of Ordos Basin,China
