Computation of vortical flow and flow induced noise by large eddy simulation with FW-H acoustic analogy and Powell vortex sound theory*
2016-10-14NanZHANG张楠HuaXIE谢华XingWANG王星BaoshanWU吴宝山
Nan ZHANG (张楠),Hua XIE (谢华),Xing WANG (王星),Bao-shan WU (吴宝山)
National Key Laboratory of Hydrodynamics,China Ship Scientific Research Center,Wuxi 214082,China,E-mail:zn_nan@sina.com
Computation of vortical flow and flow induced noise by large eddy simulation with FW-H acoustic analogy and Powell vortex sound theory*
Nan ZHANG (张楠),Hua XIE (谢华),Xing WANG (王星),Bao-shan WU (吴宝山)
National Key Laboratory of Hydrodynamics,China Ship Scientific Research Center,Wuxi 214082,China,E-mail:zn_nan@sina.com
The sound generated by a NACA0012 airfoil in the wake of a rod is numerically simulated by two approaches,one is the large eddy simulation (LES) with the FW-H acoustic analogy and the other is the LES with the Powell vortex sound theory,in order to compare the accuracies of their predictions.The vortical structures around the rod-airfoil are computed by the LES and captured by the vortex identification(Q).The acoustic predictions are verified by the measurements.It is shown that the computed results by the two hybrid approa- ches (LES and FW-H,LES and Powell) are very similar.Both are shown to be satisfactory in the prediction of the noise generated by an unsteady flow.Subsequently,the numerical simulations of the wall pressure fluctuations and the flow-induced noise of a NACA0015 airfoil are made by the two hybrid approaches.At two angles of attack (0oand 8o),the wall pressure fluctuations of the NACA0015 airfoil are computed.The obtained power spectra of the wall pressure fluctuations are analyzed and compared with the measured data.And the vortical structures around the airfoil at two angles of attack are simulated and analyzed.After that,the flow induced noises of the NACA0015 airfoil at two angles of attack are predicted by the two hybrid approaches (LES and FW-H,LES and Powell).The radiated sound spectra are analyzed and compared with the experimental data.Comparisons show that both are robust,credible and satisfactory in the numerical prediction of the flow induced noise.All numerical simulations are carried out by parallel processing in the Wuxi supercomputing center.
flow induced noise,large eddy simulation (LES),FW-H acoustic analogy,powell vortex sound theory,rod-airfoil,airfoil
Introduction
The unsteady flow,the wall pressure fluctuations and the flow induced noise are three interesting but difficult problems in the field of aero-hydroacoustics.The flow induced noise is an important issue in many engineering applications.It can cause human discomfort and influence the stealth operation of military vehicles.In industrial applications,the noises generated by the turbine,the propeller,the hydrofoil,and even the transitional and turbulent boundary layer on the surface of the vehicle are a serious concern.Therefore,the fluid-acoustic coupling becomes a promising research topic.
The mechanism of the aerodynamic noise gene-rated by a turbulent shear flow has been a subject of great interest since Lighthill (1952) first formulated a general theory (acoustic analogy) for the aeroacoustics.In the theory,the sound is induced by the unsteady flow through the nonlinear interaction between the velocity fluctuations,the entropy fluctuations,as well as the viscous stress.The sound can be predicted by separating the computations of the source flow field and the resulting acoustical field.When a flow encounters a solid body,Curle's integral solution (1955) to the Lighthill equation provides a theoretical framework for predicting the noise generated by the flowbody interaction.The presence of solid boundaries generally makes the sound radiation more efficient.The most general form of the Lighthill's analogy is the extension developed by F fowcs Williams and Hawkings (1969),where the effect of surfaces in arbitrary motion is incorporated[1].The powerful technique of the generalized function theory was used to develop the FW-H equation,which is an exact rearra-ngement of the continuity equation and the Navier-Stokes equations into the form of an inhomogeneous wave equation with two surface source terms (monopole and dipole) and a volume source term (quadrupole).The method of the FW-H acoustic analogy is very efficient.Today,the FW-H method has become a viable approach for the aero-hydroacoustic noise problems[2].
One of the drawbacks of the acoustic analogy of Lighthill is that the source term is spatially quite extended.As observed by Powell,the sound production in a subsonic homoentropic flow is associated to the dynamics of vortices.Vorticity appears to be spatially less extended than the Reynolds stress.Around vortices there is a large region of potential flow that actually does not produce any sound.Powell[3]established the vortex sound theory under the free-field condition at low Mach numbers.It was a special form of the Lighthill's analogy stressing the role of vorticity,in which the role of vorticity becomes explicit.Various modifications of the theory of Powell were proposed to more explicitly impose the conservation of the momentum and the energy on the flow in the source region[4,5].This also improves the performance of the theory.
Computational fluid dynamics (CFD) has reached a mature stage to solve many industrial problems routinely.Consequently,the field of the fluid-acoustic coupling is a hot spot of researches.For a long time they were mostly analytical and experimental studies,but the remarkable advances in computer technology have made a numerical approach feasible.The most general methodology for the prediction of the flow induced noise,which is defined as a hybrid approach,is to compute the near-field of the unsteady flow field using the large eddy simulation (LES) with an acoustic analogy for the far-field sound.
More recently,computations of the flow induced noise for curved geometries were carried out.Cylinders and airfoils are so far the most-studied curved geometries,due to the large amount of experimental data available and the fundamental academic interest.A number of time-accurate numerical studies were carried out for airfoils,generally using the acoustic analogy to obtain the far-field sound.Wang and Moin[6]studied the turbulent flow around the trailing edge of a strut by the LES.The incompressible flow data were used to calculate the far-field acoustic information using an integral formulation of the Lighthill's equation.A reasonable agreement was achieved between their computed acoustic field and the experimental results.Manoha[7]performed an LES simulation around a NACA 0012 airfoil placed at an angle of incidence of 5owith respect to the incoming flow.A Kirchhoff formulation was used to calculate the acoustic far field.Oberai et al.[8]simulated the incompressible flow around an Eppler 387 airfoil and used the results as an input to a variational form of the Lighthill' s equation for the computation of the acoustic far field.Marsden[9]computed the flow around a NACA 0012 airfoil at zero incidence.Results obtained in the large eddy simulation indicate a well-placed transition zone and the turbulence level in the boundary layer,as in agreement with experimental data.Furthermore,the radiated acoustic field was determined directly by the large eddy simulation,without the use of an acoustic analogy.The third-octave acoustic spectra were compared favorably with the experimental data.It is shown that high-order numerical schemes can successfully be used to perform direct acoustic computations of the compressible transitional flow on curvilinear grids.Winkler[10]studied flows over a low-speed highly cambered airfoil at a small negative incidence by the LES.The LES and RANS(SST k-ω) simulations were also compared with detailed velocity measurements made by a 3-D hotwire in the wake.The wake thickness and the deficit predicted by the LES were much better than those obtained by the RANS and the flow separation was achieved at the trailing edge.The acoustic predictions from two formulations of the Lighthill's acoustic analogy compared favorably with the anechoic wind tunnel measurements at low and mid-frequencies.
The rod-airfoil experiment at a low Mach number is shown to be a good benchmark test for the numerical and theoretical broadband noise modeling.Jacob et al.[11]measured the flow field and the noise for a rod-airfoil.They used the CFD code Proust with the noise code Advantia to make the prediction of the flow induced noise for the rod-airfoil.The LES was used with an advanced-time FW-H acoustic analogy.In the case of the far field sound spectrum computed from the LES data,the shedding frequency was well predicted.The broadband spectrum was fairly accurate around the shedding frequency.However,the sound pressure level of the harmonic peak was underestimated by about 7dB,and a hump of the broadband spectrum occurred in the high frequency range.Greschner et al.[12]studied the sound generated by a rod-airfoil using the detached eddy simulation (DES)and the generalized Lighthill/FW-H analogy.The unsteady aerodynamic field was computed by using a flow solver ELAN and the aeroacoustic computations were carried out by using the rotor-noise code FoxHawk.It is indicated that only two types of candidates are suitable for an accurate sound prediction using the FW-H analogy by avoiding the expensive volume source calculation-the solid surfaces or a permeable surface that surrounds all the major perturbed flow regions.A further interesting result was that the integrations upon permeable surfaces yield unphysical results for the surfaces crossing strongly perturbedflow regions.Their effect could not be compensated by including the volume terms external to the permeable surface.Thus the application of the permeable surface approach for the FW-H sound prediction appears to be quite difficult in highly turbulent flow regions.Berland et al.[13]computed the sound induced by a rod-airfoil using the direct noise calculation based on the compressible LES with a set of overlapping structured curvilinear grids.The three-dimensional unsteady compressible filtered Navier-Stokes equations were solved with the software code_Safari on the composite grid provided by the library code Overture.The sound pressure level radiated by the harmonic peak was well reproduced.The gap between the simulation and the experiments remains and is about 4 dB.Maybe the overlapping grid is not suitable for the calculation of the broadband noise,the magnitude of the sound spectrum was overestimated,and the relative error between the computed results and the measurements is about 20 dB in the low frequency range and 10 dB in the high frequency range.
Zhang et al.[14]computed the flow induced noise for a cavity by the LES and the FW-H acoustic analogy,with valuable results.In this paper,the hybrid CFD/acoustic methods are adopted for the acoustic field prediction.The flow field is numerically simulated by the LES,and the sound sources which are on the right-hand side of the acoustic equations are extracted from the computed flow field.The far field noise is obtained by solving the FW-H acoustic analogy equation and the Powell vortex sound equation.The sound generated by a NACA0012 airfoil in the wake of a rod is numerically simulated by two approaches,one is the LES with the FW-H acoustic analogy and the other is the LES with the Powell vortex sound theory,in order to compare their prediction accuracies.Subsequently,a numerical simulation of the wall pressure fluctuations and the flow-induced noise for a NACA0015 airfoil is carried out by the two hybrid approaches.It is shown that both numerical approaches are credible,and the numerical simulations reach a reasonable accuracy for engineering purposes.
1.Computational methods
1.1 Large eddy simulation (LES)
The LES is adopted in the prediction of the unsteady flow.The basic assumptions of the LES are:(1)the transport process is largely governed by the largescale unsteady flow and these structures can be computationally resolved,(2) the small-scale flow features can be captured by using appropriate subgrid scale turbulence models.In the LES,the flow is separated into small and large eddies,achieved by means of a grid volume filter.The filter function,G( x,x′),is defined as:

Filtering the incompressible Navier-Stokes equations,one obtains

where the filtered quantities are denoted by adding an overbar,σijis the stress tensor due to the molecular viscosity andτijis the subgrid scale stress.In this paper,the dynamic Smagorinsky model is used to simulate the subgrid scale stress.The detailed descriptions of the dynamic Smagorinsky model could be found in Refs.[15,16].
1.2 FW-H acoustic analogy
Ffowcs Williams and Hawkings utilized the generalized function theory to obtain the classic equation associated with their names.The FW-H equation can be written as the following inhomogeneous wave equation
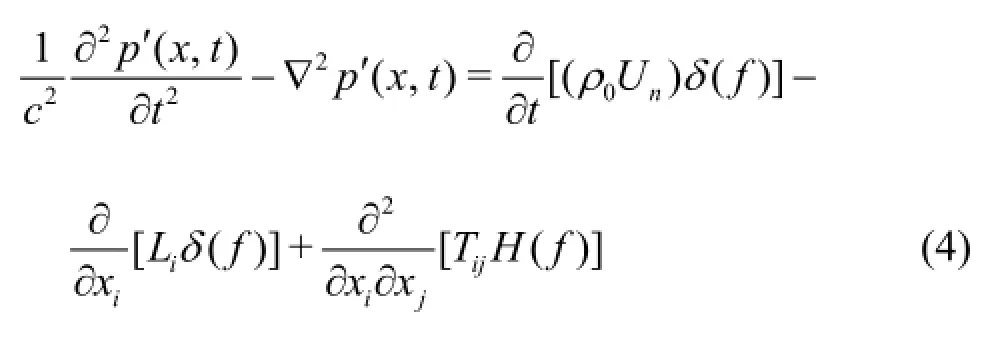
where the three terms on the right-hand side are monopole,dipole and quadrupole sources,respectively (from left to right).
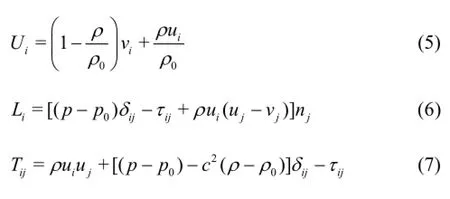
wherep′is the far field pressure fluctuations,Tijis the Lighthill stress tensor,δ(f)is the Dirac delta function,ρ0is the ambient density,p0is the ambient pressure,H is the Heaviside function,u is the fluidvelocity,v is the body surface velocity,cis the velocity of sound,nis a normal vector that points into the fluid.
The far field solution of the FW-H equation can be written as follows
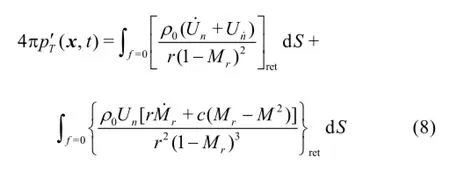
whereM is the Mach number vector at a source point on the integration surface,dots on quantities denote time derivative with respect to the source time τ,and the remaining terms are defined as
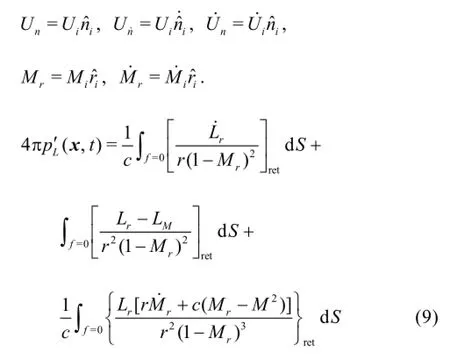
where
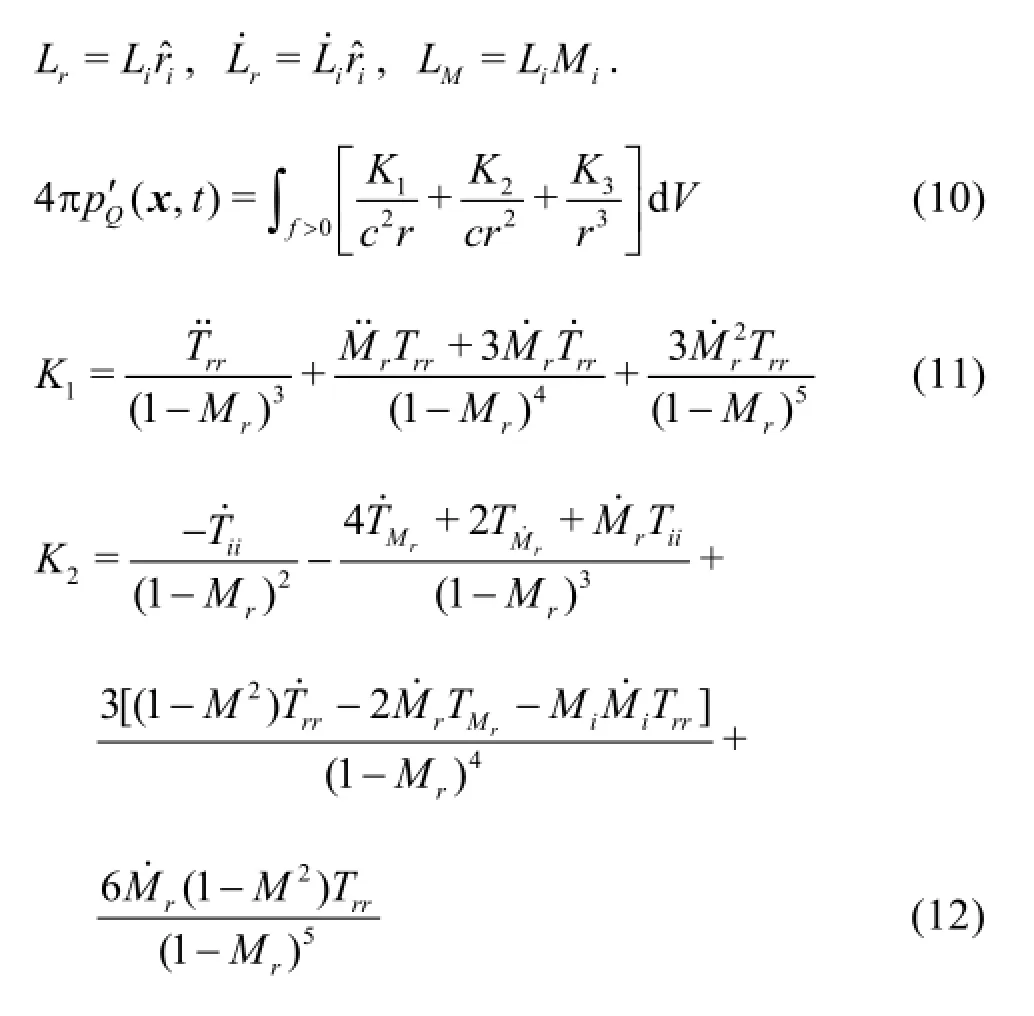


M is the Mach number vector of a volume source fixed in the body reference frame.Some detailed descriptions could be found in Refs.[17-19].
1.3 Powell vortex sound theory
According to the theory of Powell,the sound sources are related to the vortex motions under the low Mach number condition.The far field pressure fluctuations,p′,generated by the unsteady motions of vorticity can be obtained by solving the following inhomogeneous equation
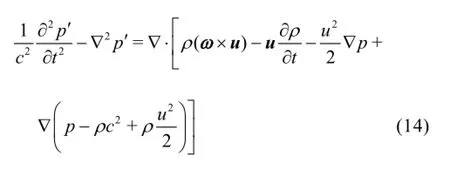
The curl of the velocity,∇×u,is the vorticity vector,ω.
For the incompressible and homoentropic flow under the low Mach number condition,the abovementioned equation can be reduced as

The three-dimensional Green function for the free space is
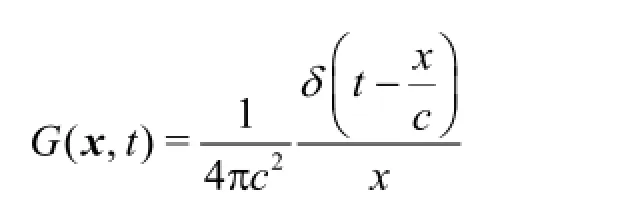
which has the following relation,
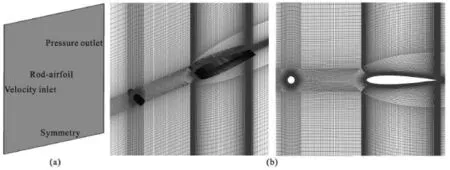
Fig.1 Computational domain,boundary conditions and meshes

where x is the observer position,yis the source position and

The density perturbation in the far field for the Powell vortex equation can be deduced as follows:

Equation (16) is adopted,so Eq.(18) can be rewritten as

1.4 Numerical scheme
The differential equations are discretized by the finite volume method.The bounded central difference scheme is applied.The velocity-pressure coupling is based on the PISO algorithm and the algebraic multigrid method is employed to accelerate the solution convergence.The time step is equal to 10-5s.On the wall surface y+≈1.The FFT and the Hanning window function are used to obtain the frequency spectrum.The flow computations are carried out by using the commercial software Fluent,and the two codes for solving the FW-H equation and the Powell equation are developed by the authors for the research purposes.All numerical simulations are carried out by the parallel processing in Wuxi supercomputing center in China with 32 nodes (256 processors).The iterative errors are 10-8-10-7.The time needed to finish a simulation with 1.158×10⁷cells is about 6 d.
2.Results and discussions
2.1 Rod-airfoil (NACA0012)
The extensions of unsteady CFD techniques for the prediction of the noise generated by high Reynolds number flows around complex geometries have to be validated in relevant test cases.The experiment described in the reference[11]is designed for this purpose.The configuration is that of an airfoil embedded in the wake of a circular rod.A symmetric NACA0012 airfoil (with chord c =0.1m) and a circular rod (with d/ c =0.1,wheredis the diameter of the rod) are placed in the potential core of a jet.The airfoil is located one chord-length downstream the rod.Both bodies are extended30d in the spanwise direction and are supported by rigid smooth plates.The incoming velocity is 72 m/s.The corresponding rod diameter based Reynolds number is about 4.8×10⁴,that of the chord length is 4.8×10⁵and the Mach numberMa is approximately 0.2.The rod sheds the well-known Karman vortex street as an oncoming disturbance onto the airfoil.The flow contains both periodic and broadband vortical fluctuations.The soundspectrum includes two components,one is the Strouhal peak tone (harmonic peak tone),and the other is a broadband noise.Acoustic measurements are conducted in the far field at a distance R=1.85 m(185d)from the airfoil center (a half chord downstream the leading edge),in the mid-span plane.

Fig.2 Computed vortical structures around rod-airfoil model
The computational domain,the boundary conditions and the meshes are displayed in Fig.1.The computational domain extends28c in the streamwise direction,24c in the cross-stream direction and 3cin the spanwise direction.The boundary conditions are as follows:on the inlet boundary,the air velocity is prescribed,on the outlet boundary,the aerostatic pressure is set,on the wall boundary,which is the surface of the rod-airfoil,the no-slip condition is set,on the slip wall boundary,which are the two lateral planes of the computational domain,the zero shear stress is prescribed.The computational domain is discretized by two meshes which contain 5.79×10⁶and 1.158×10⁷structured cells.The vortical structures around the rod-airfoil are captured by the vortex identification (Q)which is defined by Eq.(20),Ωis the rotation tensor (an antisymmetric tensor) and S is the strain rate tensor (a symmetric tensor).Q= 2 000 in this paper.The different values ofQ do not change the qualitative feature of the vortical structures identified by them.All vortical structures which are identified by variousQ values have the important feature of self-similarity.


Fig.3 Comparison between computed and measured mean velocities
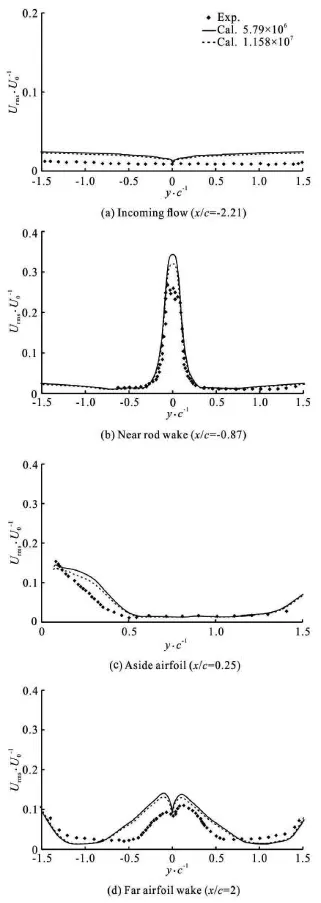
Fig.4 Comparison between computed and measured rms values of velocity fluctuations
The computed vortical structures around the rodairfoil model,which are colored according to the magnitude of vorticity,are shown in Fig.2.The flow pattern around the rod-airfoil is very complex,but a clear physical mechanism in the flow can be observed in Fig.2.There is a fully three dimensional turbulent flow around the rod-airfoil,including many complex multi-scale vortices of different shapes.The large scale vortex shedding pattern can be observed.Behind the rod,an obvious Karman vortex flow is formed.A great number of vortices are shed downstream the rod.When the vortices impinge on the airfoil,many strong interactions induce more complex vortical structures.Because the vortex essentially is a coherent structure,and the Karman vortex is shed at a natural frequency,so the frequency of the vortices impinging the airfoil is kept constant,which is the frequency of the tone corresponding to the main Strouhal peak.After the impingement,various vortices are reformed with various modes such as splitting,dissipation,mergence and perturbation.
Figure 3 and Fig.4 show the mean and root mean-square (rms) velocity profiles in the mid-span plane on the four cross-sections.The origin of the coordinates is at the leading edge of the airfoil.The abscissa is in the streamwise direction and y is in the lateral direction,perpendicular to the leading edge of the airfoil.The velocities are made non-dimensional by the scale of U0,and the coordinates are scaled against the airfoil chord.The acquired data are based on approximately 200 shedding cycles.The data of the velocity and the fluctuations show that both simulations capture the main physical features of the flow.The computed mean and fluctuating velocities are very close to the Hot Wire measurements.The near wake velocity deficit and the increase in the velocity fluctuations in places downstream the rod are shown in Fig.3(b) and Fig.4(b).The two initial rod shear layers (each containing vortices shed at one side) can still be visualized from this plot.Further downstream,the shear layers merge and the wake spreads as it approaches the airfoil.Along the airfoil,the mean flow is still strongly influenced by the rod wake,with the effect of the airfoil resulting in an acceleration which partly compensates the deficit due to the rod wake (Fig.3(c) and Fig.4(c)).Jacob et al.pointed out that during their experiments the rod and the airfoil were not perfectly aligned.Figure 3(d) and Fig.4(d)show that the wake is slightly asymmetric in the test.This is due to the fact that rod is not perfectly centered on the longitudinal axis and a lateral shift (-0.002 m)is detected.It is a setup problem in the experiment.This shift can also be inferred from the rod wake fluctuations (Fig.4(b)).The difference between the computed results by two meshes can be ignored,and the mesh of 5.79×10⁶cells is good enough for the numerical simulation of the flow field.
The validations of the computed magnitude and frequency of the Strouhal peak tone by two approaches with two meshes are listed in Table 1 and Table 2.The comparisons between the computed flow induced noises obtained by two hybrid approaches with two meshes and the measurements for the rod-airfoil are presented in Fig.5 and Fig.6.The observers are located 185d from the airfoil midpoint,with respect to the airfoil chord in the midspan plane.Table 1 shows that the relative errors of the predicted magnitude,frequency and St of the Strouhal peak tone with 5.79×10⁶cells are -2.8 dB,6.7%,6.8%,respectively,by the LES with the FW-H acoustic analogy equation(LES and FW-H),-4.2 dB,5.3%,5.2%,respectively,by the LES with the Powell vortex sound equation(LES and Powell).Table 2 shows that the relative errors of the predicted magnitude,frequency and St of the Strouhal peak tone with 1.158×10⁷cells are -2.5 dB,6.4%,6.3%,respectively,by the LES with the FW-H acoustic analogy equation (LES and FW-H),-3.8dB,5.1%,5.2%,respectively,by the LES with the Powell vortex sound equation (LES and Powell).The difference between the computed results obtained by two meshes is not significant,and the mesh of 5.79× 10⁶cells is good enough for the numerical simulation of the harmonic peak tone.The computational accuracies of the two hybrid approaches are similar.Both of them are credible and satisfactory in the computation of the Strouhal peak tone.

Table 1 Validations of the computed magnitude and frequency of the harmonic peak tone by two approaches with 5.79×10⁶cells

Table 2 Validations of the computed magnitude and frequency of the harmonic peak tone by two approaches with 1.158×10⁷cells

Fig.5 Comparisons between computed and measured flow induced noises for rod-airfoil by two hybrid approaches with 5.79×10⁶cells
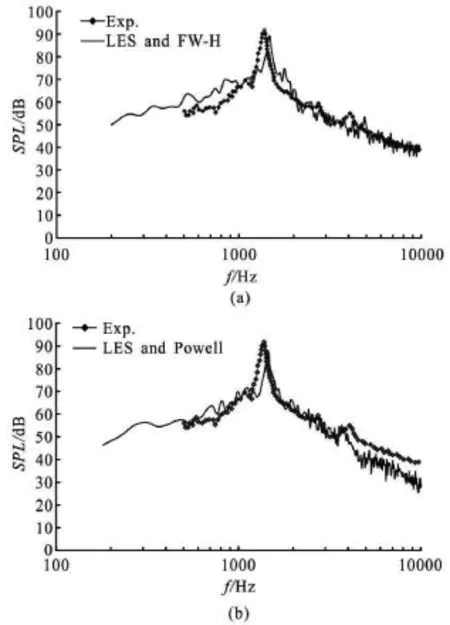
Fig.6 Comparisons between computed and measured flow induced noises for rod-airfoil by two hybrid approaches with 1.158×10⁷cells

Fig.7 Computational domain,meshes and computed flow field of airfoil model
Figure 5 and Fig.6 indicate that the computed broadband noise spectra obtained by LES and FW-H and LES and Powell agree well with the experimental results,the shape and the magnitude are reasonable,and the prediction error is within 1 dB-7 dB.In the frequency range 800 Hz-1 180 Hz and 1 700 Hz-3 400 Hz,the LES and Powell approach gives a better prediction.In the high frequency range (>4 000 Hz),the computed results by LES and Powell are not as good as those by LES and FW-H.The computational accuracies of the two hybrid approaches are similar.Both of them are credible and satisfactory in the computation of the broadband noise.The difference between the computed results by two meshes is less than 2 dB and can be neglected,and the mesh of 5.79×10⁶cells is good enough for the numerical simulation of the broadband noise.
2.2 NACA0015 airfoil
The three-dimensional NACA0015 airfoil has a chord of 0.61 m (C)and a span of 1.8 m (L).All computations presented in this paper are made for a free-stream velocity of 30 m/s,corresponding to a chord-based Reynolds number of 1.3×10⁶.The boundary conditions are as follows:on the inlet boundary,the air velocity is prescribed,on the outlet boundary,the aerostatic pressure is set,on the wall boundary,which is the surface of the airfoil,the no-slip condition is set,on the slip wall boundary,which are the two lateral planes of the computational domain,the zero shear stress is prescribed.The computational domain and the mesh are shown in Fig.7.The computational domain is discretized by 6.75×10⁶structured cells.Experiments are carried out in a wind tunnel with an anechoic system.A detailed description of the sound measurement can be found in Ref.[20].The microphone is mounted in the place 1.8 m from the airfoil leading edge at the mid-span in the direction of the positive mean lift.

Fig.8 Computed vortical structures around airfoil model
The vortical flow and wall pressure fluctuations around the airfoil are two important parameters,both of them influence the aerodynamic characteristics,as well as the acoustic behavior.So the flow patterns for the airfoil in two angles of attack are numerically simulated and the results on the mid-span plane are presented in Fig.7.It is shown that there is a weak flow separation in the case of the angle of attack of 8o,followed by the vortical flow.The vortex identification(Q)is adopted to analyze the flow structure.Figure 8 shows the computed isosurfaces ofQ with contour lines of the rms of the pressure fluctuations.At the angle of attack of 8o,the vortex and the rms pressure fluctuations are stronger and more complex than those at the angle of attack of0o.The comparisons between the computed pressure coefficients and the measurements at two angles of attack are displayed in Fig.9.It is shown that the computed pressure coefficients agree well with the test data obtained in the wind tunnel.
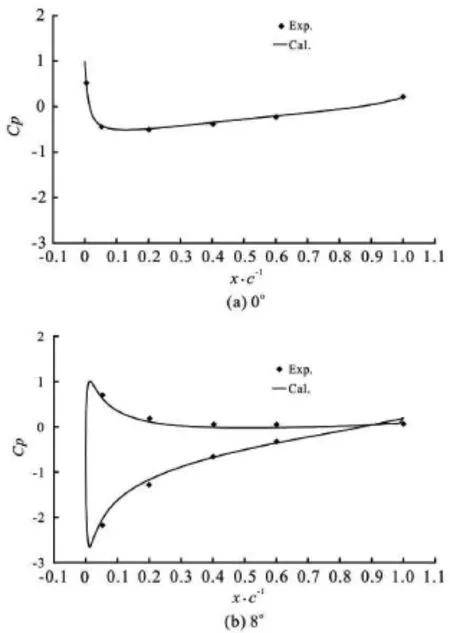
Fig.9 Comparison between the computed and measured pressure coefficients
In order to demonstrate the capability of the LES in predicting the unsteady flow characteristics of the airfoil,the power spectra of the wall pressure fluctuations on the airfoil surface at two angles of attack are simulated and compared with the measured data.The wall pressure fluctuations spectra on the airfoil of the same geometry are measured in the wind tunnel in the CSSRC at the same velocity.Figure 10 shows the comparison.The sensor is placed at the position of X/ C=0.9on the midline of the airfoil suction-side surface,Xis the distance from the leading edge.The predicted overall shape and the magnitude of the wall pressure fluctuation spectra are fairly well compared with the experiment data.In the frequency range of 100 Hz-10 000 Hz,the predicted accuracy is 2 dB-8 dB.It is shown that the computed results agree better with the measured data in the low frequency region than in the high frequency region.Compared with those obtained for the case of the angle of attack of 0o,the wall pressure fluctuations are increased by about 2 dB-7 dB for the case of the angle of attack of 8o.The characteristics of the unsteady flow around the airfoil are better captured by the LES.
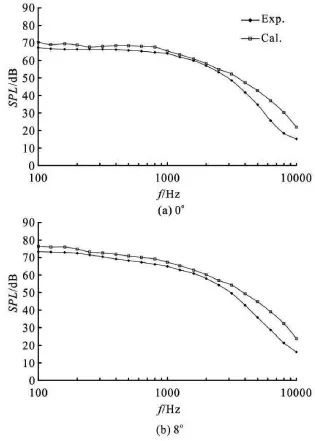
Fig.10 Comparison between the computed and measured wall pressure fluctuation spectra of NACA0015 airfoil
The unsteady flow past an airfoil may create a broadband noise.The formation and the behavior of a shear layer and its subsequent interaction with the airfoil surface lead to the noise production.The noise generated at the trailing edge of an airfoil in a flow may be regarded as separated from the leading edge noise according to Blake (1986) if f>c/ cl,where c is the sound velocity,clis the chord of the airfoil.In the test,c/ clis equal to about 560 Hz.The full flow induced noise is computed,including the leading and trailing edge noises,and the frequency scope is20 Hz-10 000 Hz,but the measurement is only made for the leading edge noise (<630 Hz),so the comparison is made in the low frequency scope.The comparison between the sound measurement and the calculation is presented in Fig.11.The trend of the computed results is consistent with that of the measurement.For the sound pressure magnitude,the difference between the computed results and the experimental data is 2 dB-4 dB (100 Hz-630 Hz).In the numerical simulation,the spectrum height is decreased rapidly as the frequency increases.The comparison between the prediction and the model measurement sees a fairly good agreement,which indicates that the unsteady flow field and the flow induced noise can be well simulated.The two hybrid approaches for the flow induced noise are thus established.The computational accuracies of the two hybrid approaches are similar.Both of them are credible and satisfactory in the numerical prediction of the flow induced noise.

Fig.11 Comparison between the computed and measured sound spectra of NACA0015 airfoil
3.Conclusion
The prediction of the flow-induced noise is an important and complex issue in the fluid-dynamic acoustics field.The hybrid CFD/acoustic methods or the CAA methods are developed for the acoustic field prediction.The sound generated by an NACA0012 airfoil in the wake of a rod is numerically simulated by two approaches,one is the LES with the FW-H acoustic analogy and the other is the LES with the Powell vortex sound theory,in order to compare the prediction accuracy of them.It is shown that the both numerical methods are credible.And the overall performances of the two hybrid methods are shown to be satisfactory in the prediction of the Strouhal peak noise and the broadband noise.Subsequently,a numerical simulation of the wall pressure fluctuations and the flow-induced noise of a NACA0015 airfoil is carried out by the two hybrid approaches.It is shown that the two numerical simulations enjoy a reasonable accuracy for engineering purposes.Both of them are credible and satisfactory in the numerical prediction of the flow induced noise.It is obvious that more work is needed in this area.The flow induced noise prediction algorithms must well resolve the shear layer behavior.As expected,the prediction of the flow induced sound might become feasible with the continued advance in computational capabilities.The development of computational models also requires excellent experimental data.The detailed experimental flow and sound researches should be dominated by the studies of the nearfield flow oscillation and the far-field sound.In the future,it is necessary to carry out the study of more models for the CFD verification and validation.Further work is also required to clarify the requirements for the grid resolution and the numerical stability for more complex subgrid models.
[1]FFOWCS WILLIAMS J.E.,HAWKINGS D.L.Sound generation by turbulence and surfaces in arbitrary motion[J].Proceedings of Royal Society A,1969,264(1):321-342.
[2]WANG M.,FREUND J.B.and LELE S.K.Computational prediction of flow-generated sound[J].Annual Review of Fluid Mechanics,2006,38(1):483-512.
[3]POWELL A.Theory of vortex sound[J].Journal of the Acoustical Society of America,1964,36(1):177-195.
[4]MÖHRING W.On vortex sound at low Mach number[J].Journal of Fluid Mechanics,1978,85:685-691.
[5]SCHRAM C.,HIRSCHBERG A.Application of vortex sound theory to vortex-pairing noise:Sensitivity to errors in flow data[J].Journal of Sound and Vibration,2003,266(5):1079-1098.
[6]WANG M.,MOIN P.Computation of trailing-edge flow and noise using large-eddy simulation[J].AIAA Journal,2000,38(12):2201-2209.
[7]MANOHA E.,HERRERO C.and SAGAUT P.et al.Numerical prediction of airfoil aerodynamic noise[R].AIAA Paper 2002-2573,2002.
[8]OBERAI A.,ROKNALDIN F.and HUGHES Th.Computation of trailing-edge noise due to turbulent flow over an airfoil[J].AIAA Journal,2002,40(11):2206-2216.
[9]MARSDEN O.,BAILLY C.and BOGEY C.Direct noise computation of the turbulent flow around a zero-incidence airfoil[J].AIAA Journal,2008,46(4):874-882.
[10]WINKLER J.,MOREAU S.LES of the trailing-edge flow and noise of a NACA6512-63 airfoil at zero angle ofattack[C].Proceedings of the Summer Program in Center for Turbulence Research.Palo Alto,USA,2008,331-342.
[11]JACOB M.C.,BOUDET J.and CASALINO D.et al.A rod-airfoil experiment as benchmark for broadband noise modeling[J].Theoretical and Computational Fluid Dynamics,2005,19(3):171-196.
[12]GRESCHNER B.,THIELE F.and JACOB M.C.et al.Prediction of sound generated by a rod-airfoil configuretion using EASM DES and the generalised Lighthill/FWH analogy[J].Computers and Fluids,2008,37(4):402-413.
[13]BERLAND J.,LAFON P.and CROUZET F.et al.Numerical insight into sound sources of a rod-airfoil flow configuration using direct noise calculation[R].AIAA Paper 2010-3705,2010,1-9.
[14]ZHANG Nan,SHEN Hong-cui and YAO Hui-zhi.Numerical simulation of cavity flow induced noise by LES and FW-H acoustic analogy[J].Journal of Hydrodynamics,2010,22(5Suppl.):242-247.
[15]GERMANO M.,PIOMELLI U.and MOIN P.et al.A dynamic subgrid-scale eddy viscosity model[J].Physics of Fluids A,1991,3(7):1760-1765.
[16]LILLY D.K.A proposed modification of the germano subgrid-scale closure method[J].Physics of Fluids A,1992,4(3):633-635.
[17]DI FRANCESCANTONIO P.A new boundary integral formulation for the prediction of sound radiation[J].Journal of Sound and Vibration,1997,202(4):491-509.
[18]CASALINO D.An advanced time approach for acoustic analogy predictions[J].Journal of Sound and Vibration,2003,261(4):583-612.
[19]ZHANG Nan Research on mechanism and hybrid computation approach for cavity flow and flow induced noise[D].Doctoral Thesis,Wuxi,China:China Ship Scientific Research Center,2010.
[20]DEVENPORT W.J.,STAUBS J.K.and GLEGG S.Sound radiation from real airfoils in turbulence[J].Journal of Sound and Vibration,2010,329(17):3470-3483.
10.1016/S1001-6058(16)60627-3
(Received February 15,2015,Revised June 15,2015)
* Biography:Nan ZHANG (1977-),Male,Ph.D.,Professor
2016,28(2):255-266
猜你喜欢
杂志排行
水动力学研究与进展 B辑的其它文章
- Manoeuvring prediction based on CFD generated derivatives*
- Effects of water flow on the uptake of phosphorus by sediments:An experimental investigation*
- Improved formulas for thermal behavior of oscillating nanobubbles*
- Lattice Boltzmann method for Casimir invariant of two-dimensional turbulence*
- The experiment and analysis of transitional flow in pipe*
- Numerical simulation of 3-D free surface flows by overlapping MPS*
