Study of bedload transport in backwater flow*
2016-09-29ZhongwuJIN金中武JinyouLU卢金友HualiWU吴华莉
Zhong-wu JIN (金中武), Jin-you LU (卢金友), Hua-li WU (吴华莉)
Study of bedload transport in backwater flow*
Zhong-wu JIN (金中武)1,2, Jin-you LU (卢金友)1, Hua-li WU (吴华莉)1
1. Changjiang River Scientific Research Institute, Wuhan 430010, China 2. Collaborative Innovation Center for Geo-Hazards and Eco-Environment in Three Gorges Area, Yichang 443002, China, E-mail: zhongwujin@163.com(Received September 1, 2014, Revised March 10, 2015)
This paper studies the flow structure and the bedload transport regime in backwater flows, to provide a theoretical support for solving the sediment transport and bed scour problems in rivers or reservoirs with backwater. The bedload transport rates under different conditions are analyzed first on the basis of theoretical analysis, measurement comparison and flume experiment, and it is pointed out that the existing formulas for the bedload transport rate are not applicable for the bedload transport rate in backwater flows. Next, the flow structure in a non-uniform flow is observed by flume experiments, and by introducing the backwater degree index, the quantitative relation between the relative bed shear stress and the backwater degree is obtained. Finally, the formula for the bedload transport rate applicable for the reservoir channel segment with backwater flows is obtained through measurements and flume experiments.
backwater flow, bedload transport, flume experiment, formula for bedload transport rate
Introduction
A number of studies were conducted in the past few years concerning the bedload transport rate, gene- rally based on flume experiments under steady flow conditions or observations of natural rivers close to a uniform flow. In natural streams, backwater flows are frequently observed, which are not fully understood because of their complicated nature. The backwater flows are a crucial issue in the studies of the bedload transport. The flow structure and the sediment tran- sport in backwater flows (also known as decelerating flows) are different from those in uniform flows. This is typically the case for channel reservoirs where, under the same flow condition, the water depth gra- dually increases from the reservoir tail to the dam, lea- ding to non-uniformity.
The backwater flow is a kind of non-uniform flows. Several studies examined the turbulence chara- cteristics of non-uniform flows. Afzalimehr and Anctil[1]studied the behavior of the bed shear stress in the presence of a decelerating flow. Their study revea- led that the velocity distribution can be described by a parabolic law in the outer region and by a logarithmic law in the inner region of the boundary layer. Song and Chiew[2]obtained the velocity profiles, the turbu- lence intensities and the Reynolds stress distribution for both decelerating and accelerating flows and found that the maximum velocity occurs at the water surface for decelerating flows and the Reynolds stress and the turbulence intensity distributions for decelerating flows are convex. Balachandar et al.[3]studied the ve- locity distributions in a decelerating open channel flow over rough and smooth surfaces. The study shows that for the boundary layer generated in a dece- lerating open channel flow, the power laws can ade- quately describe the mean velocity profile. Dey and Lambert[4]and Yang et al.[5]studied the Reynolds st- ress and velocity distributions in non-uniform flows analytically. The analytical results of Yang et al. show that the non-zero vertical velocity in non-uniform flows introduces an additional momentum to the flow that causes the Reynolds stress distribution to have a convex form in decelerating flows and a concave form in accelerating flows. Based on the above observatio- ns, Yang[6]made preliminary studies about the veloci- ty distribution of gradually decelerating flows, but the pictures of variations of the velocity and the sediment transport under the backwater condition are not clear. Zhang et al.[7]used a mathematical model to investiga- te the shear velocity under decelerating non-uniform flow conditions. It is shown that under a backwater condition, the friction velocity decreases with the in- crease of the water depth when the flow rate and the bottom slope are fixed and they proposed a convenient calculation formula for the friction velocity, based on the numerical results.
In recent years, many researchers investigated the influence of the flow non-uniformity on the initiation of the sediment motion. Afzalimhr et al.[8]studied the incipient motion of gravel bed steams in steady-dece- lerating flows. Their results show that the Reynolds stress distribution over fixed and mobile beds has a convex form. Moreover, the critical Shields parameter value for their decelerating flow expeiments is less than the published results obtained in uniform flow experiments. Emadzadeh et al.[9]studied the effect of the flow acceleration and deceleration on the velocity, the Von Karman constant, the Reynolds and normal stress distributions under the incipient motion using eight positive and negative bed slopes. It is shown that the shear and normal Reynolds stresses in the decele- rating flow are greater than those in the accelerating flow, and the acceleration and the deceleration along with the slope variation are the key factors governing the incipient motion in non-uniform flows. Hoan[10]experimentally studied the relation between the flow intensity and the gravel transport intensity parameters by increasing the flume width along the way and pro- ducing a retarded flow, and it is discovered that the correlation between the Shields flow intensity parame- terand the transport intensity parameteris me- rely 0.18, while that between the turbulence intensity flow parameters,and the transport intensity parameter is at least 0.77. He suggested that the near bed turbulence intensity should be included in the cal- culation under the gravel starting conditions in non- uniform flows. Khorram and Ergil[11]selected some key parameters associated with the reservoir bedload movement for a sensitivity analysis, and obtained a se- diment transport relation for the sand, the gravel and the mixed sand by the artificial neural network (ANN) method. Afzalimhr et al.[12]studied the effects of acce- lerating and decelerating flows on the flow structure in an flume with vegetated banks and gravel beds. It is shown that a significant dip phenomenon can be obse- rved in the velocity profiles in the decelerating flow and the velocity defect law is not suitable due to the effect of vegetated banks.
In spite of the importance of the flow structure and the sediment transport under backwater flows, no systematical study has been reported to describe the effect of the backwater on the bedload transport regi- me. The studies of the bedload discharge under back- water flow conditions will enable hydraulic engineers to better understand the sediment transport in rivers or reservoirs with backwater flows. The paper is to study the motion of the bedload transport under backwater flow conditions, by means of flume experiments.
1. Examination of existing formulas for bedload transport rate in backwater flow
The bedload transport rate variations in a back- water flow and the results obtained by the existing for- mulas will be discussed with the case of the Wanxian Station as an example.
The Wanxian Station is located in the Three Gorges Reservoir permanent backwater area and is about 300 km away from the dam. Under the natural condition, the depth of the river is 12 m-30 m, its width is 400 m-600 m, and the water surface slope is about 0.09%. When the level in front of the dam is 135 m, under the same discharge, the water depth would rise about 15 m-25 m during the flood season,the river width would be 685 m-715 m, the water sur- face width would be around 100 m higher than that under the natural conditions, the water surface slope would be 0.01%-0.02%, and the velocity would be re- duced by about 1 m/s, when the level in front of the dam is 145 m, and under the same discharge, the water depth would rise about 25 m-35 m during the flood season, the river width would be 705 m-785 m, the water surface width would be around 100 m- 185 m higher than that under the natural conditions, the water surface slope would be 0.007%-0.009%, and the velocity would be reduced by about 1.5 m/s. Figure 1 shows the relationship between the water level and the discharge of the Wanxian Station during different periods. Here,is water level andis discharge, the same below. Figure 2 shows the rela- tionship between the water surface slope and the dis- charge of the Wanxian Station during different periods. Here,is water surface gradient, the same below.
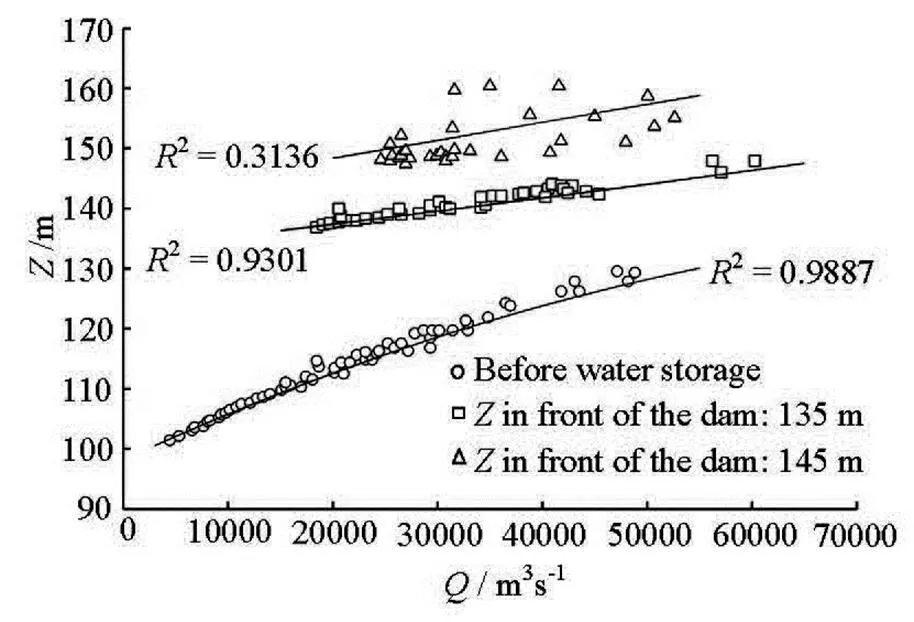
Fig.1 Water level-discharge relation during different periods at Wanxian Station
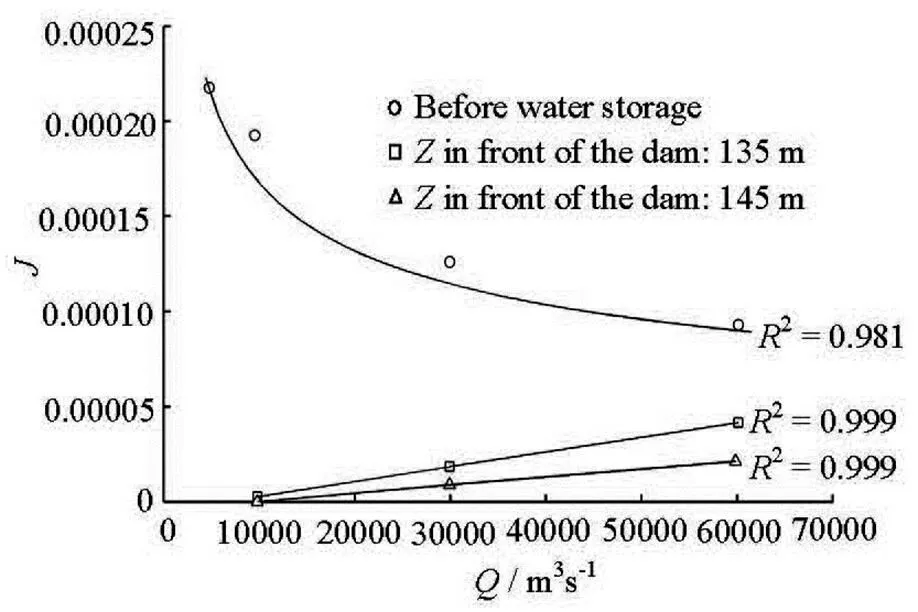
Fig.2 Water surface gradient-discharge relation during different periods at Wanxian Station
There are quite a few formulas for the bedload transport rate available, of which those of Meyer-Peter, Engelund, Bagnold, Einstein, Ackers-White and Yalin will be analyzed. To provide an identical criterion, all these formulas will have the Meyer-Peter parameter, and the river bed is assumed to be flat, in the Bagnold formulais 0.63,is 0.001 m, to describe the relation between the water flow parame- terand the transport intensity:
Figure 3 shows the relationship between the water flow parameterand the transport intensityat the Wanxian Station under the natural conditio- ns, at the levels of 135 m and 145 m in front of dam, and the curves obtained by the above six formulas are compared. From Fig.3, the sediment transport intensi- ty at the Wanxian Station is quite low on the whole, and the sediment transport intensity decreases with the increase of the backwater, and the sediment transport intensity under the backwater flow conditions is sma- ller than that under the natural conditions, and that at the level 145 m in front of dam is even smaller. As to the relation between the water flow parameterand the transport intensity, it can all be well described by the six formulas under the natural conditions, but deviations from this relation are seen at the levels 135 m and 145 m in front of dam. This deviations seem to exacerbate with the increase of the backwater. Statistics show that the same transport intensity of the bedload will not be transported at the dam-front level of 145 m unless the flow intensity is 5 times higher than that before the storage. In other words, as the ba- ckwater intensifies, so will be the deviation of the re- lation between the water flow parameterand the transport intensityfrom that predicted by these for- mulas.
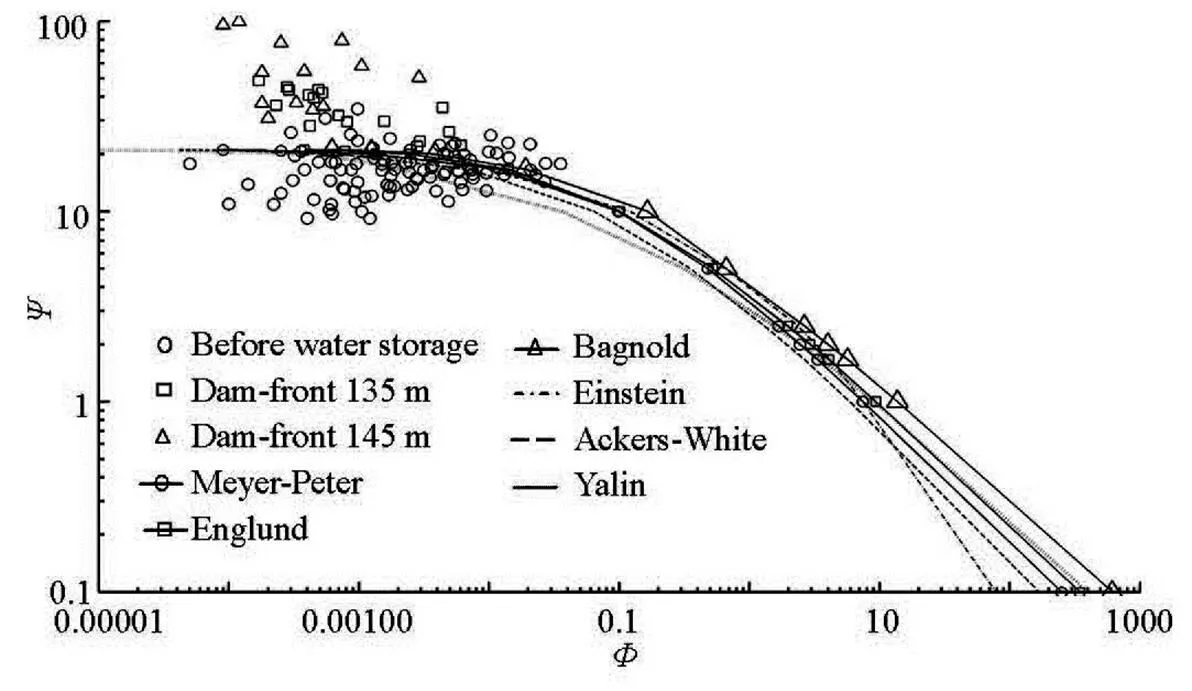
Fig.3 Measurements vs. predictions of the formulas at different water levels at Wanxian Station
It can be concluded that the above classical for- mulas are not suitable to calculate the bedload tran- sport rate in backwater flows and their accuracy dete- riorates as the backwater intensifies.
2. Flume experiment on flow structure in different backwater flows
To examine the bedload transport in backwater flows, the flow structure variation under different ba- ckwater flow conditions is considered first. By com- paring the flow structure in different backwater flows and in the uniform flow, the constraints on the bed- load transport rate in backwater flows are obtained and then used to correct the existing formulas for the bedload transport rate. While the differences between the flow structure in backwater flows, including the backwater height, and that in non-uniform flows were noticed in previous researches, few studies were made with respect to these differences. For this reason, in this paper, the water flume experiments under differe- nt backwater flow conditions are carried out to analy- ze the flow structure and the shear stress in different backwater flows.
2.1
Experiments are carried out in a re-circulating flume of 24 m long, 0.6 m wide, and 1 m deep, whose bottom is made of cement and the lateral surfaces are made of glass. The flume assembly consists of a water circulation system, a flow regulation system, a water depth control system and auxiliaries. The water circu- lation system is a closed self-circulation system com- posed of water pumps, a water supply pipeline, an ex- periment flume and a water reservoir. Water is pum- ped from the reservoir into the supply pipeline and in- jected into the gauging pond before it is driven throu- gh the gauging weir and then back into the reservoir through the experiment flume. Bars are fixed in the front of the flume to stabilize the water flow and a gate is installed at the tail to control the water depth. In this experimental study, the velocity is measured by the ADV.
The experiments are performed at two discharge rates. The flow velocity as well as the water surface slope at different control depths for each discharge rate are measured. The bottom slope of the flume is 0.15% and the water level is adjusted by the tail gate located at the end of the flume. To eliminate the effect of the flow fluctuation at the tail gate and the inlet, the measurement section is in the middle of the flume. Five vertical lines are placed across each section. Poi- nts on the lines are densified as required. To detect changes at the bottom, each vertical line is densified to approach an interval of 0.05 m near the bottom. The velocity at each point on the lines is measured for 4 min with an ADV.
In the experiment, there are 9 groups, including 5 groups of 40 l/s-discharge and 4 groups of 70 l/s-dis- charge. Each discharge group includes a uniform flow condition, while under other conditions the discharge is constant with a varying water level, to examine the differences of the flow structure between the back- water flow and the normal water depth. The water depth is adjusted through a fixed control section for each discharge rate. Table 1 shows the flume experi- ment parameters.
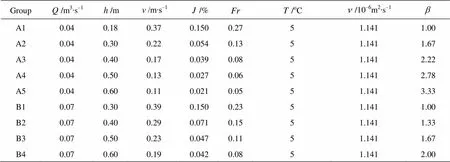
Table 1 Flume experiment parameters
The experiment is mainly used to study the effect of the backwater degrees on the flow structure. So,is used to describe the degree of the backwater, which is the ratio of the backwater depth to the normal depth.
2.2
(1) Vertical velocity distribution
The velocity distribution in a uniform flow was widely studied with abundant results and formulas, in- cluding logarithmic, exponential, parabolic, elliptic and inverse hyperbolic tangent types. The most widely used formulas among them are the logarithmic distri- bution formula and the exponential formula. Figure 4 and Fig.5 show the longitudinal velocity distribution along the vertical line at different water depths and two discharge rates, respectively. Here,is the lon- gitudinal velocity andis vertical line.
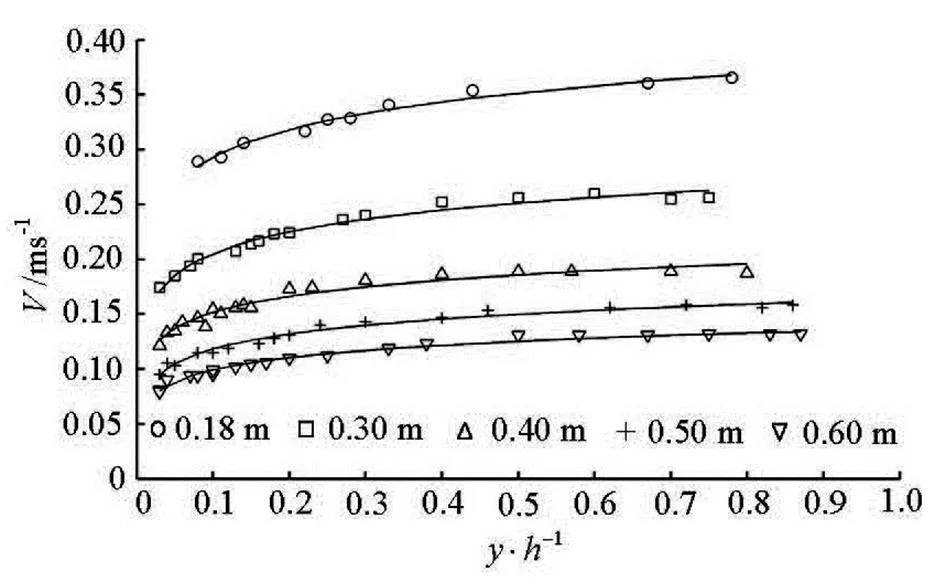
Fig.4 Longitudinal vertical velocity distribution of Group A
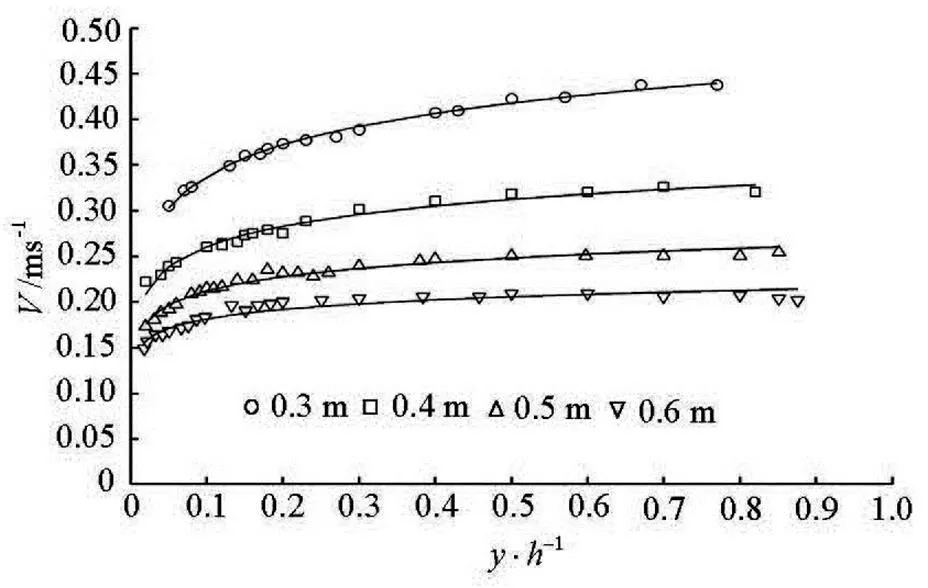
Fig.5 Longitudinal vertical velocity distribution of Group B
The above figures show that the velocity distribu- tion generally follows the logarithmic formula, with certain exceptions. The velocity does not seem to agree with the logarithmic formula above the depth 0.2 relative to the bottom, especially in the vicinity of the water surface. Recent findings have confirmed that the deviation of the velocity distribution from the lo- garithmic formula in the vicinity of the water surface is associated with the secondary currents. Yang et al.[5]noted that, as the vertical velocity is not zero, it will produce an additional momentum by shearing against the wall surface and thereby affect the longitudinal ve- locity distribution.
It is revealed that a partitioning structure exists in both the uniform and non-uniform flows in an open channel, including an internal and an external zone. In the internal zone, the logarithmic dis- tribution holds, while the time average velocity distri- bution in the external zoneis different. As no breakthrough is made with respect to the effect of the secondary currents on the velocity distribution, even the velocity distribution in the external zone of a uniform flow is in some controversy. However, this is not the concern in our experiment since we focus on the flow structure in areas closely associated with the bedload transport. The near-bottom velocity distribu- tion is obtained by fitting the measurements
This is quite close to the formulain the Ref.[13].
By analysis, the vertical distribution of the flow velocity in a backwater flow is more uniform than that in a uniform flow, the uniformity of the velocity dis- tribution increases with the increase of the degree of backwater.
(2) Variation of bed shear stress
Table 2 Variation of with

Table 2 Variation of with
40 l/s70 l/s 1.00, 1.67, 2.22, 2.78, 3.331.00, 1.33, 1.67, 2.00 1.00, 0.36, 0.26, 0.18, 0.141.00, 0.47, 0.31, 0.28
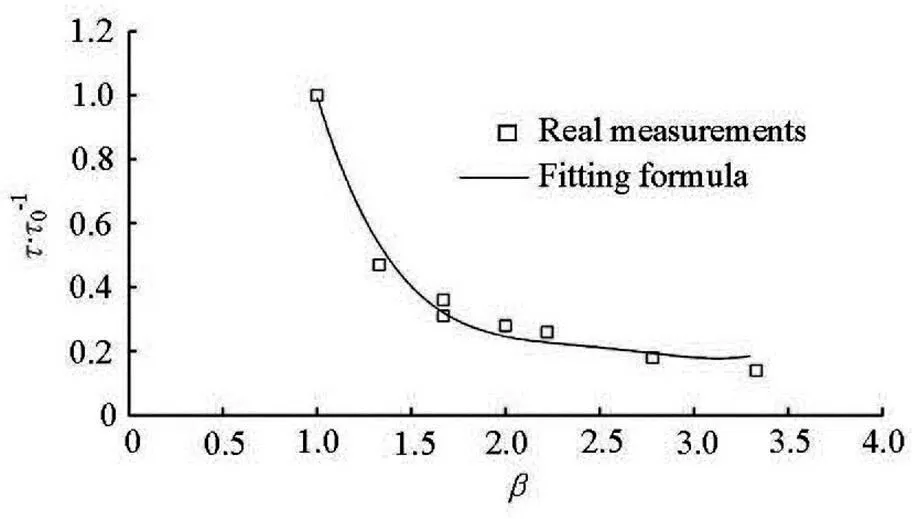
Fig.6 The fitting curve of to relation
The fitting formula is
Figure 6 shows that as the backwater height in- creases, the relative shear stressreduces. Whencomes to 1.5, in other words, the backwater height comes to 50% of the normal water depth, the bed shear stress will reduce to 40% of that in the uniform flow, and ifis within the range of 1-1.5, the bed shear stress will reduce from its highest rate, asin- creases. Whencomes to 2, the bed shear stress will be 25% of that in the uniform flow, and will stabilize thereafter.
3. Bedload transport regime in backwater flow
3.1
Experiments on bedload transport in backwater flows are carried out after the water experiment, for observing the variations of the water depth, the surfa- ce slope, the velocity distribution, the turbulence and the bedload transport rate. Experiments are performed on 7 groups under two discharge rates. For each dis- charge rate, a constant uniform sediment transport ex- periment is carried out first, that is the transport rate experiment at the normal water depth, followed by ri- sing the water level. In the experiments, the transport rate across the control section in different backwater flows is measured. To simplify the problem and find out the regime, the uniform sand is used. The grain size of the natural sands is 0.0004 m in the experiment. Table 3 shows the experiment conditions for various groups, whereis the friction velocity.

Table 3 Flume experiment conditions for bedload transport rate
杂志排行
水动力学研究与进展 B辑的其它文章
- Flow, thermal criticality and transition of a reactive third-grade fluid in a pipe with Reynoldsʼ model viscosity*
- Investigation of the effects of platform motion on the aerodynamics of a floating offshore wind turbine*
- Mixing of two different electrolyte solutions in electromagnetic rectangular mixers*
- A new biomimicry marine current turbine: Study of hydrodynamic performan- ce and wake using software OpenFOAM*
- Experimental study of water and dissolved pollutant runoffs on impervious surfaces*
- A numerical model for pipelaying on nonlinear soil stiffness seabed*