大气成分和大气化学研究进展
2016-07-31
大气成分与大气化学
大气成分和大气化学研究进展
1 大气成分及相关特性变化的观测研究
1.1 对气温在雾霾-人体健康效应中的再评估
探讨了雾霾-人体健康影响中的不同季节效应。首先,敏感人群健康风险随着雾霾级别的增加而增加;其次,不同的疾病风险,季节/气温对它们的修饰是不同的。春季,雾霾对呼吸道疾病人群的影响最大,而夏季和冬季,心血管疾病的人群受到的影响最大。此外,因为雾霾具有滞后效应和累积效应,所以在一个持续几天的雾霾事件中,人群的健康风险也有一定的累积。由于来源和粒径分布的不同,不同季节可吸入细颗粒物对健康的影响差异,反映了可吸入细颗粒物的理化特性。夏季,气温可以作为独立的一个环境因子刺激人体,而在冬季则只是作为颗粒物理化特性的一个指引。(李怡)
1.2 2014—2015年中国主要城市大气污染特征及其与气象条件的关系
2013年1月开始中国环境监测总站开始面向社会发布实时的全国主要城市空气质量数据,为研究全国尺度的大气污染状况研究提供了数据支撑。尽管已有研究分析了中国城市大气污染时空分布特征,但多尺度气象条件对中国城市大气污染的影响及这种影响的空间差异还不清楚。利用2014—2015年全国31个省会城市6项污染物(CO、NO2、O3、PM10、PM2.5和SO2)小时浓度数据分析了中国主要城市的大气污染特征及其与多尺度气象条件的关系。单一的气象要素很难系统地描述气象条件对大气污染的影响,采用小波分解-人工神经网络(WT-ANN)方法建立统计模型,利用解释方差量化了不同地区气象条件对污染物浓度逐日变化的贡献。研究发现,2014年6项污染物年平均浓度为1.2 mg/m3、42.2 μg/m3、49.0 μg/m3、109.8 μg/m3、63.7 μg/m3和32.6 μg/m3。2015年大部分城市污染物浓度明显降低(O3除外),CO、NO2、PM10、PM2.5和SO2平均浓度下降5.3%、4.9%、11.4%、12.0%和21.5%,而O3平均浓度增加7.4%。PM2.5作为首要污染物出现的比率最高,其次依次为PM10、O3、NO2、SO2和CO。WT-ANN模拟结果显示,气象条件是驱动污染物浓度逐日变化的主要因子,多尺度气象条件在大部分城市对污染物浓度的解释方差超过70%。2015年有利扩散的天气形势比率有所减少,而不利扩散的天气形势比率有所增加,说明2015年中国主要城市空气质量的改善主要与污染物减排有关。(何建军)
1.3 我国不同背景地区新粒子生成事件的特征及其对云凝结核的影响
在华北区域本底站上甸子、华中地区泰山站和长三角本底站临安开展了3~800 nm气溶胶数谱和新粒子生成事件的研究。3 nm颗粒物的成核速率在上甸子、泰山和临安分别是6.3, 3.7和5.8个/(cm3·s),增长速率分别为3.6、6.0和 6.2 nm/h。新粒子生成事件的对比研究结果表明,在长三角地区有更强的低挥发有机蒸汽的源和更强的凝结汇。在我国背景区域观测到的新粒子生成事件和国外其他背景站点相比,有较高的凝结汇、成核速率和增长速率。凝结汇和成核速率可以高达国外站点的10倍左右,而增长速率可以高出1~2倍。在新粒子生成事件天气中,云凝结核数浓度可以增加2~6倍。并且较国外其他背景站点而言,新粒子生成事件对于我国大气中云凝结核数浓度的影响要更显著(图1)。(沈小静)
1.4 2015年阅兵期间减排对气溶胶数谱和新粒子生成事件的影响
为保障2015年阅兵期间良好的空气质量,北京及周边省市于8月20至9月3日实施了高强度的减排措施。本研究对比了2015年阅兵期间和2008年奥运期间的污染物减排情况和同期其他年份(2010—2013年)非减排情况下气溶胶数谱的差异。结果表明,阅兵期间气溶胶积聚模态颗粒物数浓度有显著下降,PM1质量浓度降低了60%~90%。颗粒物浓度的下降还与气象要素有关,阅兵期间来自南部的污染气团只有14%,而在同期其他年份,污染气团能达到60%。在阅兵期间,共观测到6次新粒子生成事件,频率较非减排期间高,但是成核速率和增长速率较非减排期间低。通过对比凝结汇、气态硫酸、辐射和相对湿度发现,上甸子地区控制新粒子生成的首要因素是凝结汇,其次是气态硫酸的浓度(图2)。(沈小静)
1.5 气溶胶光学-辐射特性地基观测研究
针对2015年12月华北严重雾霾过程开展了气溶胶光学-辐射特性研究,水汽含量增加有利于雾霾发展加剧;雾霾期间有大量细粒子吸湿增长为粗模态;评估了客观因素对气溶胶光学特性的误差贡献;临近站点之间的AAOD、SSA相关性较AOD低的原因可能与局部大气扩散和气溶胶类型(吸收性黑碳和棕碳)差异有关(图3~4)。(车慧正)
1.6 不饱和有机酸在矿物气溶胶表面非均相反应的机理及动力学研究
非均相反应在大气中起着重要作用,其可以改变大气气溶胶组分从而造成空气污染。然而不饱和有机酸作为一类重要的挥发性有机物,其非均相反应的机理和动力学过程仍然不清楚。在我们的研究中,利用努森池反应器-四极杆质谱和漫反射红外光谱原位模拟了大气典型不饱和有机酸(丙烯酸和甲基丙烯酸)在典型矿物气溶胶表面的非均相反应。首次获取了该非均相反应的一系列真实摄取系数,并估算了大气中不饱和有机酸的非均相反应寿命。另外,结合漫反射红外光谱仪技术,同时检测了反应过程中气溶胶表面产物变化,解析了反应通道。结果表明,不饱和有机酸在矿物气溶胶表面的非均相反应是其大气去除的一种重要途径。尤其是在重污染天气下,此非均相反应可以促使挥发性有机物在气溶胶表面的转化,在气溶胶表面生成羧酸盐等二次有机物,直接改变气溶胶表面组分。(吴玲燕)
1.7 兰州冬季不同化学物种对细颗粒物污染的贡献
兰州冬季亚微米气溶胶质量浓度以90 μg/m3为分界线,分成“低浓度”和“高浓度”2个区域。硫酸盐、硝酸盐、铵盐和氯化物在低浓度区域均呈现单调递增,甚至接近线性增长的特点,而在高浓度区,这些物种的浓度均开始下降。对有机物种而言,一次有机气溶胶(POA,包括BBOA、CCOA、HOA和COA)和二次有机气溶胶(SOA,包括OOA1、OOA2)的变化趋势明显不同。在低浓度区,POA和SOA均呈现增长的趋势,但增长速率不同,而在高浓度区,二者变化趋势正好相反,即POA在高浓度区不断增长,而SOA则增长缓慢甚至呈现下降趋势。这些观测结果说明,兰州有机气溶胶中一次有机气溶胶占有主导地位,尤其在亚微米气溶胶浓度偏高时段贡献更加明显,兰州一次排放是细颗粒物的主要污染源,并且在高浓度污染事件中起着举足轻重的作用。(张养梅)
1.8 华北平原夏季强化观测
光化学污染问题在我国一些地区越来越突出,尤其是在华北平原,成为迫切需要与霾污染一同解决的大气环境问题。光化学污染是以高浓度臭氧、过氧乙酰硝酸、二次气溶胶等为主要特征污染类型,对人体健康、农业与林业产量等均有负面影响。中国气象科学研究院区域大气污染与光化学团队长期关注这类问题,已通过一些项目开展了多年研究。在环保公益专项(编号201509002)经费的支持下,团队于2016年6月13至7月31日再次在华北平原开展了强化观测。试验期间,团队在河北饶阳县和山东德州市2个站点同步开展了臭氧及其前体物以及气溶胶的观测。本次试验按计划完成了既定观测任务,取得了大量宝贵观测资料,为后期综合分析和模拟研究打下了良好的基础。(徐晓斌)
1.9 灰度仪测量的夏季华北平原黑碳垂直廓线
黑碳(BC)气溶胶是可见光的最强吸收成分,具有很强的气候效应。2014年夏季在华北平原农村饶阳气象站现场观测中,采用系留汽艇对BC垂直廓线进行了测量。本工作首次对BC垂直分布随混合层的演变进行了研究,对67条有效测量廓线获得了包括混合高度(Hm)和混合层BC浓度(Cm)及自由对流层BC浓度(Cf)等要素。Hm在清晨时段通常低于0.2 km,随着湍流增强而迅速上升,在傍晚时分达到最大。在晴朗的夏日,混合层顶可发展到1 km以上高度,而在阴天却维持在较低高度。日落后混合层塌陷,逐步形成温度的夜间边界层。混合层BC浓度Cm的最高和最低值分别出现在清晨和下午时段。白天时段的BC基本上均匀地分布于混合层,而在混合层之上却显著下降。整个现场观测期间Cm在1.12~14.49 μg/m3范围波动,平均为(5.16±2.49) μg/m3。与一些城市地区例如意大利米兰和中国上海的测量结果接近。傍晚后的BC逐步在近地面积累,并形成随高度指数变化的分布。与Hm和Cm的较大变化相反,Cf在日内基本不变,在清洁条件下大约为地面浓度水平的10%,在污染的情况下接近地面浓度的50%。BC垂直分布的直接测量有助于更准确地评估其直接辐射强迫,并且可改进区域气溶胶光化特性的遥感反演。(徐晓斌)
1.10 中国瓦里关全球大气本底站地面臭氧长期趋势及影响因素Ⅰ:总趋势与特征
对流层臭氧是重要大气氧化剂,同时也是温室气体和大气污染物。臭氧浓度上升可影响大气氧化性、气候、人体健康和植物生长。因此,臭氧本底水平的长期趋势是环境和气候变化评估非常需要的信息。迄今为止,这样的信息只能在欧洲和北美一些代表性站点获得,在我国和许多发展中国家极为缺乏。我国青藏高原东北角的瓦里关全球大气本底站(36°17′N,100°54′E,海拔3816 m)自1994年起就开展了地面臭氧的长期观测。本工作对1994—2013年的数据进行了系统分析,对地面臭氧的变化特征、长期趋势和影响因素进行研究,并已经在2篇论文中归纳发表,其中本文主要关注地面臭氧总体的日变化、季节变化和长期趋势。为取得可靠的臭氧趋势,采用Mann-Kendall趋势检验法和Hilbert-Huang变换(HHT)对臭氧长期观测资料进行了分析。研究表明,瓦里关的山-谷风效应在该站臭氧的昼夜变化中起重要作用,导致夜间高值和白天低值。山-谷风既有日变化也有季节变化,利用这种特征首次定义了与季节相关的白天和夜间时段,并用于趋势计算中的数据选取。计算结果表明,瓦里关地面臭氧白天和夜间的总体趋势分别为(0.24±0.16)×10-9/a和(0.28±0.17)×10-9/a;最大的夜间增长出现在秋季((0.29±0.11)×10-9/a),其次分别是春季((0.24±0.12)×10-9/a)、夏季((0.22±0.20)×10-9/a)和冬季((0.13±0.10)×10-9/a)。HHT谱分析识别出了4个阶段,具有不同增长趋势,其中最大增长出现于2000年5月和2010年10月前后。HHT分析还揭示了瓦里关地面臭氧时间序列中存在着2~4年、7年和11年等周期变化信号。本研究成果可用于气候和环境变化评估以及化学-气候模式的验证(图5)。(徐婉筠)
1.11 北京大气颗粒物中真菌气溶胶对有机碳的贡献
真菌气溶胶是大气颗粒物的重要组成部分,也会对大气颗粒物中的有机碳(OC)产生贡献。为了摸清北京大气颗粒物中真菌气溶胶对OC的贡献,本研究在清华大学和密云设置采样点,分别代表城区和郊区,采集PM2.5和PM10,对真菌气溶胶分子示踪物甘露糖醇进行分析测试。结合单个真菌气溶胶中分子示踪物含量的转换系数f甘露糖醇(0.49×10⁻³ng/个)以及分子示踪物的质量浓度,获得北京地区全年真菌气溶胶的数浓度,再应用单个真菌气溶胶中平均含碳量经验常数foc= 13±2.3 PgC/个,估算出北京城区PM2.5和 PM10中真菌气溶胶OC年均浓度分别为(0.3±0.2)µgC/m3和(0.8±0.7)µgC/m3, 及其对OC贡献的年均水平分别为(1.2±0.7)% 和(3.5±3.7)%。真菌气溶胶对OC的贡献呈现了明显的季节变化特征,随夏、秋、春、冬而递减。夏季北京市区和郊区PM10中真菌气溶胶对OC的贡献分别高达(7.3±3.3)%和(14.1±10.5)%。因此,需要在更多人口密集城市地区的研究,才能更好地了解大气中真菌气溶胶的浓度水平、季节变化特征以及对有机气溶胶的贡献。(梁林林)
1.12 大气环境容量系数A值频率曲线拟合及其应用
在用A值法确定大气环境容量的研究中,给出了大气环境容量系数的理论定义、特性及其累积频率曲线的PⅢ型拟合,同时证明该系数也可定义为空气自洁指数。以北京为例探讨了不同重现期的大气环境容量系数在不同控制区面积、时段所对应的容量及其相应空气质量的关联。按1951—2014年的气象数据计算的北京百年一遇的年均A值为4.47,而百日一遇的日均A值仅为0.23。研究结果表明,大气环境容量系数的频率分析或可成为大气环境管理中的一个重要工具。(王郁)
1.13 污染源减排与气象要素对2014年“APEC蓝”的影响
“APEC蓝”这个名词被官方及各种媒体用来描述2014年APEC会议期间(11月5—11日)北京蓝蓝的天空。通常情况,那段时间北京污染比较严重。滑动t检验方法研究出2014年北京“APEC蓝”窗口的准确时间为11月1—14日,北京及其周边地区空气质量大为改善,PM2.5、PM10、SO2和 NO2浓度都明显减少,尤以PM10最为明显。小波分析和多尺度相关等方法分析显示11月1—6日和11—13日是减排措施与气象场的共同作用,而7—10日则主要是减排的作用。(汪萍)
2 大气成分模式的发展应用及大气成分的影响研究
2.1 东亚夏季风系统对未来人为气溶胶及其前体物排放减少的响应
利用包含了气溶胶直接、半直接和间接效应的气溶胶-气候耦合模式,结合一个中低温室气体排放水平的情景(RCP4.5),研究了东亚夏季风系统对21世纪末人为气溶胶及其前体物排放减少的响应。结果表明,2000—2100年气溶胶减少造成东亚季风区夏季平均大气顶和地表全天净短波辐射通量分别增加3.9 W/m2和4.0 W/m2。辐射场的变化导致热力场、动力场和水循环的改变。气溶胶减少增加了东亚夏季海陆表面热力性质对比,导致东亚季风区夏季850 hPa风场产生明显的西南和南风距平,且引起东亚副热带急流位置北移,从而增强了东亚夏季风环流。季风的增强造成东亚季风区夏季平均降水增加10%。(王志立)
2.2 人为气溶胶排放减少对将来极端气候的影响
利用一个地球系统模式的集合模拟结果,分析了在人为气候变化情景下气溶胶排放的减少对中国和全球极端温度和降水的影响。结果表明,在RCP8.5情景下,减少的气溶胶排放极大地增强了温室气体增加导致的增暖效应,使得极端气候明显增加。在2031—2050(2081—2100)年,气溶胶减少引起的中国区域平均极端温度和极端降水的增加分别占到其总增加的23%(14%)和32%(30%)以上。气溶胶减排引起的极端气候变化具有明显的区域差异。研究还表明,21世纪全球平均表面温度每度增暖下全球极端降水的变化强烈依赖于排放情景中的强迫成分,其中气溶胶强迫造成的极端降水随增暖的增加率明显大于温室气体强迫的影响。如果未来采用较低的温室气体排放路径,气溶胶强迫将对极端降水的增加起到关键作用。(王志立)
2.3 气溶胶推迟午后降水现象研究
利用珠江三角洲地区长期的PM10、云地闪电、SO2、NO2、降水等小时观测数据,研究了大气主要污染物与降水日变化之间的关系。降水日变化峰值发生前,气溶胶有抑制降水的趋势;峰值后,气溶胶有促进降水的趋势。在污染条件下,珠江三角洲地区全天累计发生正闪(PCG)约占所有闪电的30%,是全球陆地正常平均气候态下的3倍;且1400~1500 LT以后,气溶胶有促进闪电多发的趋势。利用WRF数值模式,发现气溶胶污染条件下模式能很好地再现降水日变化特征,而在清洁条件下,降水明显提前。这表明气溶胶有推迟降水的作用。同时,通过关闭模式的直接辐射效应模块发现,降水也会显著提前,表明气溶胶辐射效应在气溶胶推迟降水过程中发挥了不可忽视的作用。因此,我们提出了气溶胶辐射效应(ARI)与气溶胶云微物理效应(ACI)在白天不同时刻相互竞争导致降水推迟的新机制(图6~7)。(郭建平)
2.4 基于多源主被动卫星数据的气溶胶对中国东部地区不同云垂直结构的影响机制研究
以往的研究工作很少研究不同云的垂直结构对气溶胶的响应。本项目围绕该方向主要取得了如下2项重要突破:(1)利用2008—2010年3个暖季(5—9月)星载云雷达数据,研究中国东部不同地区的积云、对流云、云层云等不同云类型的垂直概率分布特征,结合地基能见度观测,首次给出了中国东部人类活动密集区气溶胶对不同类型云在不同高度上存在间接效应的观测证据,并指出气溶胶对对流云的上部存在促进作用,这种促进作用是以下层云发展受抑制为代价的,这个观测结果印证了气溶胶对对流云降水的促进作用理论(Invigoration Effect)。(2)成功分离下对流层稳定度(LTS)以及垂直风速等气象条件对气溶胶云相互作用的影响。(郭建平)
2.5 基于探空数据构建的中国边界层高度气候数据集
边界层是地气系统物质交换的主要场所,对云降水系统的发生发展过程具有重要意义。目前我国缺乏大范围长期的边界层高度观测数据,现有的边界层高度信息主要来自零星的个别加强试验的观测反演结果和来自国外的再分析资料2个渠道。本项目利用2011—2015年全国120个探空站02:00、08:00、14:00、20:00(北京时)探空观测温度、湿度、风等秒级精细廓线数据,通过改进的整体理查森算法,成功反演一套覆盖我国不同地区不同季节的边界层高度气候数据集。考虑到夏季是降水多发期,首次给出了夏季我国大范围的边界层高度日变化空间分布。云对边界层发展的影响在不同时次有显著的差异,其中14:00点的云盖对边界层发展起到明显的抑制作用。同时,发现我国大部分站点的边界层高度与地面气压和近地面稳定度呈负相关,而与近地面风速和气温呈正相关。(郭建平)
2.6 2013年1月重霾污染过程中国地区气溶胶短期辐射影响及其地区差异研究
采用WRF-CMAQ-SES2离线耦合模式系统模拟了2013年1月重霾污染过程中国地区气溶胶对地面辐射的短期影响效应及其地区差异。结果表明:(1)经过地面实测PM10和PM2.5浓度订正后,气溶胶模拟浓度较接近于实测值,显著减小了气溶胶模拟的不确定性;(2)采用上述不确定性较小的气溶胶垂直廓线资料模拟的总辐射和直接辐射更接近于实测辐射值;(3)2013年1月重污染过程气溶胶对总辐射、直接辐射的削减值介于-200~-100 W/m2,其短期影响可达气溶胶长期气候效应的2个量级;(4)由于气溶胶化学组成的地区差异导致气溶胶的短期辐射影响程度自北向南呈减小趋势,其中霾污染较重的京津冀地区气溶胶对辐射的影响最大,另外即使在相同的气溶胶浓度状况下,气溶胶对辐射的影响亦存在南北差异。(程兴宏)
2.7 本底站和城区站CO浓度变化特征和源贡献
采用FLEXPART大气扩散模式结合清单的模拟方法,通过与2010年北京上甸子大气本底站和城区海淀宝联站的CO观测浓度的比较,研究了北京地区CO浓度变化特征,并统计分析了各类排放源的贡献差异。研究结果表明,上甸子站和宝联站CO模拟浓度与观测浓度的变化趋势基本一致,相关系数分别优于0.74和0.45;与观测值相比,2个站模拟浓度值偏低,模式对观测浓度峰值模拟能力有限。利用不同源清单模拟获得的同一站点CO浓度值相近,但交通、工业、民用等分类排放源对CO模拟浓度的贡献差异明显。与INTEX-B2006 清单相比,利用MEIC2010排放清单模拟的宝联站交通与工业排放贡献的占比小、民用排放占比大;而上甸子站交通排放贡献的占比小,民用与工业排放的贡献占比大。因此,利用FLEXPART模式结合清单的模拟方法对CO浓度具有较好的模拟能力,可以较为准确地反映区域大气本底站和城区站CO浓度的变化特征;各类排放源对模拟浓度的贡献不仅受到测站所在地的局地排放源影响,更与影响测站的印痕区域的排放源密切相关。(程巳阳)
2.8 伴随模式在追踪污染事件重点源区中的应用
利用GRAPES-CUACE气溶胶伴随模式,对2015年11月27日至12月2日北京市一次高浓度PM2.5污染过程进行敏感性分析,显示了伴随模式在追踪重点排放源区及关注敏感排放时段等方面的优越性。研究表明,本次污染事件所关注的北京市PM2.5峰值浓度是北京市本地排放源和周边省市排放源共同作用的结果。从累积敏感系数来看,目标时刻前23 h内,本地源贡献占主导,PM2.5峰值浓度对本地排放源响应迅速;目标时刻前5 h,本地源对峰值浓度的贡献达到最大,逐时敏感系数峰值为9.4 μg/m3。周边源贡献表现为周期性波动,逐时敏感系数在目标时刻前9 h、29 h和43 h,出现3次峰值,分别为6.66 μg/m3、6.24 μg/m3和1.74 μg/m3,伴随着偏南风,周边源在目标时刻前1~57 h内持续不断地向北京市输送污染物,不同距离的周边源对目标时刻PM2.5峰值浓度的影响时段和程度不一样,目标时刻前72 h内,北京、天津、河北及山西排放源对目标时刻PM2.5峰值浓度的累积贡献比例分别为31%、9%、56%及4%。从逐时敏感系数来看,天津源贡献的主要时段为目标时刻前1~33 h,逐时敏感系数峰值出现在目标时刻前9 h,为2.1 μg/m3;山西源贡献的主要时段为目标时刻前17~33 h,逐时敏感系数峰值出现在目标时刻前27 h,为0.71 μg/m3;河北源贡献的主要时段为目标时刻前1~57 h,逐时敏感系数呈现周期性波动,出现3次峰值,分别为4.55 μg/m3、5.31 μg/m3、1.59 μg/m3(图8~10)。 (安兴琴)

图1 我国不同背景地区的新粒子生成事件Fig. 1 New particle formation events at different rural sites in China

图2 2015年阅兵期间污染物减排对新粒子生成事件的影响Fig. 2 The in fluences of emission control on new particle formation events during China,s V-Day parade in 2015
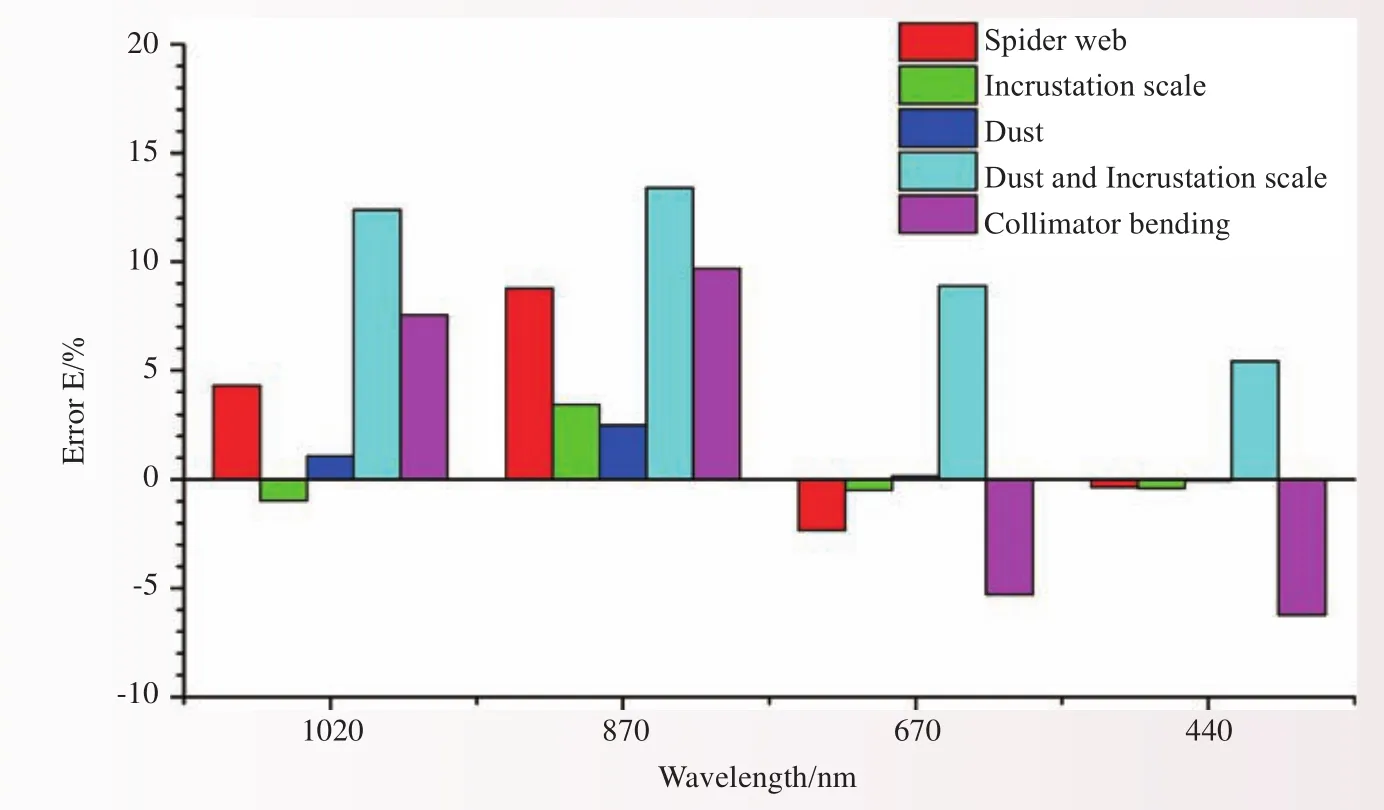
图3 不同因子对气溶胶光学特性观测的影响Fig. 3 Errors in retrieving aerosol optical properties by various factors
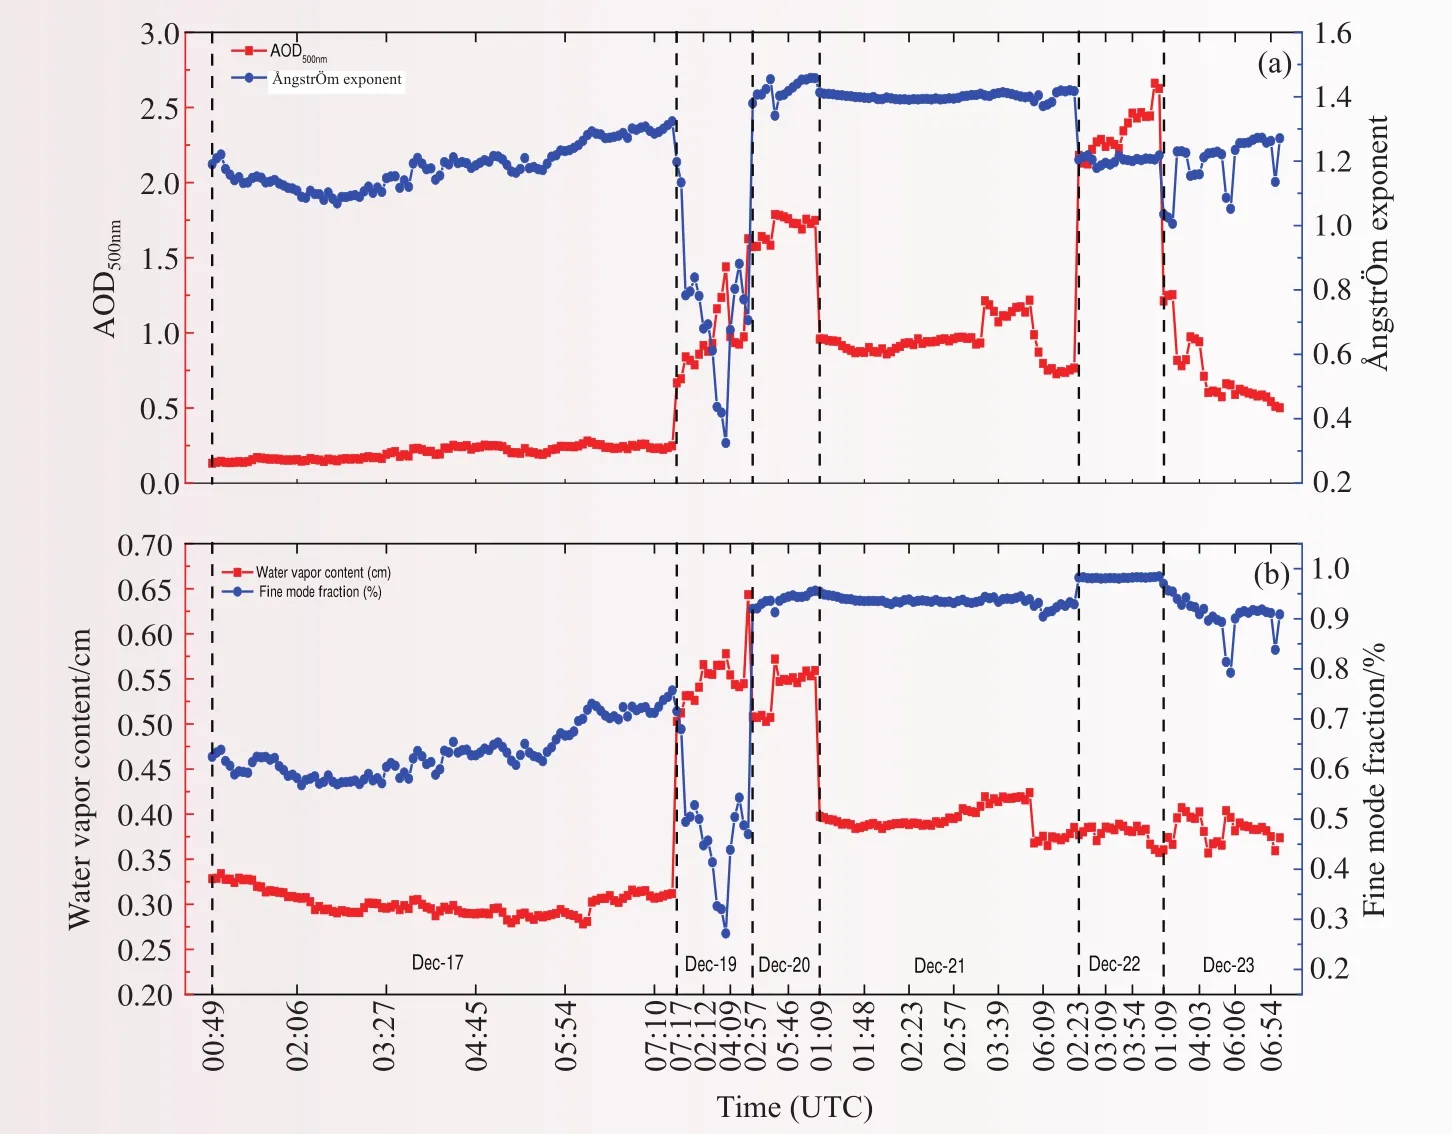
图4 雾霾期间气溶胶光学特性变化Fig. 4 Variations of aerosol optical properties during heavy haze episodes in Beijing

图5 1994—2013年瓦里关地面臭氧月平均浓度(a虚线为内插值)、c1~c5模态函数(b~f)以及残差(g)((a)中的时间段根据c5的斜率来确定,红色虚线为Kendall趋势,响应数值为Kendall变率(10-9/a))Fig. 5 The monthly averaged ozone concentrations at WLG from 1994 to 2013 (dashed lines in (a) denote interpolated data) and its intrinsic mode functions c1–c5 (b–f) and its residue (g). The time segments in (a) were determined by the slope of c5. The red slashed lines are the Kendall’s trends and the numbers are the Kendall’s slope (in 10-9a-1)
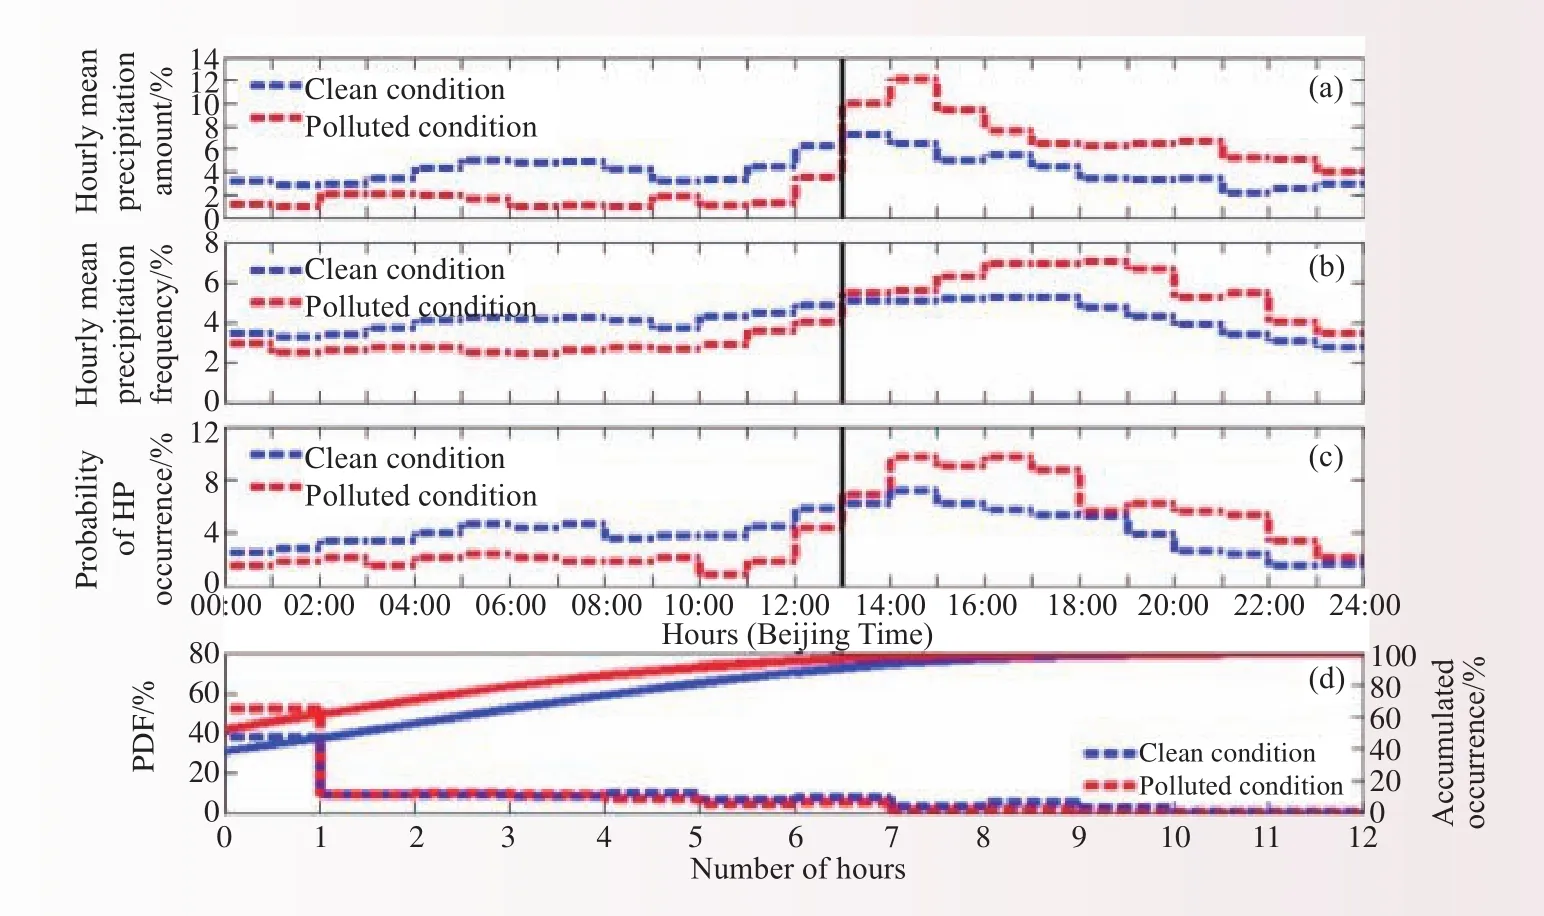
图6 基于2008-2012年5个暖季(5-9月)长期时空匹配的小时气溶胶和降水数据得到的污染和清洁条件下降水强度、降水频次以及强降水频次的日变化Fig. 6 Diurnal variation of precipitation intensity, precipitation frequency, and heavy precipitation frequency under polluted and pristine conditions based on collocated hourly aerosol and rain gauge data for the warm seasons during the period of 2008–2012

图7 WRF模式模拟的不同气溶胶浓度以及气溶胶辐射效应考虑与否条件下的所有降水(a)、冷云降水(b)以及暖云降水(c)系统日变化结果Fig. 7 The diurnal cycles of the WRF simulated precipitation (a), precipitation formed in warm clouds (b), and cold clouds (c)under various aerosol concentrations with or without aerosol radiative effects

图8 本地源及周边源逐时(a)和时间累积(b)敏感系数序列Fig. 8 Time series of hourly (a) and temporally-cumulated (b) sensitivity coefficients of local and surrounding emissions

图9 北京(BJ)、天津(TJ)、河北(HB)及山西(SX)排放源对目标时刻(2015年12月1日01∶00)PM2.5峰值浓度逐时(a)与时间累积(b)贡献百分比序列Fig. 9 Percentage variation of hourly (a) and temporally-cumulated (b) contributions of Beijing, Tianjin, Hebei and Shanxi emissions to the PM2.5peak concentration at the target time (i.e., 01:00 1st Dec. 2015)

图10 北京(BJ)、天津(TJ)、河北(HB)及山西(SX)排放源逐时(a)与时间累积(b)敏感系数序列Fig. 10 Time series of hourly (a) and temporally-cumulated (b) sensitivity coefficients for Beijing, Tianjin, Hebei and Shanxi emissions, respectively
Progress in Atmospheric Composition and Atmospheric Chemistry Research
1 Observational studies of atmospheric composition and related properties
1.1 Reassessing the effects of temperature enhancement under haze environment on human mortality
We studied the haze impact on human health during different seasons. Results indicate significant (p< 0.05) associations between haze intensity and relative health risks (RHRs) of all-cause, cardiovascular,and respiratory mortalities for some sensitive human groups, and increased haze intensity could increase the RHR of mortality, ranging between 1.5%–7.0% on different lagging days. No significant association was observed for genitourinary, digestive, or metabolic diseases. The cumulative effects of haze during a 6-day lag of cardiovascular, respiratory, and all-cause mortalities were in the mortality range of 2%–11%. The lag and cumulative effects differ under cold and warm seasons. We found significant seasonal modification in the associations: The enhanced effects of haze on respiratory diseases in spring, on all-cause mortality in spring and winter, and on cardiovascular mortality in summer and winter. We conclude that air temperature appears to be a unique factor in associating haze and mortality in summer but an indication for the physical property of fine particles. (Li Yi)
1.2 Air pollution characteristics and their relation to meteorological conditions during 2014–2015 in major Chinese cities
Since January 2013, the real-time hourly averaged concentrations of six pollutants (i.e., CO, NO2, O3,PM10, PM2.5and SO2) based on air quality monitoring stations in major Chinese cities have been released to the public. This provides a good opportunity to publicize nationwide temporal and spatial pollutant characteristics. Although several studies systematically investigated the temporal and spatial trends of pollutant concentrations, the relation between air pollution and multi-scale meteorological conditions and their spatial variations on a nationwide scale remain unclear. A single meteorological parameter could not reflect the overall relation between meteorological conditions and air pollution. A combination of multi-scale meteorological conditions using the ANN model combined with wavelet transformation is a useful method to study this complex relationship. This study analyzes the air pollution characteristics and their relation to multi-scale meteorological conditions during 2014–2015 in 31 provincial capitals in China. Results show that the annual average concentrations of the six pollutants were 1200, 42.4, 49.0, 109.8, 63.7, and 32.6 μg m-3in 2014,which decreased 5.3%, 4.9%, 11.4%, 12.0% and 21.5% for CO, NO2, PM10, PM2.5and SO2, respectively, but increased 7.4% for O3in 2015. The highest rate of a major pollutant over China was PM2.5followed by PM10,O3, NO2, SO2and CO in that order. Meteorological conditions were the primary factor determining day-to-day variations in pollutant concentrations, accounting for more than 70% of the variance of daily average pollutant concentrations over China. Meteorological conditions in 2015 were more adverse for pollutant dispersion than in 2014, indicating that the improvement in air quality was caused by emission controls. (He Jianjun)
1.3 Key characteristics of new particle formation events at three background sites and their in fluences on cloud condensation nuclei
Long-term continuous measurements of particle number size distributions with mobility diameter sizesranging from 3 to 800 nm were performed to study new particle formation (NPF) events at Shangdianzi(SDZ), Mt. Tai (TS), and Lin’an (LAN) stations representing the background atmospheric conditions in the North China Plain (NCP), Central East China (CEC), and Yangtze River Delta (YRD) regions, respectively.The mean formation rate of 3-nm particles was 6.3, 3.7, and 5.8 cm-3s-1, and the mean particle growth rate was 3.6, 6.0, and 6.2 nm h-1at SDZ, TS, and LAN, respectively. The NPF event characteristics at the three sites indicate that there may be a higher source of low volatile vapors and higher condensational sink of pre-existing particles in the YRD Region. The formation rate of NPF events at these sites, as well as the condensation sink, is approximately 10 times higher than some results reported at rural/urban sites in western countries.However, the growth rates appear to be 1–2 times higher. Generally, the cloud condensation nuclei (CCN)number concentration can be enhanced by approximately a factor of 2–6 on these event days. NPF events have also been found to have greater impact on CCN production in China at the regional scale than in the other background sites worldwide (Fig.1). (Shen Xiaojing)
1.4 In fluences of emission control on particle number size distribution and new particle formation during China,s V-Day parade in 2015
Temporary restricted emission control strategies were conducted to ensure high air quality for China,s V-Day parade (20 August–3 September 2015) in Beijing and nearby cities. In this study, the particle number size distributions during this period and the 8–23 August 2008 Olympics period are compared to those occurring during the same period without restricted emission control in 2010–2013 (20 August–3 September).Results show significant reductions in the accumulation mode particle number concentration in 2015, with the PM1mass concentration decreased by 60%–90%. The alleviating PM1concentration might be attributed partly to some weather conditions, based on a back-trajectories analysis showing that the southerly polluted air mass accounted for 14% of the total back trajectories in 2015, whereas it contributed to approximately 60% in the other years. During the control period in 2015, six new particle formation (NPF) events were observed, with higher frequencies but lower formation and growth rates than those during the same period in 2010–2013.A comparison of the condensation sink (CS), sulfuric acid, solar radiation and relative humidity between the different years indicated that the CS determines mostly the NPF occurrence and then the concentration level of precursor vapors participating in the NPF event at Shangdianzi station (Fig. 2). (Shen Xiaojing)
1.5 Aerosol optical-radiative properties from ground-based measurements
Aerosol optical properties based on ground and satellite data retrievals during a serious haze episode in December 2015 over Beijing were studied. Results show that high relative humidity could accelerate haze development, and that ample fine particles could grow into large particles through hygroscopic processes.Errors in retrieving aerosol optical properties from sunphotometer measurements of CARSNET due to a variety of objective factors were analyzed. Results indicate that lower correlations of AAOD with SSA than AOD between two nearby urban sites in Beijing could be attributed to differences in diffusive conditions and aerosol types (e.g., black carbon and brown carbon) (Fig. 3–4). (Che Huizheng)
1.6 Mechanisms and kinetics of heterogeneous reactions of unsaturated organic acids onα-Al2O3and CaCO3
Heterogeneous reactions play a vital role in determining the evolution of atmospheric aerosols, especially air pollution. However, their mechanisms and kinetics involving unsaturated organic acids, as an important volatile organic compound, still remain elusive. In this work, the heterogeneous uptake of two representative atmospheric unsaturated organic acids on mineral aerosols includingα-Al2O3and CaCO3were investigated using a Knudsen cell reactor and an in situ Diffuse Reflectance Infrared Fourier Transform Spectrometry(DRIFTS) reactor. The corresponding reaction pathways were proposed after analyzing the DRIFTS spectral features. In addition, the initial uptake coefficients of unsaturated organic acids and their heterogeneous fate were obtained for the first time. Our results suggest that heterogeneous reactions onα-Al2O3and CaCO3can be important sinks for acrylic acid and methacrylic acid, as well as possible contributors to the organic coating found on atmospheric aerosols, especially under high-polluted events. (Wu Lingyan)
1.7 Contributions of various chemical species to fine particle pollutants in winter in Lanzhou
The NR-PM1mass concentrations are separated into “lower” and “higher” than 90 μg m-3mass loading ranges during wintertime in Lanzhou. Results show monotonic and almost linear increases in sulfate, nitrate,ammonium and chloride, with increasing PM loading in the higher mass loading range, but began to decrease in the lower mass loading range. Significantly different trends of variations were found between POA species(i.e., BBOA, CCOA, HOA, COA, and total POA) and SOA species (i.e., OOA1, OOA2, and total SOA).That is, both the POA and SOA species had increasing trends but with various rates in the lower mass loading range. However, inversed variation trends were observed between the POA and SOA species in the higher mass loading range. The POA species increased dramatically in the higher mass loading range, while the SOA species showed slow increasing or even decreasing in the higher mass loading range. The POA dominated SOA in most of the sampling time and even became more dominant with increased SOA mass fraction in NRPM1. These results reveal that primary emissions are the major sources of fine PM in Lanzhou and they play an important role in building up high PM pollution during wintertime. (Zhang Yangmei)
1.8 Summer intensive field campaign in the North China Plain
Photochemical pollution has become severer in some regions in China, particularly in the North China Plain (NCP). It is urgently needed to solve this atmospheric environment problem along with haze pollution.Photochemical pollution is characterized as high ambient concentrations of ozone, peroxyacetyl nitrate (PAN)and secondary aerosols, which have adverse impacts on human health, crop growth and forest productivity.The Regional Air Pollution and Photochemistry (RAPP) team at CAMS has paid close attention to such problems through several research projects for many years. With the funding of an Environmental Protection Public Welfare Scientific Research Project (grant no. 201509002), the team conducted another intensive field campaign in the NCP during the period of 13 June–31 July 2016, with ozone and its precursor gases as well as aerosols observed at Raoyang (a rural site in Hebei) and Dezhou (a urban site in Shandong). The team successfully completed the planned measurements and collected many valuable data, which will facilitate the future integrated analyses and model validations. (Xu Xiaobin)
1.9 Vertical profiles of black carbon measured by a micro-aethalometer in summer in the North China Plain
Black carbon (BC) is a dominant absorber in the visible spectrum and a potent factor in climatic effects.Vertical prof les of BC were measured using a micro-aethalometer attached to a tethered balloon during the Vertical Observations of trace Gases and Aerosols (VOGA) field campaign in summer 2014 at a semirural site in the North China Plain (NCP). The diurnal cycle of BC vertical profiles along with the evolution of the mixing layer (ML) was investigated for the first time in the NCP region. Statistical parameters including identified mixing height (Hm) and average BC mass concentrations within the ML (Cm) and in the free troposphere (Cf) were obtained for a selected dataset of 67 vertical prof les.Hmwas usually lower than 0.2 km in the early morning and rapidly rose thereafter due to strengthened turbulence. The ML height was peaked in the late afternoon, at more than 1 km on sunny days in summer, but with much lower values on cloudy days.The ML collapsed near the sunset, followed by the formation of a stable nocturnal boundary layer (NBL).Accordingly, the highest and lowestCmwere found in the early morning and the afternoon, respectively. In the daytime, BC was almost uniformly distributed within the ML but it decreased significantly above.Cmranging from 1.12 to 14.49 μg m-3with an averaged value of (5.16±2.49) μg m-3were observed during the field campaign, which are comparable with observations in many polluted urban areas such as Milan in Italy and Shanghai in China. As evening approached, BC gradually built up near the surface and declined exponentially with height. In contrast to the large variability found both inHmandCm,Cfstayed relatively unaffected throughout the daytime.Cfwas less than 10% of the ground level under clean conditions, while it amounted to half of the ground level in some polluted cases. In situ measurements of BC vertical prof les have an important implication for accurately estimating direct radiative forcing by BC and improving the retrieval of aerosol optical properties by remote sensing in this region. (Xu Xiaobin)
1.10 Long-term trends of surface ozone and its in fluencing factors at the Mt Waliguan GAW station,China Part I: Overall trends and characteristics
Tropospheric ozone is an important atmospheric oxidant, greenhouse gas and atmospheric pollutant.Increased ozone concentrations could affect the atmospheric oxidation capacity, climate, human health and vegetation growth. Therefore, determination of the long-term trends of baseline ozone is highly desirable for environmental and climate change assessment. So far, studies on the long-term trends of ozone at representative sites are available mainly for European and North American sites. Corresponding studies are lacking for China and many other developing countries. Measurements of surface ozone were carried out at a baseline Global Atmospheric Watch (GAW) station in the north-eastern Tibetan Plateau region (Mt Waliguan, 36°17′N,100°54′E, 3816 m a.s.l.) for the period of 1994–2013. To uncover the evolutional characteristics, long-term trends and influencing factors of surface ozone at this remote site in western China, a two-part study was carried out, with this one focusing on the overall characteristics of diurnal, seasonal and long-term variations and the trends of surface ozone. To obtain reliable ozone trends, we performed the Mann-Kendall trend test and the Hilbert-Huang Transform (HHT) analysis on the ozone data. Our results conf rm that the mountainvalley breeze plays an important role in the diurnal cycle of surface ozone at Waliguan, resulting in higher ozone values during the night and lower ones during the day, as was previously reported. Systematic diurnal and seasonal variations were found in mountain-valley breezes at the site, which were used to define seasondependent daytime and nighttime periods for trend calculations. Significant positive trends in surface ozone were detected for both daytime ((0.24±0.16) ×10-9/a) and nighttime ((0.28±0.17) ×10-9/a). The largest nighttime increasing rate occurred in autumn ((0.29±0.11) ×10-9/a), followed by spring ((0.24±0.12) ×10-9/a), summer((0.22±0.20) ×10-9/a) and winter ((0.13±0.10) ×10-9/a). An HHT spectral analysis identified four different stages with different positive trends, with the largest increase occurring around May 2000 and October 2010.The HHT results suggest that there were 2–4 a, 7 a and 11 a periodicities in the time series of surface ozone at Waliguan. Results obtained in this study may be used to assess climate and environment changes and to validate chemistry-climate models (Fig. 5). (Xu Wanyun)
1.11 Contributions of fungal spores to organic carbon in ambient aerosols in Beijing, China
Fungal spores are ubiquitous components of atmospheric aerosols and contributors to organic carbon (OC)in ambient aerosols. To better understand the contributions of fungal spores to OC in Beijing, China, ambient concentrations of the molecular tracers for fungal spores, i.e., mannitol in PM10and PM2.5were measured at an urban site (Tsinghua University) during a year, while observations of PM10at a rural site (Miyun) were conducted during a late spring and a summer. With the conversion coefficient of the averaged mannitol per spore ((0.49 ± 0.20) Pg), the year-round number concentrations of fungal spores were obtained. Using a conversion factor of 13 PgC spore-1, the annual averaged concentrations of spore-OC in PM2.5and PM10atthe THU site were observed at (0.3 ± 0.2) µgC m-3and (0.8 ± 0.7) µgC m-3, respectively, while the respective contributions of spore-OC to total OC were (1.2 ± 0.7) % and (3.5 ± 3.7) %. The seasonal trend of fungal contribution to OC (from the highest to lowest levels) was: summer, autumn, winter and spring. During the summer season, the contribution of fungal spores to OC was observed at a high level at the rural site ((14.1 ±10.5) %), compared to the urban site ((7.3 ± 3.3) %). Thus, more studies are needed to better understand the spatial, temporal and size distributions of fungal OC contributions to atmospheric aerosols in populated areas.(Liang Linlin)
1.12 The cumulative frequency curving fitting of atmospheric capacity A-coefficient and its application
The definition, characteristics and type PⅢ f tting of the cumulative frequency curve of the atmospheric capacity coefficient are obtained with the A-value approach. Results show that the so-obtained A-coefficient can be served as an air-self-cleaning Index. The relationship between the air quality and the environmental capacity coefficient under various recurrence periods is studied for several control areas and periods. Based on the meteorological observations obtained in Beijing from 1951 to 2014, we found an average annual A-value of 4.27 for a hundred of recurrence years and an average daily A-value of 0.23 for a hundred of recurrence days. Results indicate that the frequency analysis of atmospheric capacity coefficient can be an important tool for atmospheric environment management. (Wang Yu)
1.13 APEC-Blue Skies due to emission reduction and favorable meteorological conditionsThe term APEC Blue has been used by official news and other medias in China since the Asia-Pacific Economic Cooperation (APEC) Summit held in Beijing during 5–11 November 2014. That is, clear-sky duration detected by movingt-test appeared during the APEC period, which was unusual for the heavily polluted city of Beijing. Observations show that blue window corresponds to low air pollution with respect to PM2.5, PM10, SO2, and NO2under restricted emission-control measures implemented in and near Beijing,especially PM10. Statistical investigations using wavelet and multi-scale correlation analysis revealed that the blue window resulted from both strong northerly winds and emission reductions. These two factors played an important role in producing “cleaning air” on 1–6 and 11–13 November, whereas the emission reduction became more important in reducing pollutant during 7–10 November. (Wang Ping)
2 Model development and implementation, the impacts of atmospheric compositions on climate, weather, and human health
2.1 Response of the East Asian summer monsoon system to future reductions in emissions of anthropogenic aerosols and their precursors
The response of the East Asian summer monsoon (EASM) system to reductions in the emission of anthropogenic aerosols and their precursors at the end of the 21st century projected by Representative Concentration Pathway (RCP) 4.5 is studied using an aerosol-climate model with aerosol direct, semi-direct,and indirect effects included. Results show that the summer mean net all-sky shortwave fluxes averaged over the East Asian monsoon region (EAMR) at the TOA and surface increase by 3.9 and 4.0 Wm-2, respectively,due to the reductions of aerosols in 2100 relative to 2000. Changes in radiation affect local thermodynamic and dynamic processes and the hydrological cycle. The decreases of aerosols lead to increases in contrast to land-sea surface temperature over the EAMR, southwest and south winds at 850 hPa over eastern and southern China and the surrounding oceans, and the northward movement of the East Asian subtropical jet,thus strengthening the EASM. In turn, the enhancement of the EASM causes a 10% increase in summer mean precipitation averaged over the EAMR. (Wang Zhili)
2.2 The effect of reduction in anthropogenic aerosol emissions on projected climate extremes
This study investigates the effect of reduced aerosol emissions on projected temperature and precipitation extremes in China and globe under the anthropogenic climate change scenario using the ensemble simulations from an Earth System Model. The reduced aerosol emissions under the Representative Concentration Pathway 8.5 (RCP8.5) scenario magnify the warming effect due to greenhouse gases (GHG), thus leading to significant increases in climate extremes. The reduced aerosols contribute to more than 23% (14%) and 32% (30%) of the total increases in temperature and precipitation extremes averaged over China during 2031–2050 (2081–2100),respectively, under the RCP8.5 scenario. There are great regional differences in changes oficlimate extremes caused by the aerosol reduction. Results also show that the increased rate of precipitation extremes with global mean surface warming in the 21st century depends on the compositions of radiative forcing. The increased rate caused by aerosol forcing is significantly larger than that caused by GHG forcing. The aerosol forcing in the coming decades can play a critical role in inducing changes in precipitation extremes if a lower GHG emission pathway is adopted. (Wang Zhili)
2.3 An observational and modeling analysis of precipitation and lightning delays by air pollution over the Pearl River Delta
Given the radiative and microphysical effects of aerosols on the development of convective clouds, an observational and modeling analysis of aerosol concentrations was conducted to reveal if the overall aerosol effects would have any discernible impact on the diurnal variations of precipitation and lightning. For this purpose, daily PM10data were categorized as clean, medium, or polluted. Heavy precipitation and lightning were found to occur more frequently later in the day under polluted conditions than under clean conditions. An analysis of the diurnal variations in several meteorological factors such as air temperature, vertical velocity,and wind speed reveals that the in fluence of aerosol radiative and microphysical effects serve to suppress and enhance convective activity, respectively. Although the effects of aerosol particles on the heavy precipitation can be discerned throughout the daytime, it is not possible to separate their radiative and microphysical influences from those of atmospheric dynamics and thermodynamics. WRF simulations were carried out to identify mechanisms controling the precipitation and lightning under the influences of aerosols. Results show that during the first 8 h period, aerosols acting as a radiation absorber suppress deep convection and precipitation by inducing greater radiative heating and stability. Lesser convection and precipitation occur under polluted conditions than under clean conditions. Due to the suppressed convection, the depletion of convective energy decreases, which in turn boosts the level of stored energy after this period. The boosted level of stored energy enables updrafts to be strong enough to transport a greater amount of cloud liquid to the freezing level and above under polluted conditions than under clean conditions. This in turn induces greater freezing-related latent heating, buoyancy and thus stronger convection, and results in the transition from lower precipitation rates during the first 8 h period to higher precipitation rates during the later 4 h period under polluted conditions than under clean conditions (Fig. 6–7). (Guo Jianping)
2.4 A CloudSat perspective on the cloud climatology and its association with aerosol perturbations in the vertical over eastern China
Although considerable effort has been paid to investigating aerosol-cloud interactions from space, only a few studies have examined the response of vertical cloud structure to aerosol perturbations. A three-dimensional cloud climatology of eight different cloud types identif ed from the CloudSat Level 2 cloud products duringthe warm season (May to September) of 2008–2010 over eastern China was first analyzed. Using visibility as a proxy for cloud condensation nuclei, in combination with satellite-observed radar reflectivity, normalized contoured frequency by altitude diagrams of the differences in cloud radar reflectivity (Z) profiles under polluted and clean conditions were constructed. Results show thatZtends to be inhibited for shallow cumulus clouds (shallow Cu) and enhanced in the upper layers for deep cumulus (deep Cu), nimbostratus (Ns), and deep convective clouds (DCC) under polluted conditions. Overall, an analysis of the modif ed center of gravity(MCOG) and cloud top height (CTH) also pointed to a similar aerosol effect, except for the non-significant changes in MCOGs and CTHs in deep Cu. The impacts of environmental factors such as lower tropospheric stability and vertical velocity are also discussed for these types of clouds. Although consistent aerosol-induced elevations in MCOGs and CTHs for Ns and DCC clouds are observed, the meteorological in fluences cannot be completely ruled out, which merits further studies. (Guo Jianping)
2.5 A climatology of the planetary boundary layer height in China derived from radiosonde and reanalysis data
The important roles of the planetary boundary layer (PBL) in climate, weather and air quality have long been recognized, but little is known about the PBL climatology in China. Using the fine-resolution sounding observations made across China and reanalysis data, we conducted a comprehensive investigation of the PBL in China from January 2011 to July 2015. The PBL height (PBLH) is found to be generally higher in spring and summer seasons than that in fall and winter. A comparison of seasonally averaged PBLHs shows, on average,good agreement, despite the pronounced inconsistence in some regions. The PBLHs derived from three- or four-times-daily soundings in summer tend to peak in the early afternoon, and the diurnal amplitude of the PBLH is higher in the northern and western regions of China than that in the other regions. An investigation of the meteorological influences on the annual cycle of the PBLH shows that the PBLH at most sounding sites is negatively correlated with surface pressures and lower tropospheric stability, but positively correlated with near-surface wind speeds and temperatures. In addition, clouds tend to suppress the PBL development,particularly in the early afternoon. This indicates that meteorology plays a significant role in the PBL processes.The key findings from this study lay a solid foundation for us to gain a deep insight into the roles of the PBL in determining the air pollution, weather and climate of China. (Guo Jianping)
2.6 Short-term aerosol radiative effects and their regional differences during heavy haze episodes in January 2013 in China
Short-term direct effects of aerosols on surface shortwave radiation and their regional differences during the heavy haze episodes in January 2013 in China are investigated using the offline Weather Research and Forecasting (WRF) - the Community Multiscale Air Quality (CMAQ) - radiative transfer scheme (SES2) model system. The aerosol concentrations are first generated using the WRF-CMAQ model simulations and then corrected based on the observed concentrations of PM10and PM2.5. The atmospheric prof le data produced by the WRF model and the corrected aerosol concentrations are used as inputs to the SES2 model to calculate the global horizontal irradiance (GHI) and direct solar irradiance (DIR) at the surface for a period of heavy haze episodes in January 2013 in China. The effects of aerosol on the GHI and DIR at the surface are then analyzed.The modeled radiation is evaluated against the observations, showing some improvement due to the use of corrected aerosol concentrations. The shortwave radiative effects of aerosols are determined by differences between the model calculations with and without the inclusion of aerosols. Results show that the short-term aerosol radiative impacts during heavy haze days are very large, ranging between 100 and 200 W m-2that are about two orders of magnitude greater than that of the long-term climate impacts. The aerosol concentrations have a large spatial variation with the highest concentration occurring in the areas of Beijing-Tianjin-Hebei,which causes a large difference in the radiative effect nationwide. In addition to the total concentration, aerosol compositions also vary from the north to south in China, leading to a significant difference in radiative effect even when the total aerosol concentration is the same at two locations. (Cheng Xinghong)
2.7 Evolution characteristics of and source contribution to CO concentration at the background and urban stations
The FLEXPART atmospheric diffusion model simulations, given emission inventory, have been used to study the evolution characteristics of CO concentrations in Beijing by comparing with the observed CO concentrations at Shangdianzi (SDZ) atmospheric background and Baolian (BL) urban stations in 2010.Meanwhile, various source emission contributions to their CO concentrations were statistically analyzed.Results show similar variations of the simulated CO concentrations to the observed values at SDZ and BL,with the correlation coefficients of greater than 0.76 and 0.45 between the simulation and observations,respectively. The simulated values were lower than the observed, which could be attributed to the limited ability of the model in reproducing CO peaks. The simulated CO concentrations remain similar, when using different source emissions at the same sites, but the contributions of specific classifications differ distinctly.For example, using the emission inventories of MEIC2010 versus INTEX-B2006, the contribution ratios of transportation and resident at both sites were less and greater, respectively, whereas the contribution ratio of industry was less at BL, but greater at SDZ. Therefore, the FLEXPART model simulation for a given emission inventory is an effective tool to study CO concentrations, and their evolution characteristics at the atmospheric background and urban stations. Contributions of emission sources were not only affected by local emissions but also determined by source emissions in the footprint area of measurement stations. (Cheng Siyang)
2.8 An application of an adjoint model to tracking in fluential haze source areas of pollution episodes:A case study of a pollution episode in Beijing in December 2015
An aerosol adjoint module of the atmospheric chemical modeling system GRAPES-CUACE (Global-Regional Assimilation and Prediction System coupled with the CMA Unified Atmospheric Chemistry Environment) was used to perform a sensitivity analysis of a high concentration PM2.5pollution episode(November 27–December 2, 2015) in Beijing. Results illustrate the superiority of the adjoint model in tracking in fluential haze source areas and sensitive emission periods. It was found that the peak PM2.5concentration at the target time in Beijing was the collective effects of local and surrounding emissions in this air pollution episode. An analysis of the temporally cumulated sensitivity coefficients indicates that local emissions played a primary role within 23 hours ahead of the target time. In addition, the peak PM2.5concentration responded rapidly to local emissions, with a maximum hourly contribution of 9.4 μg m-3around 5 hours prior to the target time. Contributions from surrounding emissions exhibited a pattern of periodic fluctuation, and their three peak values of hourly sensitivity coefficients appeared around 9, 29 and 43 hours ahead of the target time,with values of 6.66, 6.24 and 1.74 μg m-3, respectively. Air pollutants from the surrounding emissions were continuously transported to Beijing within 1–57 hours ahead of the target time by southerly winds. It was also found that the impacts of different surrounding emissions on the peak PM2.5concentration in Beijing varied,depending upon their in fluencing time periods and degrees. The accumulative contributions of Beijing, Tianjin,Hebei and Shanxi emissions accounted for 31%, 9%, 56% and 4%, respectively, within 72 hours ahead of the target time. An analysis of the hourly sensitivity coefficients indicates that the main contribution time periods of Tianjin, Shanxi and Hebei emissions were 1–33, 17–33 and 1–57 hours prior to the target time, respectively.The peak values of hourly sensitivity coefficients of Tianjin and Shanxi emissions were 2.1 and 0.71 μg m-3around 9 and 27 hours ahead of the target time, respectively, while those of Hebei emissions appeared a periodic fluctuation with three peak values of 4.55, 5.31 and 1.59 μg m-3. (Fig. 8–10). (An Xingqin)
