高温高压下地幔岩和苦橄质榴辉岩的电导率实验
2016-07-28王欣欣黄晓葛白武明
王欣欣, 黄晓葛, 白武明
1 中国科学院地质与地球物理研究所地球与行星物理重点实验室, 北京 100029 2 中国科学院大学, 北京 100049
高温高压下地幔岩和苦橄质榴辉岩的电导率实验
王欣欣1, 2, 黄晓葛1*, 白武明1
1 中国科学院地质与地球物理研究所地球与行星物理重点实验室, 北京100029 2 中国科学院大学, 北京100049
摘要为了探讨地幔岩模型和苦橄质榴辉岩模型在上地幔存在的合理性,建立上地幔的电性结构,本文利用YJ-3000t紧装式六面顶压机和Solartron IS-1260阻抗/增益-相位分析仪,在1.0~4.0 GPa、700~1150 ℃的条件下,采用交流阻抗谱法(频率范围10-1~106 Hz)分别测量了地幔岩和苦橄质榴辉岩的电导率.实验结果表明:随着温度的升高,地幔岩和苦橄质榴辉岩的电导率大幅增加;随着压力的增大,地幔岩的电导率略有增加,活化体积ΔV为-4.73 cm3·mol-1,而苦橄质榴辉岩的电导率几乎没有变化,活化体积ΔV为-0.11 cm3·mol-1;在电性方面,用苦橄质榴辉岩来表示深部的物质较为合理,地幔岩解释浅部可能更恰当,但浅部物质的分布不均匀,电导率随深度的变化主要受控于温度的影响,其次才是成分.
关键词电导率; 地幔岩; 苦橄质榴辉岩; 高温高压
1引言
根据地球内部密度、弹性波速度等物理性质的变化, Ringwood(1962;1975), Anderson和 Bass(1984;1986)分别提出了地幔岩模型和苦橄质榴辉岩模型.之后,Duff 和Anderson(1989)对苦橄质榴辉岩做了进一步的研究,提出上地幔由体积分数(如不加说明,表示为质量分数)为40%橄榄石、37%单斜辉石、13%石榴子石和10%斜方辉石组成.Ita 和 Stixrude(1992)研究认为:在上地幔和转换带区域,地幔岩的密度和波速能更好地符合地震观测,而在400~500 km区域之间,苦橄质榴辉岩的密度和波速明显低估了地球内部实际值.Irifune等(2008)得出:在地幔转换带上部和中部,与苦橄质榴辉岩比较,地幔岩的弹性波速与地球物理模型波速更相符,但在410 km处却有异常大的速度跳跃;在转换带下部,地幔岩的横波速度明显低于地球物理模型,而苦橄质榴辉岩的横波速度更低.Li和Lieberman(2007)、Liu 等(2009)利用橄榄石弹性波速和密度的测量结果得出:橄榄石在上地幔的体积分数为36%~58%才能较好地符合410 km的波速跳跃和波阻抗跳跃.这两种模型在解释地球物理资料中存在各自的优势和不足,因此,高温高压下地幔岩和苦橄质榴辉岩电导率的研究成为必要,可以帮助人们更好地了解上地幔的物质组成,检测两种地幔矿物模型存在的合理性.
电导率敏感于水、熔体、铁含量、温度和氧逸度等的变化.高温高压下岩石和矿物电导率的实验测量是解释电磁测深观测(Lastovickova,1991)和认识地球内部物质组成、状态、热结构和物质运动变化等的一种重要方法.目前压力对矿物和岩石电导率影响的研究结果很不一致,人们对矿物和岩石活化体积的约束还很模糊.本研究的另一目的就是通过测量这两种地幔矿物模型电导率随压力的变化特征,获得它们的活化体积,从而合理构建上地幔的一维电导率剖面,为解释高导层成因等提供参考.
由橄榄石、辉石、石榴子石组成的石榴子石/尖晶石二辉橄榄岩是上地幔的代表性岩石,其与地幔岩、苦橄质榴辉岩的成分类似,只是各矿物的含量不同,目前直接测量地幔岩和苦橄质榴辉岩电导率的研究几乎没有.Duba 和 Constable (1993)利用单频交流法测量了二辉橄榄岩的电导率,认为橄榄石组分不论单晶还是多晶,其组成岩石电导率相差不明显;代立东等(2005)测量了1.0~4.0 GPa压力下二辉橄榄岩的电导率,认为随着压力的增大电导率减小,而Wang等(2008)测量的其含水电导率随压力并无变化.Guo等(2014)测量了西藏地区榴辉岩的电导率,得出在45~100 km深度处电导率值为10-4.5~10-1.5S·m-1.Ohta等(2010a)测量了KLB-1橄榄岩在下地幔温度压力条件下的电导率值,构建了地幔电导率-深度剖面.Xu(2000a)以60%橄榄石、15%单斜辉石和25%斜方辉石的地幔岩作为研究地幔电导率的岩石,利用串联和并联方案、Hashin-Shtrikman边界法、有效介质法、几何平均法以及有效电导率法等地球物理模型来界定地幔的电导率范围,将有效介质法得到的电导率作为地幔电导率值,很好地吻合了地球物理观测结果.采用测量频率为10-1~106Hz的交流阻抗谱法,在1.0~4.0 GPa、700~1150 ℃的条件下,我们首次测量了地幔岩和苦橄质榴辉岩的电导率,构建了其一维电导率剖面,讨论了这两种矿物模型在上地幔存在的合理性.
2实验
2.1样品的制备
将粒径小于63 μm的粉末状橄榄石、辉石和石榴子石作为初始材料,由57%的橄榄石、29%的辉石和14%的石榴子石组成地幔岩,体积分数为40%的橄榄石、13%的石榴子石和47%的辉石组成苦橄质榴辉岩.全岩化学成分分析见表1.实验前,先使用精度为0.001 g的电子天平按质量百分比称出各矿物,然后放置到玛瑙研钵中混合研磨,为了使各个组分混合均匀、颗粒细腻,研磨时间都大于6 h.

表1 地幔岩和苦橄质榴辉岩全岩化学成分分析(%)
注:FeO*代表全铁. Fe#=Fe/(Mg+Fe), Fe用FeO*表示.

图1 实验样品组装图Fig.1 Schematic of the experimental assembly
2.2样品的组装和测量
高温高压实验是在中国科学院地球化学研究所地球内部物质高温高压重点实验室的YJ-3000t紧装式六面顶压机装置上完成的(谢鸿森等,1993).实验样品的组装装置如图1,将边长为32.5 mm的立方体叶腊石作为样品的传压介质,外径12.5 mm、内径9 mm、高20 mm的圆柱状氧化镁管作为外绝缘管,外径9 mm、内径6 mm、高18 mm的圆柱状氧化镁管作为内绝缘管.实验之前,将叶腊石、氧化镁管和叶腊石堵头等组件放进电阻炉加热到900 ℃,除去其中的吸附水和结晶水.本实验电极采用直径6 mm、厚度0.3 mm的Mo片,同时,也作为氧逸度缓冲剂,将样品的氧逸度控制在Mo-MoO2的水平.用双层不锈钢铁片作为样品的加热片,用NiCr-NiAl热电偶来测定样品的温度,样品温度测量的误差介于±5 ℃.
测量前,先把样品加压、加温到某一预计值(通常到973 K以上),然后保持恒定至少6 h,以便脱去样品及系统的吸附水,合成粒径小于45 μm的样品.电导率测量采用精度为0.05%的Solartron IS-1260阻抗/增益-相位分析仪.地幔岩和苦橄质榴辉岩的电导率按照升温—降温—升温循环次序来测量,温度梯度50 ℃、平衡时间30 min,以便让样品的内部结构达到稳定.每一个平衡温度下样品的测量频率都为10-1~106Hz.
3实验结果
3.1数据的处理
利用ZView程序绘制测量样品的交流阻抗谱,3.0 GPa、800~1000 ℃条件下第一次降温(实线)与第二次升温(虚线)过程中苦橄质榴辉岩的阻抗谱如图2所示,相同温度下样品第一次降温与第二次升温的阻抗谱相差不大,其他不同压力下苦橄质榴辉岩和地幔岩的情况与此类似,因此我们选择第一次降温曲线处理样品的电阻.图中明显的曲线值跳跃,都发生在频率7×10⁴Hz处,这是由仪器造成的,并不影响样品的电阻拟合值.样品的电阻从高频到低频有所不同,高频段为一个近似的半圆弧,而低频段为线段,而且随着温度的不同,高频段半圆弧的最低频率有所改变,温度越高最低频率越大.对于多晶矿物,高频段半圆弧代表样品颗粒内部的传导机制,中频段半圆弧代表颗粒边界的传导机制,低频段线段代表样品-电极的传导机制(Huebner and Dillenburg,1995;代立东等,2005),因此,图2中半圆弧代表颗粒内部的传导,其直径即为样品的电阻值,而低频线段可能代表样品-电极的传导(黄晓葛等,2008).
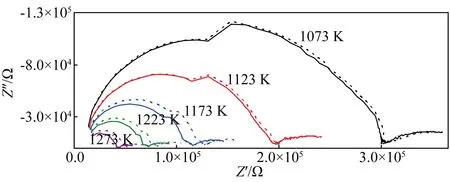
图2 3.0 GPa压力、800~1000 ℃温度下苦橄质榴辉岩阻抗谱图Fig.2 Impedance spectra of piclogite at 3.0 GPa, 800~1000 ℃
在ZView程序中利用一个电阻并联一个恒相元素(CPE)方法拟合样品的交流阻抗谱,得到样品的电阻值,通过公式(1)计算样品的电导率:
(1)
式中,σ代表样品的电导率,L代表圆柱状样品的长度,r代表圆形电极的半径,R代表拟合的样品电阻,其中长度L、半径r通过直接测量实验后样品的尺寸得到.
3.2电导率随温度和压力的变化

图3 1.0~4.0 GPa压力和700~1150 ℃温度下地幔岩和苦橄质榴辉岩lgσ与1000·T-1关系Fig.3 Logarithm of electrical conductivity versus reciprocal temperature for pyrolite and piclogite at 1.0~4.0 GPa, 700~1500 ℃
实验得出了地幔岩和苦橄质榴辉岩在700~1150 ℃、1.0~4.0 GPa条件下的电导率,图3列出了不同压力下电导率随温度的变化,地幔岩(黑线)的电导率介于10-4S·m-1和10-1S·m-1,而苦橄质榴辉岩(红线)的电导率约为10-4~10-2S·m-1.从图2和图3已知,随着温度的增加,地幔岩和苦橄质榴辉岩的电导率也增加,图3很好地显示出电导率的对数lgσ与温度的倒数1000/T呈线性关系,符合Arrenhius关系式:
(2)
其中,σ0为指前因子( S·m-1),ΔH为物质的活化焓(eV),ΔH=ΔU+PΔV,ΔU为物质的活化能(eV),P为相应的压力(GPa),ΔV为物质的活化体积(cm3·mol-1),k为玻尔兹曼常数(8.617×10⁻⁵eV·K-1),T为绝对温度(K).
表2列出了利用Arrenhius关系式拟合得到的各参数.随着压力的增加,地幔岩的电导率明显增加,它的活化体积为负值,为-4.73 cm3·mol-1,而苦橄质榴辉岩的电导率随压力的增加几乎没有变化,其活化体积值约为-0.11 cm3·mol-1.
4讨论
4.1传导机制
在实验的温压范围内,电导率的对数与温度的倒数呈直线关系(图3),说明地幔岩和苦橄质榴辉岩中主要有一种传导方式,为Fe2+、Fe3+之间的小极化子传导.Duba 和 Constable(1993)得出,温度700~1300 ℃范围内,小极化子Fe3+的缺陷在橄榄石电导率中占主导地位,为主要的传导方式.Yoshino(2010)总结了离子传导、小极化子传导和质子传导这三种传导方式的显微机制,离子传导的活化能一般大于2 eV,质子传导在含水物质中才是主要传导机制,而硅酸盐物质的小极化子传导活化能一般大于1 eV,这也符合我们的实验结果,地幔岩的活化能为1.14 eV,苦橄质榴辉岩的活化能为1.01 eV.对于小极化子传导,随着铁含量的变化,它的活化焓也会发生变化,铁含量越高,活化焓越低,这与Fe3+、Fe2+之间平均距离的减小有关(Yoshino,2010),也与电荷增加导致局部应力的减小有关(Katsura et al.,2009).
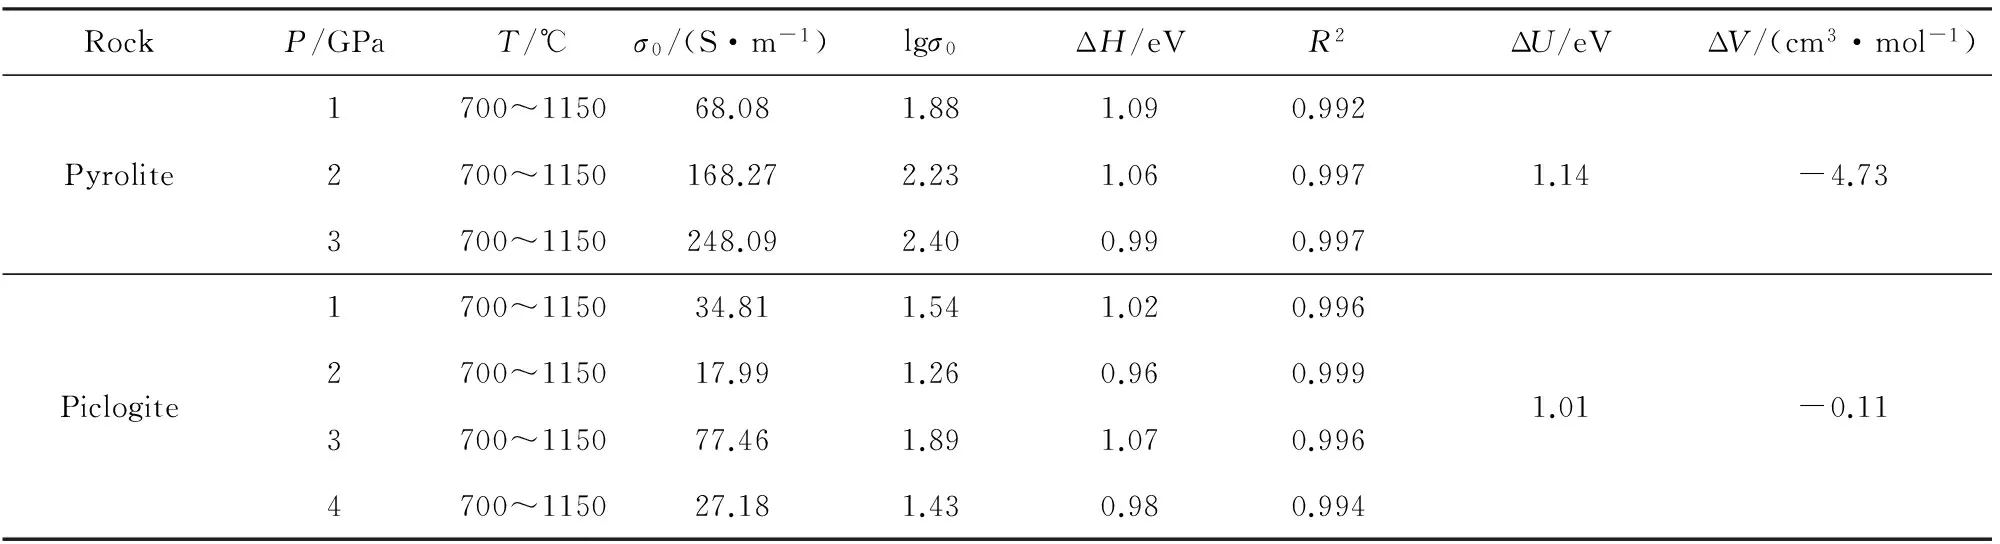
表2 地幔岩和苦橄质榴辉岩电导率Arrenhius关系式的拟合参数表
4.2压力对电导率的影响
从图3中可以看出,随着压力的增加,地幔岩的电导率增大,而苦橄质榴辉岩的电导率几乎没变化.关于矿物和岩石电导率随压力的变化,前人做过一些研究,但存在争议.Duba等(1974)测量了0.25~0.8 GPa下单晶橄榄石的电导率,得出随着压力的增大,橄榄石电导率几乎没有变化;Omura等(1989)在压力2.9~7.0 GPa、温度900~1900 K条件下,分别测得10%、28%、52%、76%和100%铁含量多晶橄榄石的电导率,即在一定温度范围内,铁含量高(>52%)时,橄榄石电导率随着压力的增加而增大;铁含量低时,橄榄石电导率随着压力的增大而变小.Xu等(2000b)测量了4.0~10.0 GPa、1000~1400 ℃条件下San Carlos橄榄石的电导率,认为其单晶和多晶电导率随压力的增加都减小,活化体积为0.6±0.6 cm3·mol-1,压力对电导率的影响可忽略.但是,Yoshino等(2012)测量了不同铁含量下橄榄石的电导率,得出无论铁含量高或低,橄榄石的活化体积都为负值,铁含量越高,负值的绝对值越大;钙钛矿(Goddat et al.,1999;Ohta et al.,2010b)和镁方铁矿(Yoshino et al.,2011)电导率也随着压力的增大而增加.
关于岩石电导率随压力的变化,Dai等(2008)测出,1.0~4.0 GPa压力下二辉橄榄岩的活化体积为正值,为0.04±0.01 cm3·mol-1;Wang等(2008)测得其0.0126%含水量的电导率随压力几乎没有变化;而龚超颖等(2011)测得其电导率随压力增大,但增幅不明显(图4).Guo等(2014)在压力1.5~3.5 GPa条件下测量了榴辉岩的电导率,得出在温度低于650 K时岩石的活化体积为-0.6±0.1 cm3·mol-1,温度大于650 K时活化体积为-1.2±0.2 cm3·mol-1.本次实验得出地幔岩的活化体积为-4.73 cm3·mol-1,而苦橄质榴辉岩的活化体积为-0.11 cm3·mol-1,它们的全岩Fe#相差很小,地幔岩为0.13,苦橄质榴辉岩是0.12,因此,这两种模型岩石电导率随压力的变化差异可排除铁含量的影响,但具体原因,需要进一步的研究.
4.3对比前人结果及其地球物理意义
前人虽然没有同时测量过地幔岩和苦橄质榴辉岩的电导率,但对组成这些岩石的矿物以及类似的岩石做过一些研究,图4给出了本研究获得的两种地幔矿物模型电导率与前人部分工作的比较.
实验得到苦橄质榴辉岩的电导率和龚超颖等(2011)测得二辉橄榄岩的电导率相似,在700~1150℃温度下电导率为10-4~10-2S·m-1;但与代立东等(2005)和Wang等(2008)所测得电导率相差较大,可达1.5个数量级.地幔岩的电导率与上述测量的电导率相差较大,并且随着压力的增大差值增大,最高可达2个数量级.Wang等(2006)通过测得不同含水量橄榄石的电导率,估算了大洋软流圈(100~200 km)的水含量为0.008%,他们0.01%含水量的实验结果与我们在3.0 GPa下地幔岩的实验结果基本吻合.同时,本次利用有效介质法,计算了由75%橄榄石(数据来自Wang等(2006))和25%无水顽火辉石(数据来自Zhang等(2012))组成的地幔岩石电导率,其中,橄榄石和顽火辉石组成的无水岩石电导率明显低于我们回归常压下的地幔岩电导率,却与Xu等(2000b)回归常压下的电导率基本一致,而0.01%含水量橄榄石和无水顽火辉石合成的岩石电导率值与2.0GPa压力下地幔岩的电导率相符,因此,利用各矿物简单几何计算的岩石电导率可能低于其真实电导率,即各矿物电导率组合计算只能粗略的估计相应岩石电导率.由于橄榄石是组成两种地幔矿物模型中含量最多的矿物,因此,图4中也列出了部分橄榄石电导率随温度的变化.Xu等(2000b)和Wang等(2006)在4GPa下测得的无水San Carlos多晶橄榄石电导率相吻合,而Yoshino等(2009)在10GPa下测得的其电导率值略高,无水条件下,压力似乎对多晶橄榄石的电导率影响很小,这与我们实验中地幔岩随压力变化的情况有很大不同.
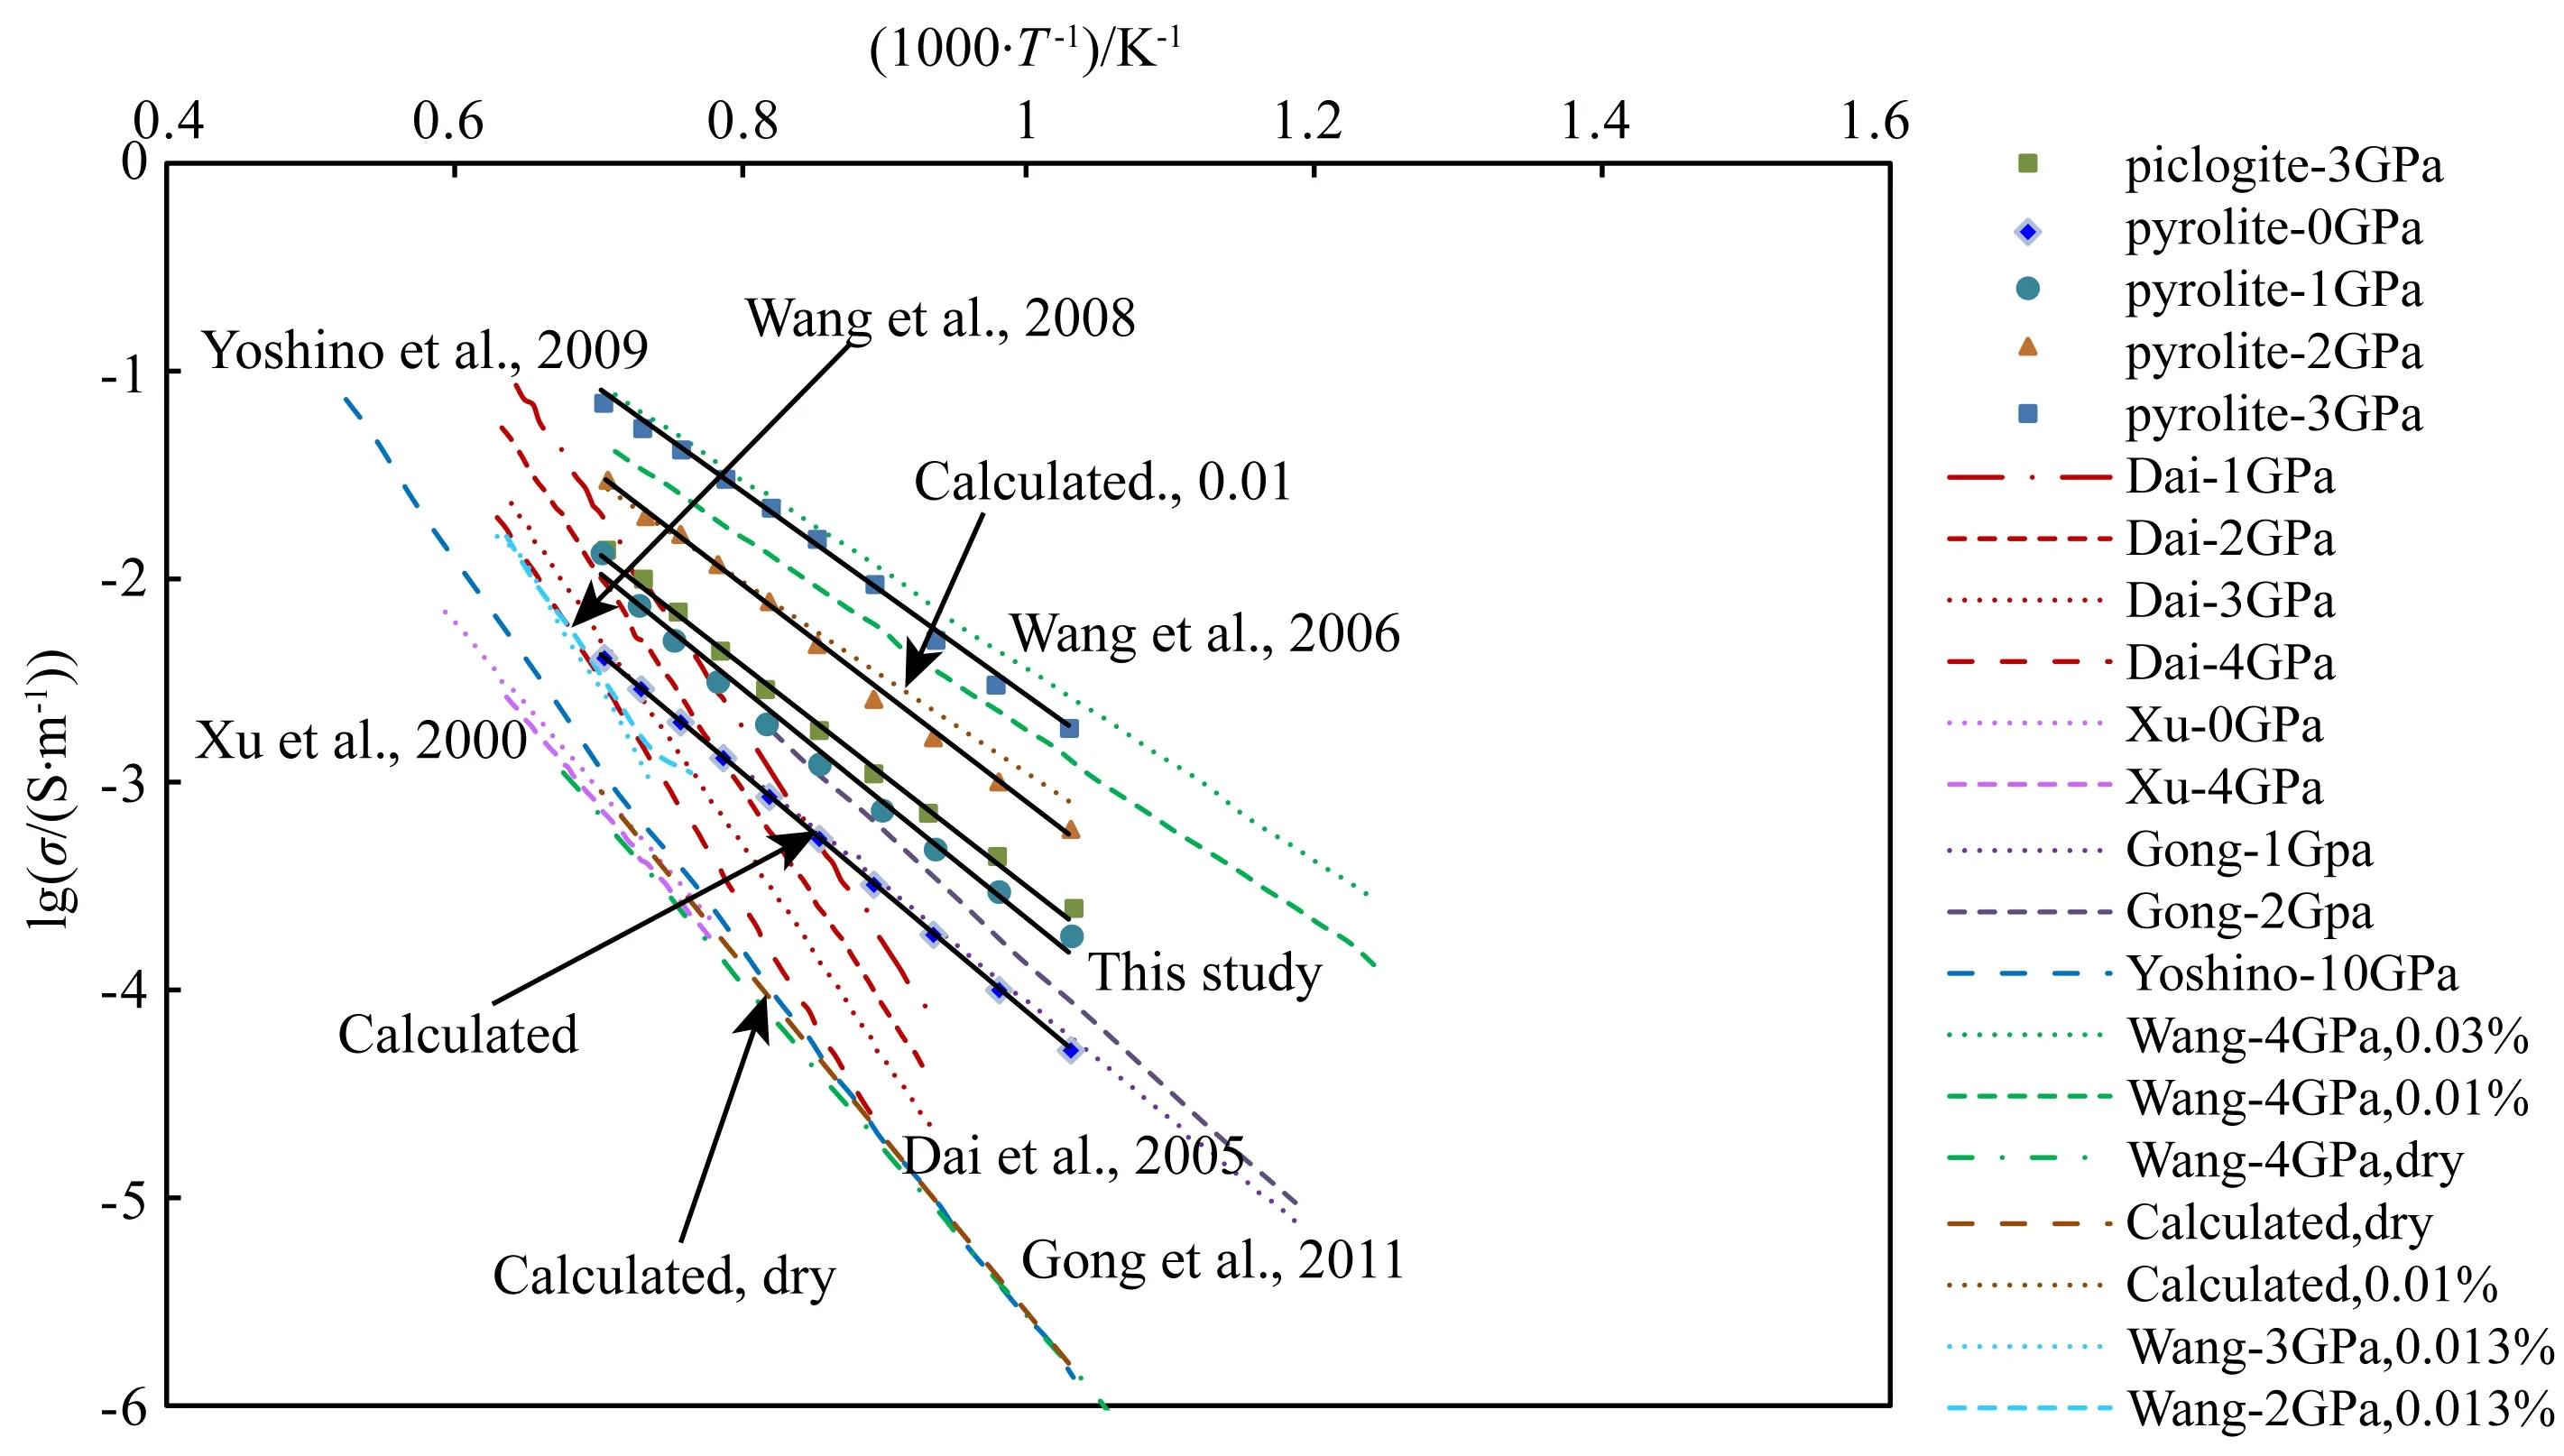
图4 高温高压下我们的电导率实验与前人的对比黑线是本次的实验结果,棕色虚线表示我们的理论计算值,红线、紫线和天蓝色是代立东等(2005)、龚超颖等(2011)和Wang等(2008)测量的二辉橄榄岩电导率的结果,粉红线、蓝线和绿线表示Xu等(2000b)、Yoshino等(2009)和Wang等(2006)测量的橄榄石结果.Fig.4 Comparison between our results and previous results of electric conductivity at high pressure and high temperatureThe black, brown lines are experimental and theoretical calculation results of this study. Dai et al. (2005) , Gong et al. (2011) and Wang et al. (2008) measure the electrical conductivity of lherolite represent by the red, purple and azure doshed lines. The pink, blue and green lines denote the result of olivine measured by Xu et al.(2000b), Yoshino et al.(2009) and Wang et al. (2006).
我们利用拟合的参数将地幔岩和苦橄质榴辉岩的电导率外推到240 km.其中在120 km以下,利用地幔岩活化体积外推得到的电导率值远高于大多数地球物理探测获得的结果,如果不考虑压力影响,得到的外推结果与电磁测量的数据基本一致,因此,100 km深度后外推忽略了活化体积的影响.本实验获得的一维电导率-深度剖面与其他理论计算模型及太平洋地区和菲律宾海的电磁测量结果对比如图5所示.
上地幔顶部(约100 km)地幔岩的电导率(图5)约10-4~10-1S·m-1,苦橄质榴辉岩约10-4~10-2S·m-1;在相同的地热下,随深度的加深地幔岩电导率大于苦橄质榴辉岩电导率,这与地幔岩电导率随压力的增大有关;而且两种上地幔矿物模型的电导率值基本上位于参考地区的电导率之间,它们的变化趋势与太平洋、菲律宾海以及理论计算的变化相似,从地表到深部都是先迅速增加然后变缓慢;但是电导率的横向差异很大,可达2个数量级,这可能与上地幔顶部物质较大的横向异性和构造的不均匀性有关.为了更好地解释地幔矿物模型的合理性,我们将地幔岩和苦橄质榴辉岩的电导率外推到240 km.已知大洋软流圈电导率值约10-1S·m-1,Wang等(2006)得出了其含水量为0.008%,其电导率-深度曲线(图5中W-0.01%所示)与大洋地热对应的苦橄质榴辉岩的电导率接近,但Zhang等(2012)(图5中Z-0.01%所示)理论计算结果与之相比偏小;虽然大洋地热对应的地幔岩电导率偏大,但在软流圈内它的电导率值也约为10-1S·m-1.再结合Partzsch等(2000)在前人基础上得出的部分地区电导率二维剖面,其中智利北部地区在80 km深度以内的正常电导率为0.005 S·m-1,80~100 km为0.01 S·m-1;在110 km以内,比利牛斯山的正常电导率为0.0003 S·m-1,这都与我们测得的电导率相近.因此,电性方面利用苦橄质榴辉岩和地幔岩来代表上地幔的物质也是基本可行的;在深部,用苦橄质榴辉岩来解释更为合理;在浅部,地幔岩可能更好一些,但浅部物质的分布不均匀,电导率随深度的变化主要受控于温度的影响,其次才是成分.

图5 两种地幔矿物模型与理论计算和不同地区电磁测量结果的电导率-深度对比剖面黑线和红线是根据Clark等(1964)地盾地热(对应虚线)和大洋地热(对应实线)得到的地幔岩和苦橄质榴辉岩的电导率剖面,深蓝色虚线表示利用Wang等(2006)测量数据计算的电导率值,绿线代表Zhang等(2012)将含铝顽火辉石和橄榄石利用有效介质模型理论计算的结果,浅蓝线和紫线是Utada等(2003)在北太平洋、Baba等(2010)在菲律宾海和太平洋电磁测量的结果.Fig.5 Laboratory-based conductivity-depth profiles on pyrolite and piclogite compared with the effective medium model and the previously electromagnetic data beneath the different regions in the mantle Black and red lines are conductivity-depth profies of this study based on shield (dashed) and ocean (solid) geotherm calculated by Clark et al.(1964). Dark blue lines denote computed results from the conductivity data of olivine measured by Wang et al.(2006). Zhang et al.(2012) (green lines) calculates the electrical conductivity of upper mantle from the present data for Al-bearing enstatite and olivine using the effective medium model. Light blue and purple lines show the results of electromagnetic measurement in the North Pacific studied by Utada et al.(2003) and in the Philipoine Sea and Pacific studied by Baba et al.(2010).
5结论
利用YJ-3000t紧装式六面顶压机和Solartron IS-1260阻抗/增益-相位分析仪,在1.0~4.0 GPa、700~1150 ℃的条件下,采用交流阻抗谱法分别测量了两种地幔矿物模型所对应的岩石——地幔岩和苦橄质榴辉岩的电导率,结论如下:
(1) 在700~1150 ℃温度、1.0~4.0 GPa压力下,地幔岩和苦橄质榴辉岩的电导率随着温度的上升而增加,电导率的对数lgσ与温度的倒数1000·T-1呈线性关系,符合Arrenhius关系式,其中地幔岩的指前因子σ0为68.08~248.09 S·m-1,活化能ΔU为1.14 eV,苦橄质榴辉岩的指前因子σ0为17.99~77.46 S·m-1,活化能ΔU为1.01 eV.
后混合式高压水磨料射流特点是磨料对高压水喷嘴的磨损较轻,可连续作业;但磨料颗粒的速度较低且浓度分布不均匀,明显降低了水介质对磨料的能量传输效率,而且只能使用干磨料[9]。
(2) 随着压力的增加,地幔岩的电导率增加,活化体积为-4.73 cm3·mol-1,而苦橄质榴辉岩的电导率几乎没有变化,活化体积为-0.11 cm3·mol-1.
(3) 在温度1150 ℃、压力3.0 GPa下,地幔岩的电导率约为10-1S·m-1,大于苦橄质榴辉岩的电导率10-2S·m-1,其原因可能是地幔岩含有较多的铁和镁.
(4) 结合部分地区的电磁测量和理论计算结果,得出地幔岩、苦橄质榴辉岩的电导率与地球物理探测的结果基本一致.因此,电性方面苦橄质榴辉岩和地幔岩来代表上地幔的物质基本可行;在深部,用苦橄质榴辉岩来解释更为合理;在浅部,地幔岩可能更恰当,但浅部物质的分布不均匀,电导率随深度的变化主要受控于温度的影响,其次才是成分.致谢本实验完成于中国科学院地球化学研究所地球内部物质高温高压重点实验室,期间,得到了周文戈、朱成明研究员的悉心指导和帮助,在此深表谢意.
References
Anderson D L, Bass J D. 1984. Mineralogy and composition of the upper mantle.GeophysicalResearchLetters, 11(7): 637-640.
Anderson D L, Bass J D. 1986. Transition region of the Earth′s upper mantle.Nature, 320(6060): 321-328.
Baba K, Utada H, Goto T N, et al. 2010. Electrical conductivity imaging of the Philippine Sea upper mantle using seafloor magnetotelluric data.PhysicsoftheEarthandPlanetaryInteriors, 183(1-2): 44-62.Clark S P, Ringwood A E. 1964. Density distribution and constitution of the mantle.ReviewsofGeophysics, 2(1): 35-88.Dai L D, Li H P, Deng H M, et al. 2008. In-situ control of different oxygen fugacity experimental study on the electrical conductivity of lherzolite at high temperature and high pressure.JournalofPhysicsandChemistryofSolids, 69(1): 101-110.Dai L D, Li H P, Liu C Q, et al. 2005. Experimental study on impedance spectra of lherzolite under high temperature and high pressure.ChineseJournalofHighPressurePhysics(in Chinese), 19(1): 29-34.
Duba A, Constable S. 1993. The electrical conductivity of lherzolite.JournalofGeophysicalResearch, 98(B7): 11885-11899.
Duba A, Heard H C, Schock R N. 1974. Electrical conductivity of olivine at high pressure and under controlled oxygen fugacity.JournalofGeophysicalResearch, 79(11): 1667-1673.
Duff T S, Anderson D L. 1989. Seismic velocities in mantle minerals and the mineralogy of the upper mantle.JournalofGeophysicalResearch, 94(B2): 1895-1912.
Goddat A, Peyronneau J, Poirier J P. 1999. Dependence on pressure of conduction by hopping of small polarons in minerals of the Earth′s lower mantle.PhysicsandChemistryofMinerals, 27(2): 81-87.
Gong C H Y, Liu Y G, Li P, et al. 2011. Comparison of measurement methods for electrical conductivity of rocks under high pressure and high temperature: taken the lherzolite as an example.ActaGeologicaSinica(in Chinese), 85(3): 343-353.
Guo Y X, Wang D J, Shi Y L, et al. 2014. The electrical conductivity of eclogite in Tibet and its geophysical implications.ScienceChinaEarthSciences, 57(9): 2071-2078.Huang X G, Bai W M, Zhou W G. 2008. Experimental study on electrical conductivity of biotite- and plagioclase- bearing gneiss at high temperature and high pressure.ChineseJournalofHighPressurePhysics(in Chinese), 22(3): 237-244.Huebner J S, Dillenburg R G. 1995. Impedance spectra of hot, dry silicate minerals and rocks: qualitative interpretation of spectra.AmericanMineralogist, 80(1-2): 46-64.Irifune T, Higo Y, Inoue T, et al. 2008. Sound velocities of majorite garnet and the composition of the mantle transition region.Nature, 451(7180): 814-817.
Ita J, Stixrude L. 1992. Petrology, elasticity, and composition of the mantle transition zone.JournalofGeophysicalResearch, 97(B5): 6849-6866.
Katsura T, Yoshino T, Manthilake G, et al. 2009. Electrical conductivity of the major upper mantle minerals: a review.RussianGeologyandGeophysics, 50(12): 1139-1145.

Li B S, Lieberman R C. 2007. Indoor seismology by probing the Earth′s interior by using sound velocity measurements at high pressures and temperatures.ProceedingsoftheNationalAcademyofSciencesoftheUnitedStatesofAmerica, 104(22): 9145-9150.Liu W, Kung J, Li B S, et al. 2009. Elasticity of (Mg0.87Fe0.13)2SiO4wadsleyite to 12 GPa and 1073 K.PhysicsoftheEarthandPlanetaryInteriors, 174(1-4): 98-104.
Ohta K, Hirose K, Ichiki M, et al. 2010a. Electrical conductivities of pyrolitic mantle and MORB materials up to the lowermost mantle conditions.EarthandPlanetaryScienceLetters, 289(3-4): 497-502.
Ohta K, Hirose K, Shimizu K, et al. 2010b. The electrical resistance measurements of (Mg, Fe)SiO3perovskite at high pressures and implications for electronic spin transition of iron.PhysicsoftheEarthandPlanetaryInteriors, 180(3-4): 154-158.
Omura K, Kurita K, Kumazawa M. 1989. Experimental study of pressure dependence of electrical conductivity of olivine at high temperatures.PhysicsoftheEarthandPlanetaryInteriors, 57(3-4): 291-303.
Partzsch G M, Schiling F R, Arndt J. 2000. The influence of partial melting on the electrical behavior of crustal rocks: laboratory examinations, model calculations and geological interpretations.Tectonophysics, 317(3-4): 189-203.Ringwood A E. 1962. A model for the upper mantle.JournalofGeophysicalResearch, 67(2): 857-867.
Ringwood A E. 1975. Composition and Petrology of the Earth′s Mantle. New York: McGraw-Hill.
Utada H, Koyama T, Shimizu H, et al. 2003. A semi-global reference model for electrical conductivity in the mid-mantle beneath the North Pacific region.GeophysicalResearchLetters, 30(4): 263-276.Wang D J, Mookherjee M, Xu Y S, et al. 2006. The effect of water on the electrical conductivity of olivine.Nature, 443(7114): 977-980, doi :10.1038/nature05256.
Wang D J, Li H P, Yi L, et al. 2008. The electrical conductivity of upper-mantle rocks: water content in the upper mantle.PhysicsandChemistryofMinerals, 35(3): 157-162.
Xie H S, Zhang Y M, Xu H G, et al. 1993. A new method of measurement for elastic wave velocities in minerals and rocks at high temperature and high pressure and its significance.ScienceinChinaSerB, 36(10): 1276-1280.
Xu Y S, Shankland T J, Poe B T. 2000a. Laboratory-based electrical conductivity in the Earth′s mantle.JournalofGeophysicalResearch, 105(B12): 27865-27875.
Xu Y S, Shankland T J, Duba A G. 2000b. Pressure effect on electrical conductivity of mantle olivine.PhysicsoftheEarthandPlanetaryInteriors, 118(1-2): 149-161.
Yoshino T, Matsuzaki T, Shatskiy A, et al. 2009. The effect of water on the electrical conductivity of olivine aggregates and its implications for the electrical structure of the upper mantle.EarthandPlanetaryScienceLetters, 288(1-2):291-300.
Yoshino T. 2010. Laboratory electrical conductivity measurement of mantle minerals.SurveysinGeophysics, 31(2): 163-206.
Yoshino T, Ito E, Katsura T, et al. 2011. Effect of iron content on electrical conductivity of ferropericlase with implications for the spin transition pressure.JournalofGeophysicalReseach, 116(116):99-108, doi: 10. 1029/2010JB007801.
Yoshino T, Shimojuku A, Shan S M, et al. 2012. Effect of temperature, pressure and iron content on the electrical conductivity of olivine and its high-pressure polymorphs.JournalofGeophysicalResearch, 117(B8),doi: 10. 1029/20011JB008774.Zhang B H, Yoshino T, Wu X P, et al. 2012. Electrical conductivity of enstatite as a function of water content: implications for the
electrical structure in the upper mantle.EarthandPlanetaryScienceLetters, 357-358: 11-20.
附中文参考文献
代立东, 李和平, 刘丛强等. 2005. 高温高压下二辉橄榄岩的阻抗谱实验研究. 高温物理学报, 19(1): 29-34.
龚超颖, 刘永刚, 李朋等. 2011. 高温高压下岩石电导率不同测量方法的实验对比—以二辉橄榄岩为例. 地质学报, 85(3): 343-353.
黄晓葛, 白武明, 周文戈. 2008. 高温高压下黑云斜长片麻岩的电性研究. 高压物理学报, 22(3): 237-244.
谢鸿森, 张月明, 徐惠刚等. 1993. 高温高压下测量岩石矿物波速的新方法及其意义. 中国科学(B辑), 23(8): 861-864.
(本文编辑汪海英)
基金项目国家自然科学基金项目(41174074)资助.
作者简介王欣欣,女,1990年生,在读硕士研究生,主要从事高温高压矿物岩石电导率实验研究.E-mail:wangxx1232@163.com *通讯作者黄晓葛,女,副研究员,主要研究方向为岩石物理学.E-mail:xghuang@mail.igcas.ac.cn
doi:10.6038/cjg20160219 中图分类号P312
收稿日期2015-05-06,2015-12-21收修定稿
Experimental study on electrical conductivity of pyrolite and piclogite at high temperature and high pressure
WANG Xin-Xin1,2,HUANG Xiao-Ge1*,BAI Wu-Ming1
1KeyLaboratoryofEarthandPlanetaryPhysics,InstituteofGeologyandGeophysics,ChineseAcademyofSciences,Beijing100029,China2UniversityofChineseAcademyofSciences,Beijing100049,China
AbstractMeasurements of electrical conductivity for rocks and minerals at high temperature and high pressure provide a powerful tool to acquire information about chemical and mineralogical composition of the Earth′s interior. Based on physical properties of minerals and rocks such as density, and elastic-wave velocity, Ringwood and Anderson & Bass proposed two competing mineralogical models of the mantle: pyrolite model and piclogite model. In order to investigate electrical structure of the upper mantle and the rationality of these two models, the electrical conductivities were measured using YJ-3000t multi-anvil apparatus and Solartron-1260 impedance/Gain-Phase analyzer under conditions of 1.0~4.0 GPa, 700~1150 ℃ and 10-1~106 Hz frequency ranges.
The experimental results show that the electrical conductivities significantly increase with temperature. The linear relationship between Lgσand 1/Tindicates that they follow an Arrhenius formula and the small polaron model is the dominant conduction mechanism. The pre-exponential factorσ0and the activation energy ΔUhave been obtained in the setting range. They are respectively 68.08~248.09 S·m-1and 1.14 eV for pyrolite; 17.99~77.46 S·m-1and 1.01 eV for piclogite. With increasing pressure, the electrical conductivities of pyrolite slightly increase, while those of piclogite almost do not change. If pressure effects on conductivity of pyrolite and piclogite are expressed as the activation volume ΔVin the Arrhenius equation, they yield values of order of magnitude -4.73 cm3·mol-1and -0.11 cm3·mol-1, respectively. So far, researchers have not yet formed a unified understanding about the reason of positive and negative ΔV. The conductivity-depth profiles have been established by using our experimental results and geothermal gradients. Comparing our results with the previous electromagnetic data beneath the different regions in the mantle, the reasonability of the pyrolite model and the piclogite model are discussed. In the aspect of conductivity, the piclogite model is more reasonable for explaining deep geophysical field data than the pyrolite model. The conductivities of shallow part of upper mantle are primarily controlled by the temperature,followed by composition.
KeywordsElectrical conductivity; Pyrolite; Piclogite; High temperature and high pressure
王欣欣, 黄晓葛, 白武明. 2016. 高温高压下地幔岩和苦橄质榴辉岩的电导率实验.地球物理学报,59(2):624-632,doi:10.6038/cjg20160219.
Wang X X, Huang X G, Bai W M. 2016. Experimental study on electrical conductivity of pyrolite and piclogite at high temperature and high pressure.ChineseJ.Geophys. (in Chinese),59(2):624-632,doi:10.6038/cjg20160219.
