Inversion of 3D density interface with PSO-BP method
2016-07-15ZHANGDaileiandZHANGChong
ZHANG Dailei and ZHANG Chong
CollegeofGeo-ExplorationScienceandTechnology,JilinUniversity,Changchun130026,China
Inversion of 3D density interface with PSO-BP method
ZHANG Dailei and ZHANG Chong
CollegeofGeo-ExplorationScienceandTechnology,JilinUniversity,Changchun130026,China
Abstract:BP (Back Propagation) neural network and PSO (Particle Swarm Optimization) are two main heuristic optimization methods, and are usually used as nonlinear inversion methods in geophysics. The authors applied BP neural network and BP neural network optimized with PSO into the inversion of 3D density interface respectively, and a comparison was drawn to demonstrate the inversion results. To start with, a synthetic density interface model was created and we used the proceeding inversion methods to test their effectiveness. And then two methods were applied into the inversion of the depth of Moho interface. According to the results, it is clear to find that the application effect of PSO-BP is better than that of BP network. The BP network structures used in both synthetic and field data are consistent in order to obtain preferable inversion results. The applications in synthetic and field tests demonstrate that PSO-BP is a fast and effective method in the inversion of 3D density interface and the optimization effect is evident compared with BP neural network merely, and thus, this method has practical value.
Key words:inversion; 3D density interface; Moho interface; BP neural network; particle swarm optimization
1Introduction
The inversion of density interface is of vital significance in the exploration of oil and the survey of geological structures. Among the methods applied in the inversion of density interface, BP neural network has achieved preferable results of 2D interface. However, when it comes to 3D interface, the speed of convergence and inversion accuracy of BP network would decrease due to more complicated models and more parameters. Particle swarm optimization is used to optimize the method of BP network (an abbreviation PSO-BP will be used in this paper) in order to get better inversion results of 3D density interface.
Some heuristic inversion methods have been applied more often with the developments of both geophysics and computer techniques, such as artificial neural networks, genetic algorithm, simulated annealing and particle swarm optimization, etc. Among which, BP neural network is the most frequently used method and it is commonly used in the inversion of density interface (Zhuetal., 1995; Van der Baan & Jutten, 2000). In the process of inversion, the observed gravity anomaly is taken as input of the network and the depth of the density interface as output of the network. At the beginning of network training, a set of input and output pairs should be chosen among all the samples and which are required to be typical to some degree. The points with known depth in seismic profile are usually used as training samples in real application.
The key step in the process of network training is the iterative calculation of weights and thresholds (Van der Baan & Jutten, 2000). The traditional methods of the calculation include steepest descent method, conjugate gradient and quasi-Newton method, etc. It is easy for the training process to convergent slowly and get trapped into local minimum when these methods are applied. So particle swarm optimization is used in this paper because of its rapid convergence to the global optimum (Eberhart & Kennedy, 1995; Eberhart & Shi, 2001; Liuetal., 2004; Zhangetal., 2007; Renetal., 2014).
Particle swarm algorithm optimizes a problem by having a population of candidate solutions, here dubbed particles, and moving these particles around in the search-space according to simple mathematical formulae over the particle's position and velocity. When applied with BP network, particle swarm algorithm optimizes the initialization of weights and thresholds in the process of the network training. This paper starts with a short introduction to BP neural network and particle swarm algorithm and explains the specific way to optimize BP network with particle swarm algorithm (Eberhart & Shi, 2001; Boeringeretal., 2004).
2Theory
2.1BP neural network
BP network is a kind of feed forward neural network. Its basic structure includes input layer, hidden layer and output layer. A three-layer-structure with only one hidden layer is generally adequate to solve a majority of nonlinear problems. The basic principle used in BP network is back propagation of error, which is the difference between real output and expected output of the network. And the error,Eis also the objective function, which is minimized through the adjustment of weights and thresholds. The main steps of the calculation process are as follows:
Calculate error of output node
(1)
where Okand Tkare the real output and target output of the k th output node, respectively.
Change the weights and thresholds of output layer
(2)
where wkjis the weight between the k th output node and the j th hidden node, bkis the threshold of the k th output node, Ojis output of the j th hidden node. The constant η (called the learning rate) is put in to speed up or slow down the learning process if required. Commonly, the value of η is selected between 0 and 1.
Calculate (back-propagation) hidden layer error
(4)
Change the weights and thresholds of hidden layer
where wjiand bjare defined the same as above, and Iiis input of i th input node.
The Sigmoid function is commonly used as transfer function. The total error E equals the sum of δkand decreases with the iterative modification of weights and thresholds. It is the calculation of weights and thresholds that can be optimized with particle swarm algorithm.
2.2Particle swarm optimization
Particle swarm optimization is an algorithm that simulates the foraging behavior of birds. Assuming the searching space is D-dimensional and a particle swarm consists of M particles. The position of the particlei
(7)
is a potential solution of the optimization. Each particle keeps track of its coordinates in the problem space which are associated with the best solution (fitness) it has achieved. The fitness valuepbest
(8)
is stored and each potential solution is assigned a randomized velocity
(9)
The overall best valuegbestof the particle swarm is
(10)
The process for implementing particle swarm algorithm is as follows (Eberhart, 2001):
Initialize a population of particles with random positions and velocities onddimension in the problem space.
For each particle, evaluate the desired optimization fitness function indvariables.
Compare particle’s fitness evaluation withpbest. The better value will set to a newpbest.
Compare fitness evaluation withgbest, also the better value will set to a newgbest.
Change the velocity and position of the particle according to the following equations:

2.3Application of PSO-BP
In this paper, the global searching of particle swarm algorithm is adopted for the optimum weights and thresholds instead of BP itself. An overall workflow of PSO-BP model is shown in Fig.1 and the procedure is as follows (Zhao, 2012):
Normalize the training samples and test samples into [0, 1].
Define the structure of BP network on the basis of input samples and output samples.
Initialize parameters m, n, w, c1,c2, where:
m: number of population,
n: number of generation,
the velocity and position of each particle are initialized randomly.
The velocity and position of each particle are updated according to equations (11) and (12).
Fitness of each particle is evaluated and the mean square error (MSE) of BP network is used as the fitness function of searching the optimum solution.
The individual best position and the global position are updated.
The algorithm is stopped if the maximum iteration or the optimum solution is acquired, else return to step 4.
The process of optimization is that of the training of weights and thresholds. On the basis of the optimization of PSO algorithm, BP neural network is utilized to search the overall solution space and then achieve the expected goal. The error of BP network, that is to say ∑δk, is used as the evaluation function of particle swarm optimization. And this is another solution space in which some positions of the particles exist and the optimum position is among them. Each potential solution in the space is assigned a random velocity. Each particle keeps track of its coordinates in the problem space which are connected with the optimal solution (Eberhart & Shi, 2001). The optimum solution of particle swarm algorithm is just the optimum weights and thresholds for BP network. After training, the model of BP network can be stored and used later for the inversion of gravity data.
3Test on synthetic model
In this section, the method of BP neural network and BP network based on particle swarm algorithm were applied into a synthetic model of 3D density interface, respectively. The model is shown in Fig.2. The area has an extent of 51×51 km2and the square grid interval is 1 km. The density contrast is 0.4 g/cm3(lower density minus upper density). Square region method (Zeng, 2004) was used when calculating the gravity anomaly produced by this interface, and the edge was expanded to avoid edge effect when carrying on forward calculation (Li,etal., 2014; Li & Wu, 2014).
According to the workflow demonstrated in the above section, training samples are selected from the data of depth of the model and the gravity anomaly calculated. Usually, some points on a row or a column will be selected and which are regarded as training samples. The profile should traverse both the valleys and the peaks of topography as many as possible in order to make the training samples representative. An optimal model of BP network will be obtained and then it should be stored for the ensuing inversion calculation.
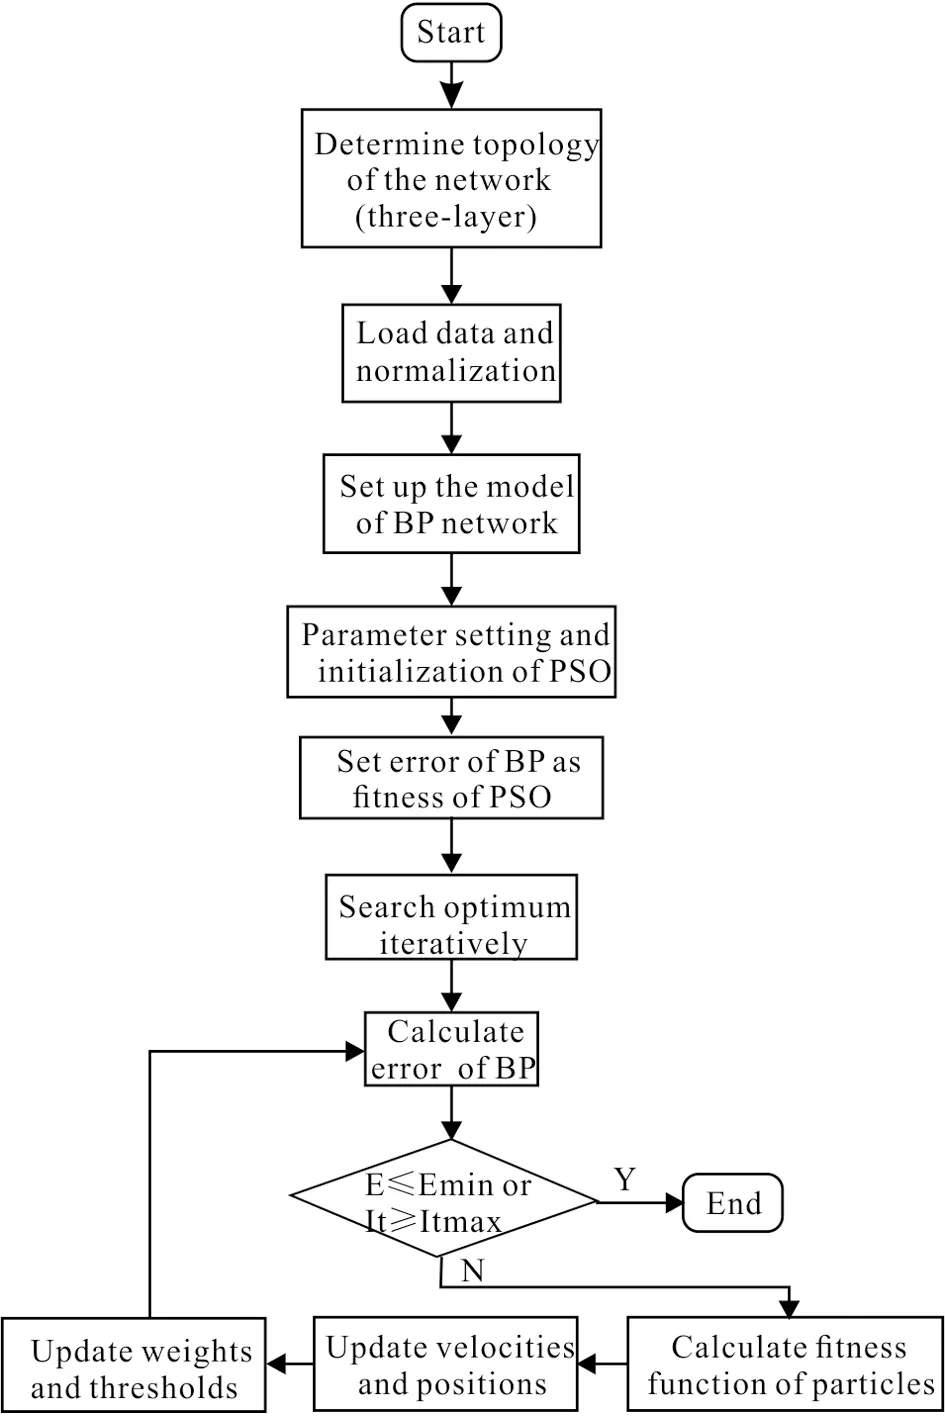
Fig.1 Flow chart of PSO-BP model
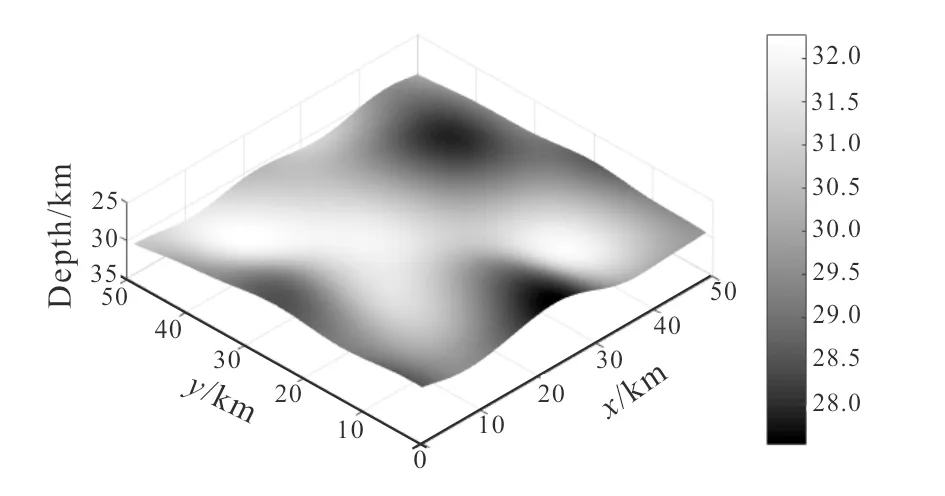
Fig. 2 Model of density interface
In this paper, the topology of BP network is a three-layer structure with one input node, five hidden nodes and one output node, respectively. Other parameters are set as below: η=0.1 , w=1, c1=c2=1.4, v is within [-1, 1], x is within [-5, 5], the maximum generation is 100 and the population of particles is 30. These specific values were selected on the basis of existing experience and repeated simulated calculation. In order to test the inversion ability of the proposed method when noise exists, Gaussian white noise was added to the forward gravity anomaly. With the addition of random noise, as shown in Fig.3b, the SNR (signal-to-noise ratio) is about 13 and the corresponding ratio of effective power is 20 according to the following formula:
SNR=10×lg(Ps/Pn)
(13)
Inversion results and the comparison of inversion effect of two methods are shown in Fig.3 and Fig.4. As shown in Fig. 3a is the contour map of depth of the synthetic density interface, Fig.3b is the contour map of gravity anomaly calculated from the model and it is evident that the contour lines are distorted as noise added. The submap Fig.3c and Fig.3d denotes inversion result of BP and PSO-BP method, respectively. In Fig.4, a comparison of the prediction error, which was estimated through the difference between inversion depth and model depth with 120 randomly chosen points, is drawn. It can be observed that both the two methods can obtain good results, and the result of PSO-BP is more accurate and reveals more details, for example the peak value and the valley value in the middle bottom. In addition, PSO-BP method demonstrates stronger capability to withstand noise.
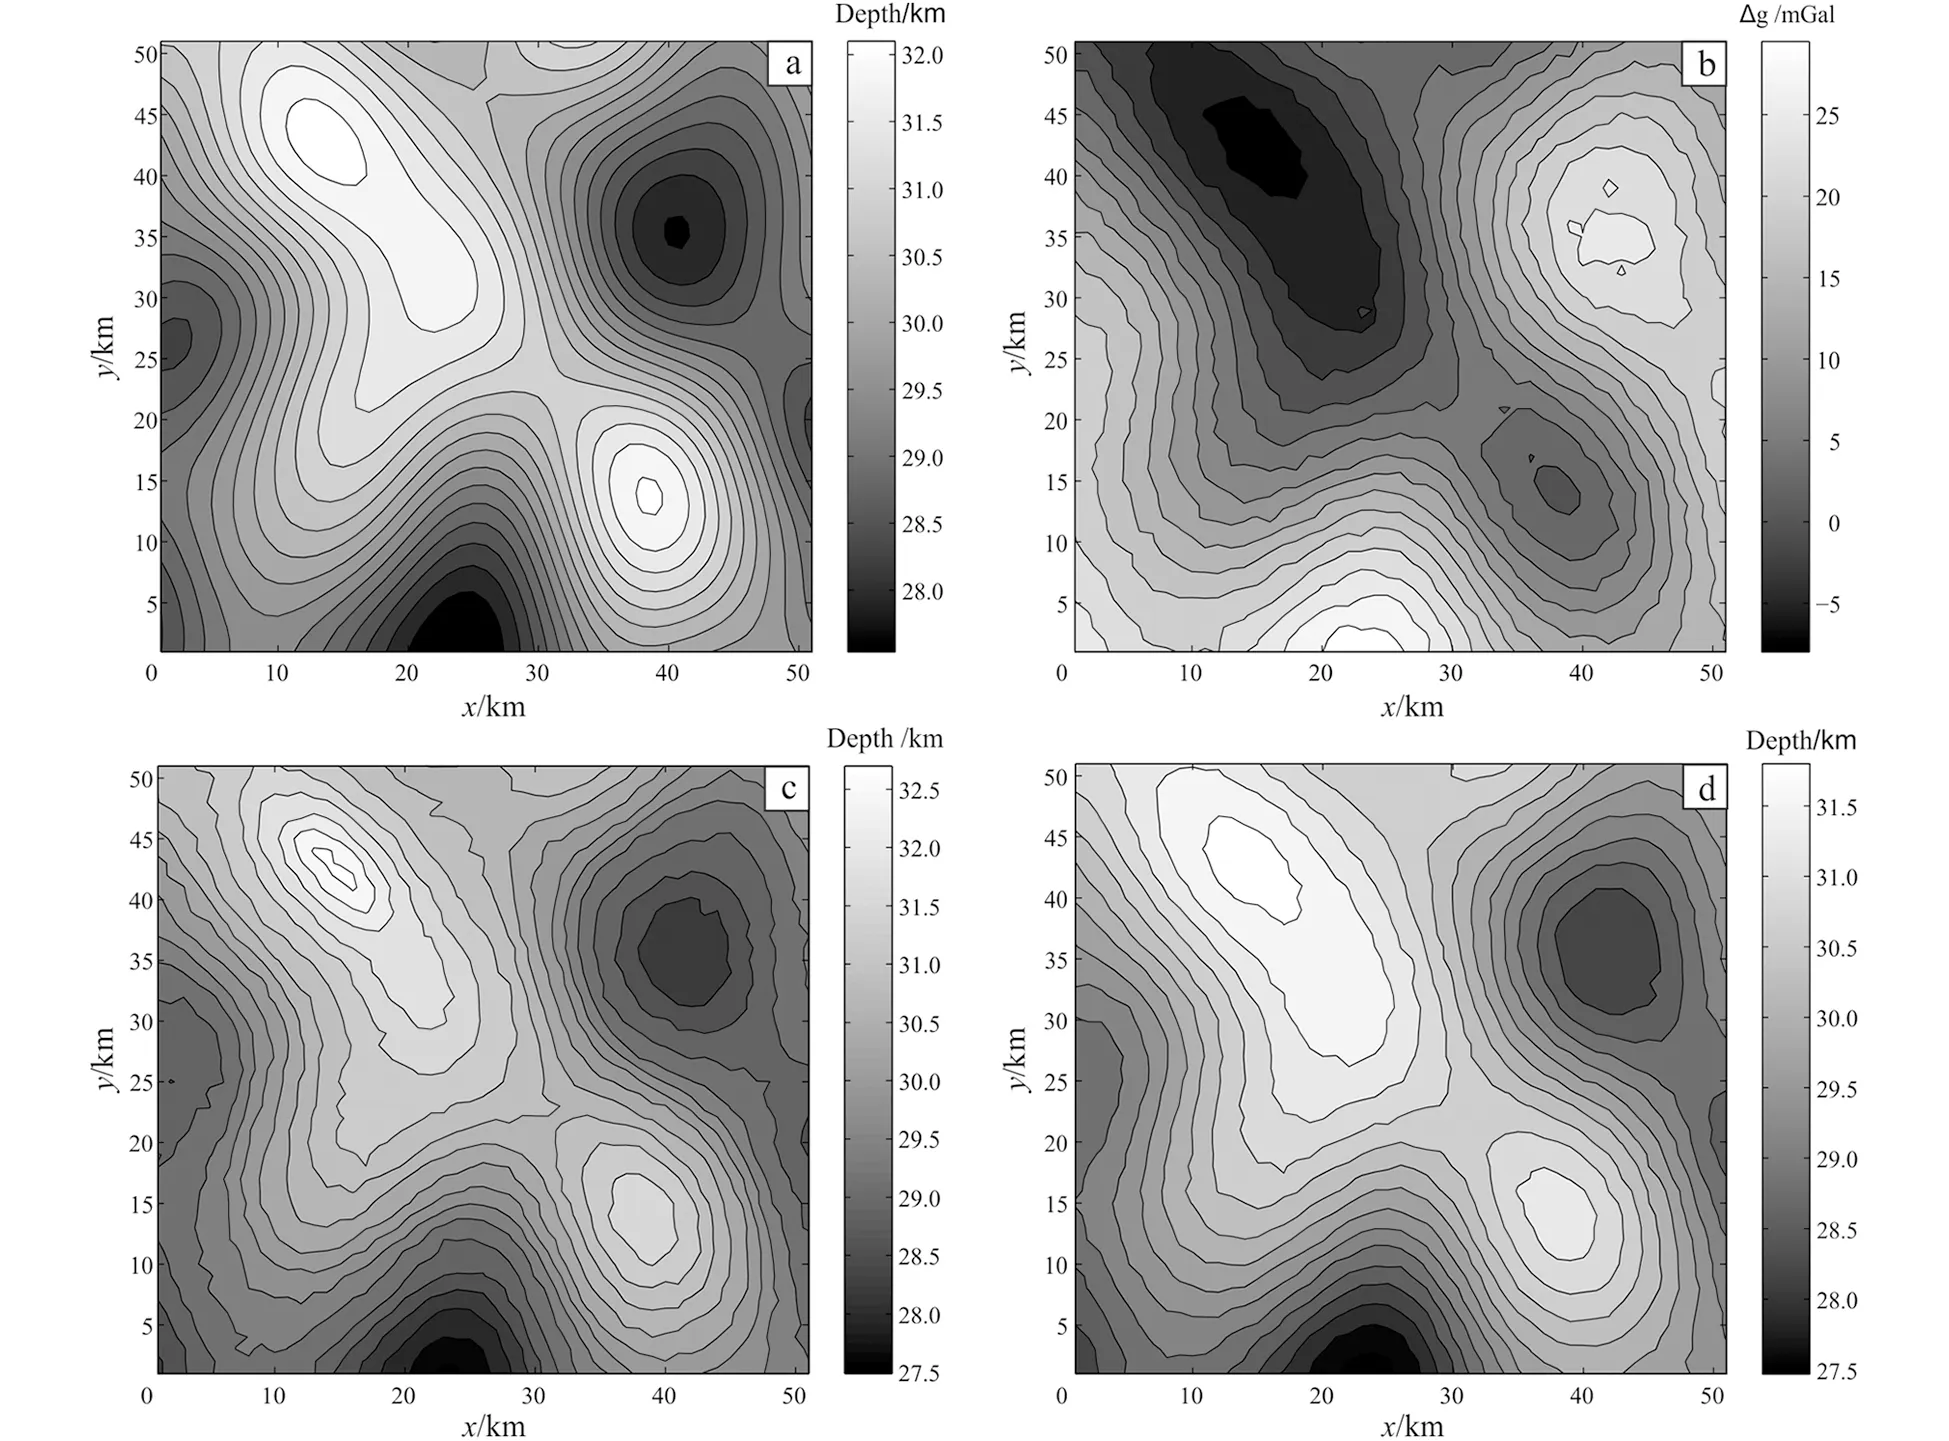
(a) contour map of synthetic model; (b) contour map of noisy gravity anomaly; (c) inversion result of BP method; (d) inversion result of PSO-BP method, contour interval is 0.3 km, 2.5 mGal, 0.3 km and 0.3 km, respectively.Fig. 3 Comparison of inversion results between BP and PSO-BP
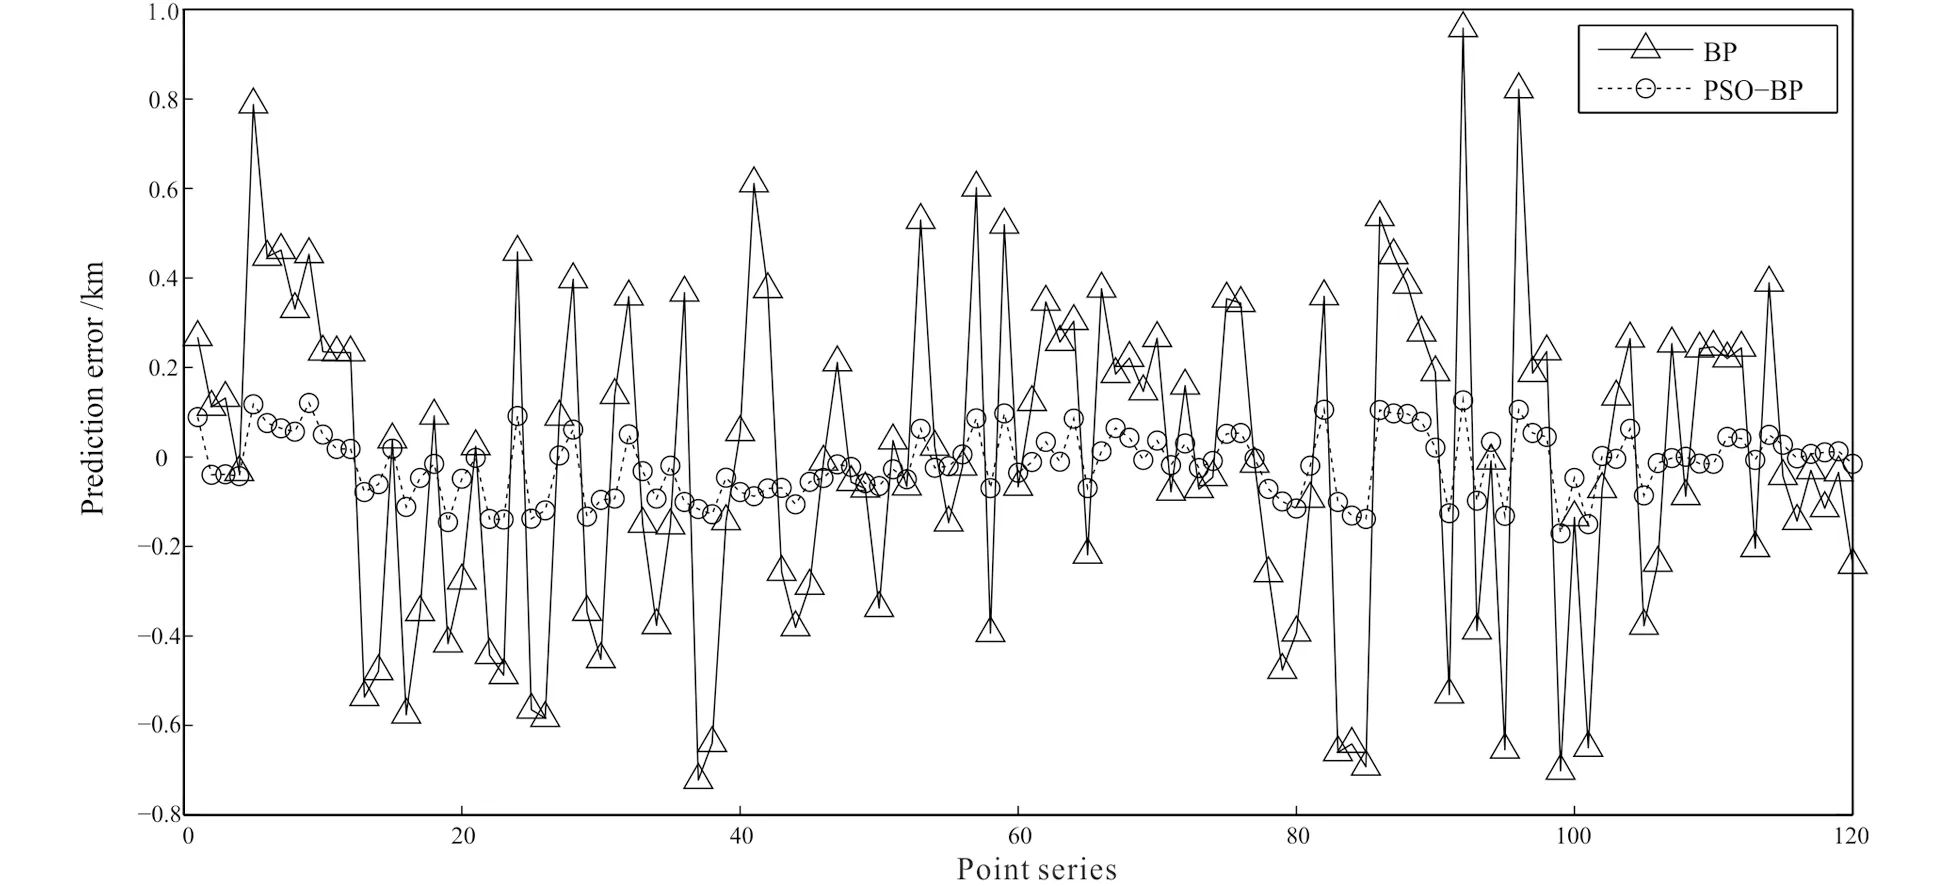
Fig. 4 Comparison of prediction error of 120 points
4Application in field data
The methods of BP and PSO-BP were utilized to the inversion of Moho interface with field data in this section. Given Bouguer gravity anomaly of a region in France and the area is 112×112 km2with square grid interval of 1 km, thus the gravity anomaly data matrix has 112 rows and 112 columns. It can be concluded from geological information and a part of deep seismic sounding data that the Moho interface in this area has small terrain relief and the average depth is within the range of 30±5 km. In this field application, seismic sounding data and the corresponding gravity data at the same grid points were regarded as training samples. That is to say, we can obtain the depth of Moho interface in the whole area with gravity anomaly and the depth of some scattered points or a seismic profile. Certainly, a larger amount of known information would lead to a better inversion result.
The parameters in this application were set just as the same as those in the model test for the reason that the two application circumstances were quite familiar. The evolutionary procedure of PSO is shown in Fig.5 and it terminates at the generation of 100. The training process of BP network is shown in Fig.6 and it is clear that the training terminates at the epoch of 218 as the error meets the goal. This process is more time-saving than that of BP, moreover, the possibility of falling in local minimum is lower. The inversion results are shown in Fig.7 and the inversion result of Parker-Oldenburg’s algorithm shown in Fig.8 serves as a contrast. In order to ensure the convergence of the iterative equation of Parker-Oldenburg’s method, we use a high-cut filter in the procedure of inversion. Obviously, the inversion result of PSO-BP is more accurate as it reveals more details and more fluctuations within a narrow range of the density interface. The inversion accuracy of PSO-BP has a distinct promotion compared to BP. In addition, the inversion process of PSO-BP is based on a trained neural network model and this can reduce computing complexity and time.
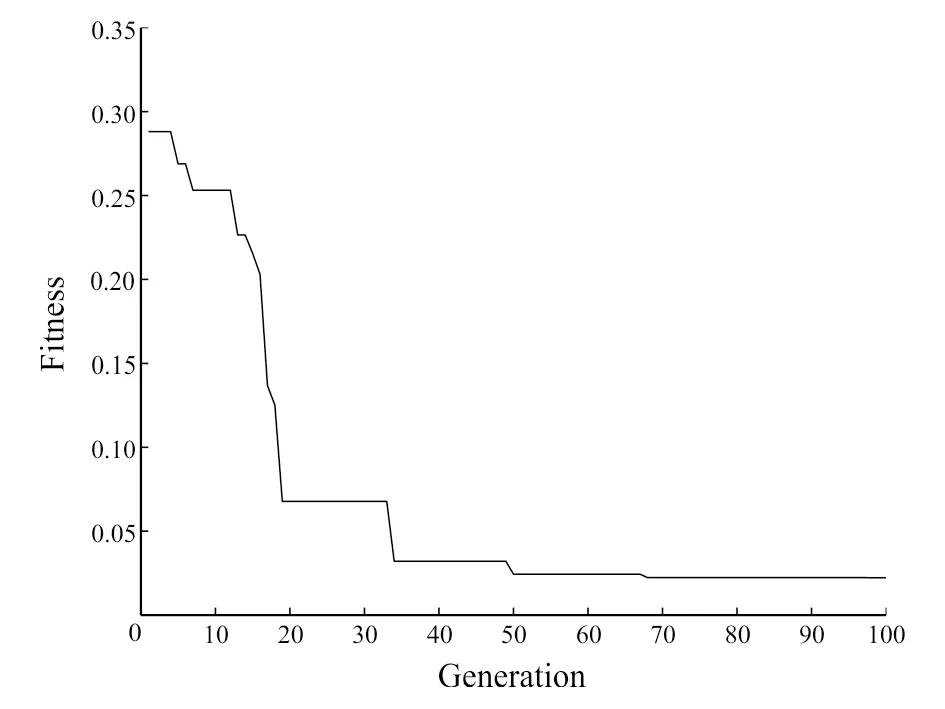
Fig. 5 Curve of fitness function with terminating generation 100
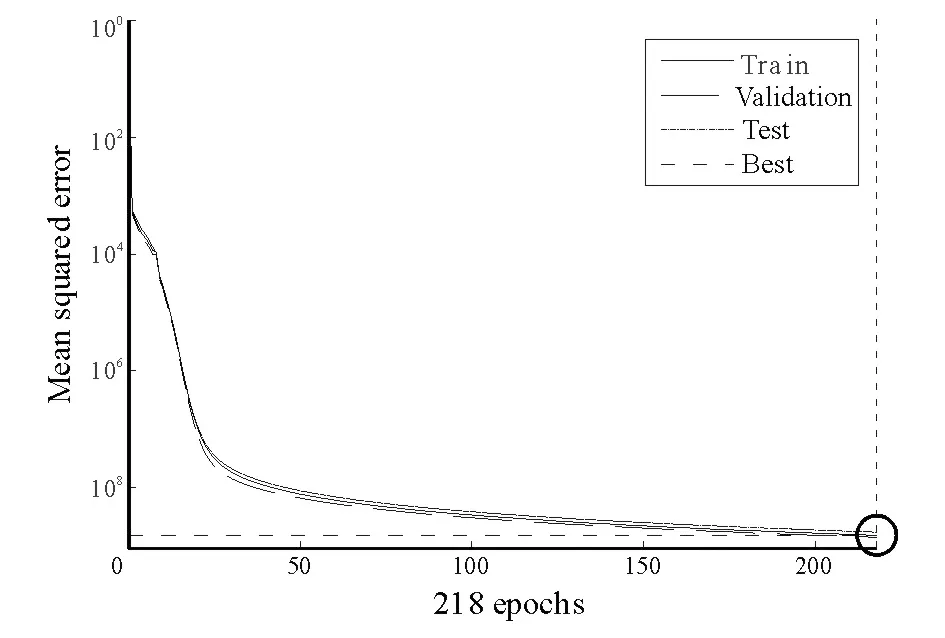
Fig. 6 Curve of the convergence of training
5Conclusions
In this paper, we presented a method used for the inversion of 3D density interface. This method is a heuristic nonlinear inversion method and it can be used to predict unknown information on the basis of available knowledge or even some appropriate synthetic models.
(1) The inversion accuracy increases evidently with optimization and the calculation speed is faster to some degree. Moreover, this method does not need complex calculation process, transforming to frequency domain in Parker-Oldenburg’s algorithm for example.
(2) The experiment of the synthetic model and field data demonstrates that the method of PSO-BP apparently improves the inversion effect of 3D density interface. More details of the interface are shown in the result of PSO-BP and the accuracy is satisfactory. To obtain even better inversion result, except for adjusting the parameters of BP neural network and particle swarm optimization, the best way is to add more information as effective constraints. And that is to say, the method in this paper will have larger potential and application value in the inversion of 3D density interface.
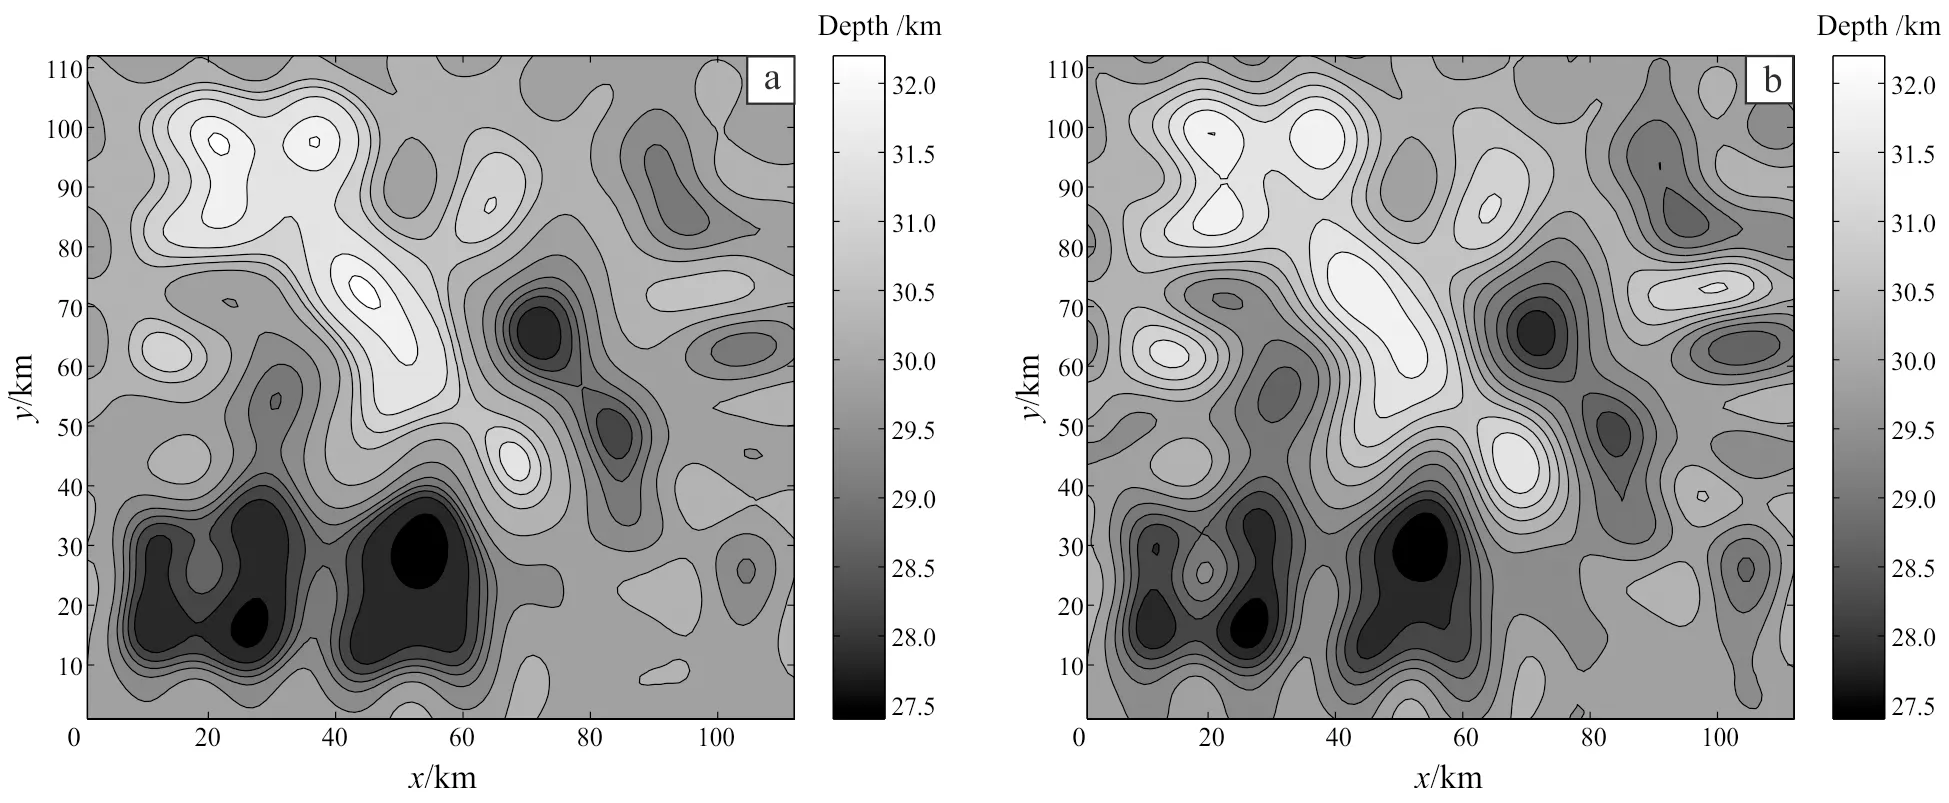
(a) inversion result of BP; (b) inversion result of PSO-BP and coutour interval 0.4 km.Fig. 7 Inversion Results of BP and PSO-BP
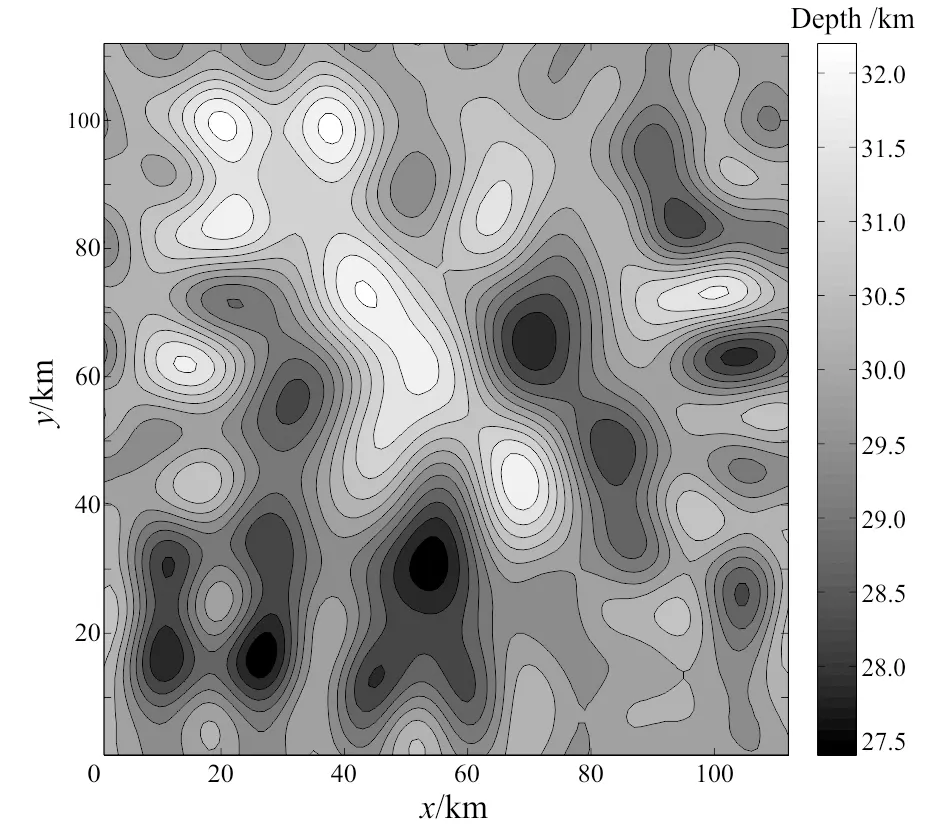
Fig. 8 Inversion result of Parker-Oldenburg’s algorithm (with contour interval of 0.4 km)
(3) Three main challenges of this method occurred in the application, including the selection of parameters of particle swarm algorithm, establishment of the structure of BP network and the random initialization of some parameters. For the former two challenges, there is no better ways to determine the specific values of the parameters but trial-and-error. For the later one, it cannot match the specific real problem to be solved as it is an inherent defect of the method.
References
Boeringer D W, Werner D H. 2004. Particle swarm optimization versus genetic algorithm for phased array synthesis.IEEETransactionsonAntennasPropagation, 52(3): 771-779
Eberhart R, Kennedy J. 1995. A new optimizer using particle swarm theory//Micro Machine and Human Science, Proceedings of the Sixth International Symposium. Nagoya[s.n.], 39-43.
Eberhart R, Shi Y H. 2001. Particle swarm optimization: developments, application and resources//Proceedings of the Evolutionary Computation Seoul: 81-86.
Li L, Wu Y G, Yang C B,etal. 2014. Several boundary identification methods of gravity data and application in Vientiane of Laos area.GlobalGeology, 17(1): 55-61.
Li Q C, Wu Y G. 2014. Application of gravity inversion focused in Changbai Mountain.GlobalGeology, 17(1): 62-66.
Li Z Y, Wang J Y, Guo C. 2008. A new method of BP network optimized based on particle swarm optimization and simulation test.ACTAElectronicaSinica, 36(11): 2224-2228.
Liu H L, Hu J, Wang J S,etal. 2004. The application of GA+BP hybrid neural network to inter-bed deposit prediction.Geophysical&GeochemicalExploration, 28(5): 460-463.
Ren C, An N, Wang J Z. 2014. Optimal parameters selection for BP neural network based on particle swarm optimization: a case study of wind speed forecasting. Knowledge-Based System, 56(1): 226-239.
Van der Bann, M., Jutten, C. 2000. Neural networks in geophysical applications.SocietyofExplorationGeophysists, 65(4): 1032-1047.
Zeng H L. 2005. Gravity field and gravity exploration. Beijing: Geological Publishing House, 131-144.
Zhang J R, Zhang J, Lok Tat Ming. 2007. A hybrid particle swarm optimization-back-propagation algorithm for feed forward neural network training.AppliedMathematicsandComputation, 185: 1026-1037.
Zhao W G. 2012. BP neural network based on PSO algorithm for temperature characteristics of gas Nanosensor.JournalofComputers, 7(9): 2318-2323.
Zhu Z Q, Cheng F D, Huang G X. 1995. Quasi neural network BP algorithm for simultaneous inversion of 3-D density interface.GeophysicalProspectingforPetroleum, 34(1): 76-85.
------------------------
(continued from page 32)
Luo T, Liu C, Yang X T,etal. 2015. Seismic data reconstruction based on iterative linear expansion of thresholds.GlobalGeology, 18(2): 127--133.
Shang X F. 2014. Inverse scattering: theory and application to the imaging of the earth’s seismic discontinuities: doctor’s degree thesis. Boston: Massachusetts Institute of Technology.
Wiggins J W. 1984. Kirchhoff integral extrapolation and migration of nonplanar data.Geophysics, 49(8): 1239--1248.
Xie Z P. 2012. Research on sparse reconstruction algorithms in compressive sensing: doctor’s degree thesis. Nanjing: Nanjing University of Aeronautics and Astronautics. (in Chinese with English abstract)
Zhang H, Chen X H. 2013. Seismic data reconstruction based on jittered sampling and curvelet transform.ChineseJournalofGeophysics, 56 (5):1637--1649. (in Chinese with English abstract)
doi:10.3969/j.issn.1673-9736.2016.01.05
-------------------------
(to be continued on page 40)
Article ID: 1673-9736(2016)01-0033-08
Received 9 August 2015, accepted 5 October 2015
Supported by National High-tech Research & Development Program of China (863 Project) (No.2014AA06A613)
杂志排行
Global Geology的其它文章
- Research on drilling parameters of engine-powered auger ice drill
- Estimation of reservoir porosity using probabilistic neural network and seismic attributes
- Distributive characteristics of reservoirs and exploration potential associated with intrusive rocks of Yingcheng Formation in Yingtai rift depression, NE China
- Oil shale resources in China and their utilization
- Downhole microseismic data reconstruction and imaging based on combination of spline interpolation and curveletsparse constrained interpolation
- Random seismic noise attenuation by learning-type overcomplete dictionary based on K-singular value decomposition algorithm
