Research on Ground-Based LWIR Hyperspectral Imaging Remote Gas Detection
2016-06-15ZHENGWeijianLEIZhenggangYUChunchaoYANGZhixiongWANGHaiyangFUYanpengLIXunniuLIAONingfangSUJunhong
ZHENG Wei-jian,LEI Zheng-gang,YU Chun-chao,YANG Zhi-xiong,WANG Hai-yang, FU Yan-peng, LI Xun-niu,LIAO Ning-fang,SU Jun-hong
1. Kunming Institute of Physics, Kunming 650223, China 2. School of Optoelectronics, Beijing Institute of Technology, Beijing 100081, China
Research on Ground-Based LWIR Hyperspectral Imaging Remote Gas Detection
ZHENG Wei-jian1,2,LEI Zheng-gang1,YU Chun-chao1,YANG Zhi-xiong1,WANG Hai-yang1,2, FU Yan-peng1,2, LI Xun-niu1,2,LIAO Ning-fang2,SU Jun-hong1,2
1. Kunming Institute of Physics, Kunming 650223, China 2. School of Optoelectronics, Beijing Institute of Technology, Beijing 100081, China
The new progress of ground-based long-wave infrared remote sensing is presented, which describes the windowing spatial and temporal modulation Fourier spectroscopy imaging in details. The prototype forms the interference fringes based on the corner-cube of spatial modulation of Michelson interferometer, using cooled long-wave infrared photovoltaic staring FPA (focal plane array) detector. The LWIR hyperspectral imaging is achieved by the process of collection, reorganization, correction, apodization, FFT etc. from data cube. Noise equivalent spectral radiance (NESR), which is the sensitivity index of CHIPED-1 LWIR hyperspectral imaging prototype, can reach 5.6×10⁻⁸W·(cm-1·sr·cm2)-1at single sampling. The data is the same as commercial temporal modulation hyperspectral imaging spectrometer. It can prove the advantage of this technique. This technique still has space to be improved. For instance, spectral response range of CHIPED-1 LWIR hyperspectral imaging prototype can reach 11.5 μm by testing the transmission curve of polypropylene film. In this article, choosing the results of outdoor high-rise and diethyl ether gas experiment as an example, the authors research on the detecting method of 2D distribution chemical gas VOC by infrared hyperspectral imaging. There is no observed diethyl ether gas from the infrared spectral slice of the same wave number in complicated background and low concentration. By doing the difference spectrum, the authors can see the space distribution of diethyl ether gas clearly. Hyperspectral imaging is used in the field of organic gas VOC infrared detection. Relative to wide band infrared imaging, it has some advantages. Such as, it has high sensitivity, the strong anti-interference ability, identify the variety, and so on.
Hyperspectral imaging; LWIR; Remote sensor; Gas detection
Biography: ZHENG Wei-jian, (1962—), reseacher grade senior engineer and PhD supervisor, Kunming Institute of Physics e-mail: zwj866@139.com
Introduction
Hyperspectral infrared remote sensing for special gas detection, is a novel application of infrared technology. Because of the strong military demand of battlefield chemical gas remote sensing, United States began to setup the research project of infrared remote sensing LOPAIR (Long Path InfraRed) in the 1970s, led by the U.S. Army Edward Wood Biochemical Research Center ERDEC; in the mid-1990s, after the battlefield applications during the Persian Gulf War, RSCAAL plan of the U.S. military defense Advanced Research Projects Agency matured and U.S. Army authorized M21-type FTS remote gas detection instrument as a standard equipment, which formally started the era of hyperspectral gas remote sensing applications[1-3]. At present, internationally the forefront of this research is on the high throughput and high sensitive interference imaging gas detection[4].
In the 1980s, China started the reserch of chemic gas infrared remote sensing technology. At the beginning of this century, Kunming Institute of Physics, Anhui Institute of Optics and fine Mechanics etc finished the development of time-modulated Fourier transform infrared remote sensing technology together[5]. This technology can monitor real-time gas cloud cluster along the optical path. But there are very few applicable technological results for the environmental gas sensing.
This paper discussed the technique realization of Michelson spatial modulation hyperspectral imaging spectrometer, and reported some research examples of hyperspectral long-wave infrared imaging gas detection designed by the research team.
1 The design of infrared interference imaging prototype for ground-based environmental gas sensing
Ground-based environmental gas sensing, in terms of technology, has relatively stringent requirements. The spectrum window covers mainly on LWIR and the background radiation is very complex. For the passive remote sensing, light source is intrinsic infrared radiation of nature object. Firstly, a spectrometer with high sensitivity is needed, so a cooled photonics detectors was used; secondly, because the intrinsic spectral characteristics of absorption or radiation from VOC molecule/molecular functional-group must be distinguished for the detection and identification, a high spectral resolution is required, which the hyperspectral method meets well. Thirdly, due to the strong fluidity of gas, real-time requirements for the automatic intelligent recognition are high, and it should be on the order of a second at least. Since the detection of gas distribution and flow trends have practical applications in the public, industry and military, recently there are intense research interest on hyperspectral imaging infrared remote sensing technology, especially in Fourier transform infrared interference imaging method.
Hyperspectral infrared interference imaging technologies are categorized into three groups: temporal modulation, spatial modulation, spatial and temporal hybrid modulation. The product based on temporal modulated Fourier transform infrared spectroscopy is relatively mature internationally, and BRUKER company of German and TELOPS company of Canada already have a number of commercial products in areas of chemical gas remote sensing[6,7]. Noise equivalent sensor response (NESR) of FIRST of TELOPS company is 53 nW·(cm2·sr·cm-1)-1, which is a average calculated by three samplings[7]. However, because the interference fringe depends critically on the time series of the exact position of moving mirror so it is prone to vibrations. Therefore, other technical means, such as spatial modulation or spatial and temporal hybrid modulation, deserve to be explored.
1.1 The principle of spatial modulation Fourier infrared spectroscopy
Spatial and temporal hybrid modulation belongs to spatial modulation in nature. The spatial modulated infrared Fourier-transform spectrometer does not rely on the exact position of the relative motion of the moving mirror, and interference fringes are formed on the focal plane of detector. The interferometer usually base on the principle of Sagnac or Michelson. Due to the limitation of LWIR detectors development, progress of LWIR band compared with the visible light and near infrared band is slower[8,9]. In recent years, hyperspectral imaging system based on Sagnac interferometer for the ground based detection designed by USA University of Hawaii and spectrum and photonics company, can detect the flow of ether gas and acetone gas[8]. Charles Fabry laboratory of University of Paris in France, TOSA company and etc have adopted the Michelson interferometer used rectangle prism already reported the laboratory results in 3~5 μm[10]. The LWIR hyperspectral imaging system based on interferometer composed of corner cube designed by Swedish National Defence College and USA University of Florida, measured spectrum of polypropylene film. These researches validated the feasibility of Michelson spatial modulated imaging spectroscopy, but there is no report on gas detection yet[11].
Figure 1 is block diagram of the CHIPED-1 experimental prototype of spatial and temporal hybrid modulation LWIR hyperspectral imaging designed by our team[12-14]. Infrared detector is a 320×256 array longwave (7.7~11.5 μm) photovoltaic detector assembly, which is cooled by a integrated Stirling cooler, and infrared video images data is transferred into processing computer by Camera Link digital interface. Figure 2 is a photograph of the experimental prototype.
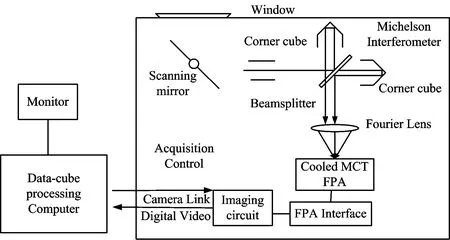
Fig.1 Block diagram of the experimental device of spatial and temporal modulation LWIR hyperspectral imaging
Radiation of incident scene forms the interference fringes by spatial modulation of Michelson interferometer, superimposed on the infrared image. By swing the scanning mirror a step according to the Instantaneous FOV interval of spectra dimension. Because interference information has to be collected for each column of pixels of spectral dimension on the scene, infrared images of 640 frames captured form a raw image data cube, then spectral cube can be obtained by interference cube data reorganization, (baseline and phase) correction, FFT transform etc. As shown in figure 3.

Fig.2 LWIR hyperspectral imaging prototype
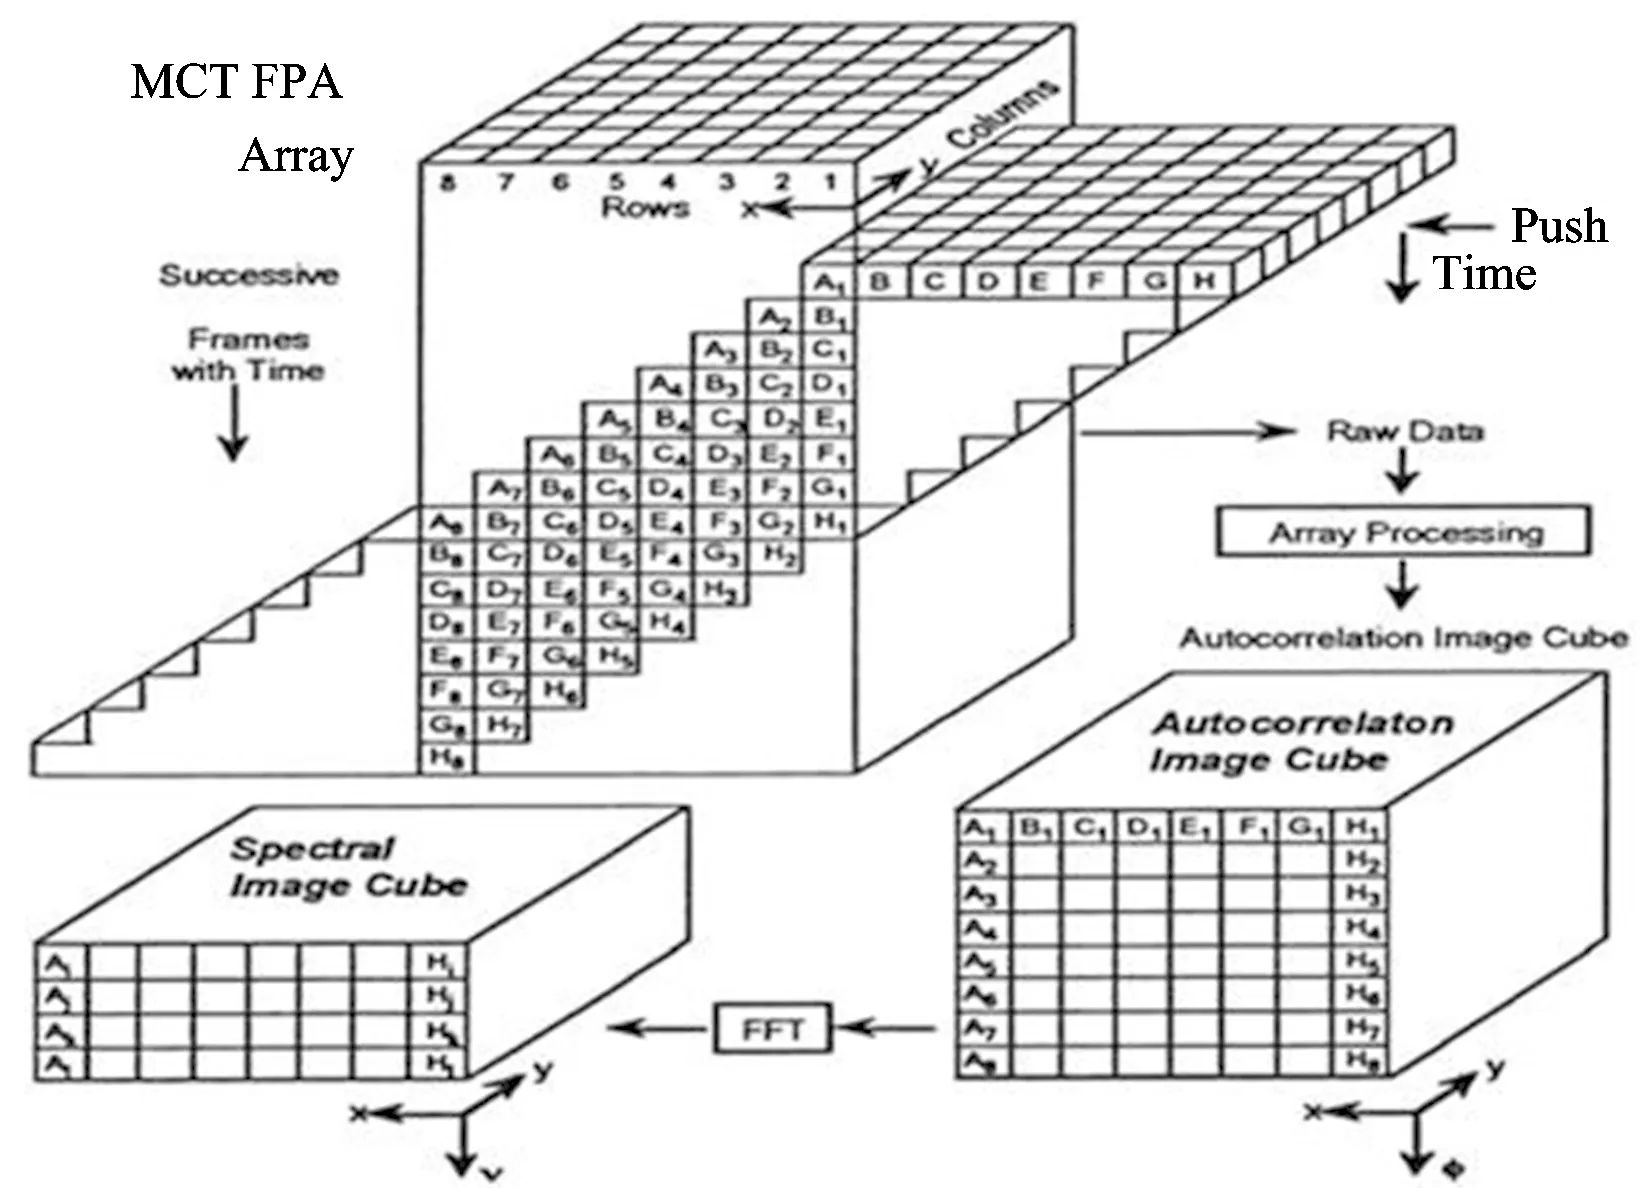
Fig.3 The procedure of window pushbroom spatial and temporal hybrid modulation data cube formation and transformation into spectral cube
Algorithm of data cube is important part of hyperspectral spectrometer. We develop the software module of data preprocessing, FFT transform etc (Shown in figure 4), and design our software of spectral data processing.
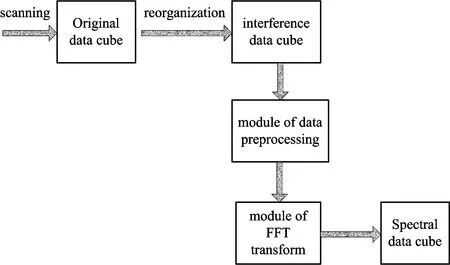
Fig.4 Diagram of the data-cube processing software
To obtain spectral image data cube, every row in each frame of the interference image cube is transformed by one-dimensional FFT. If the original frame data is a unilateral interferogram, data shall be symmetrically treated in order to carry out FFT. Interferogram data became bilateral distribution after this symmetric treatment, then the modulus of the Fourier transform coefficient is the measured spectral distribution, wherein
(k=0,1,2,3,…,N-1)
(1)
Spectral information obtained at this time is only relative spectral information, and it must go through the calibration in order to get the spectral information for each wavelength band.
1.2 Noise equivalent spectral radiance(NESR)
Definition of Noise equivalent sensor response (NESR)of instrument is that radiation flux density, when S/N of instrument is 1, relative to wavelength (wavenumber) at a given resolution and scanning rate. S/N is Signal-to-Noise of hyperspectral imaging spectrometer, and it also indicate signal quality of hyperspectral imaging spectrometer. So the NESR can reflect photoelectric response ability of system and overall performance index of sensitivity of instrument
(2)

Then, the radiance of blackbody calculated by Planck law is
(3)
L(ν,T) is spatial radiance, (W·cm-2·sr-1·cm);νis wavenumber, (cm-1);Tis absolute temperature, (K);c1is first radiation constant,c1=1.191×10⁻¹²W·cm2·sr-1,c2is second radiation constant,c2=1.439×10⁴K·μm.
The spatial data of two temperature can do the calculation by use of single scanning data in real condition. When we calculate on spectral luminance difference, the temperature used is same as the temperature of blackbody.
2 Experimental results of LWIR hyperspectral imaging
2.1 Characteristic of spatial response
When the experiment take 65 ℃ plane plate blackbody as background, and we test the spectral absorption of polypropylene film by using hyperspectral imaging prototype.The shape of the trend is the same by comparing the data from BRUKER OPAG33 and literature.
The spectral response range of CHIPED-1 LWIR hyperspectral imaging prototype can reach 11.5 μm (870 cm-1) by testing the transmission curve of polypropylene film.
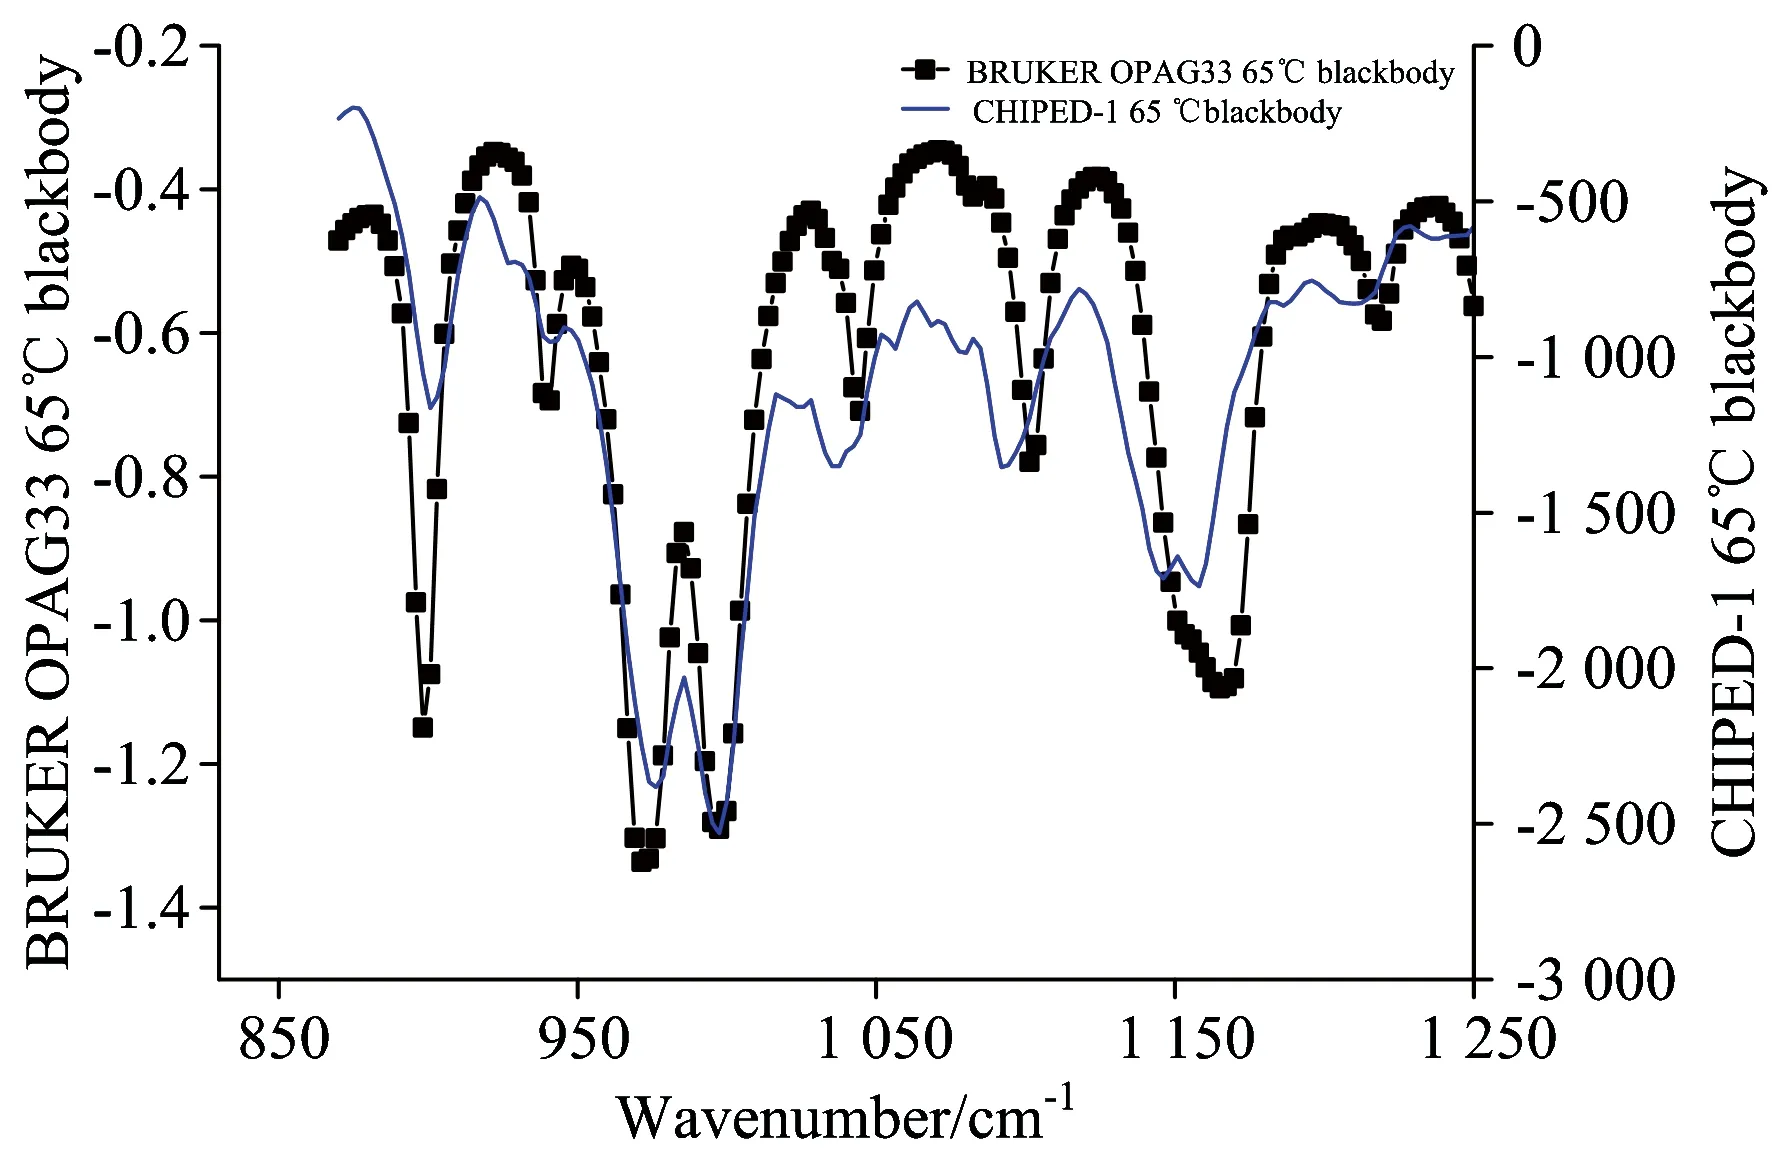
Fig.5 Measured Transmittance spectra of a polypropylene film by OPAG33 and CHIPED-1
2.2 Measurment of NESR
According to formula (2), single sampling testing data can calculate the NESR of prototype for the 35 ℃ blackbody and 65 ℃ blackbody by using CHIPED-1 LWIR hyperspectral imaging prototype.
Noise equivalent spectral radiance(NESR) can reach 5.6×10⁻⁸W·(cm-1·sr·cm2)-1in the figure 6.
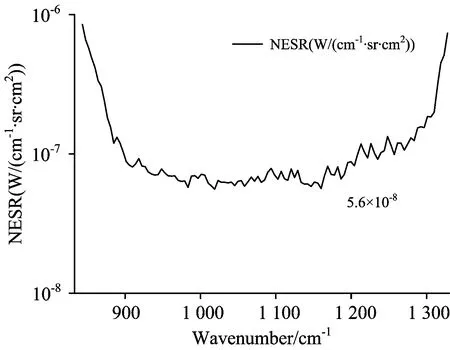
Fig.6 Noise equivalent spectral radiance (NESR) of CHIPED-1
2.3 Hyperspectral remote sensing Experimental in the outfield
In order to analysis the spectral of highrise in about 500 meters [Figure 7(a),(b)], that it the need to collect image information for three times fiemd of view (Figure 8).

Fig.7(a) Photogram of the highrise in about 500 m

Fig.7(b) Interferogram of the highrise in about 500 m

Fig.8 IR panorama image scene by windowing
The windowing data cube should be restructured for the Figure 8, and we can get the interference data cube, shown in Figure 9(a). Then, we should do some preprocessing, such as Zero-mean of interferogram, the interferogram apodization, phase correction, etc. Figure 9(b) is interferogram whch has done Zero-mean of interferogram.
Cross-section of spectral cube after the disposal of data cube is shown in Figure 10 at 950 m-1, and latticed image caused by glass curtain wall.
2.4 Gas detection test in the outfield
For scene in the 50 meters, shown as the thermal image gathered by CHIPED-1 in Figure 11, we use volatile ether to make tests of gas detection. Figure 12 and Figure 13 are spectrogram of absorption peak nearby before and after ether liquor douse the ground, but we can not see ether spatial distribution. Figure 14 is differential spectrogram making use the data of Figure 12 and Figure 13, and in the figure we can see the ether spatial distribution of the absorption peak nearby.
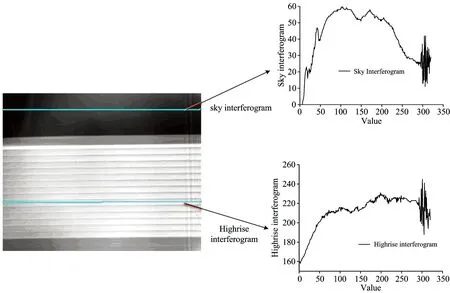
Fig.9(a) Column of rebuilded interferogram cube for sky and highrise interferogram

Fig.9(b) Column of after interference sectional baseline correction for sky and highrise interferogram
Figure 13 is ether gas spectrum absorption curve of difference spectrum detected by CHIPED-1 at point (87,98) (Figure 14), and the shape of the ether gas spectrum absorption curve trend is the same by comparing the data from BRUKER OPAG33 and NIST Chemical WebBook.

Fig.10 The target spectrum of cross section at the 1 260 cm-1

Fig.11 Quick view of infrared thermal imaging of test scene
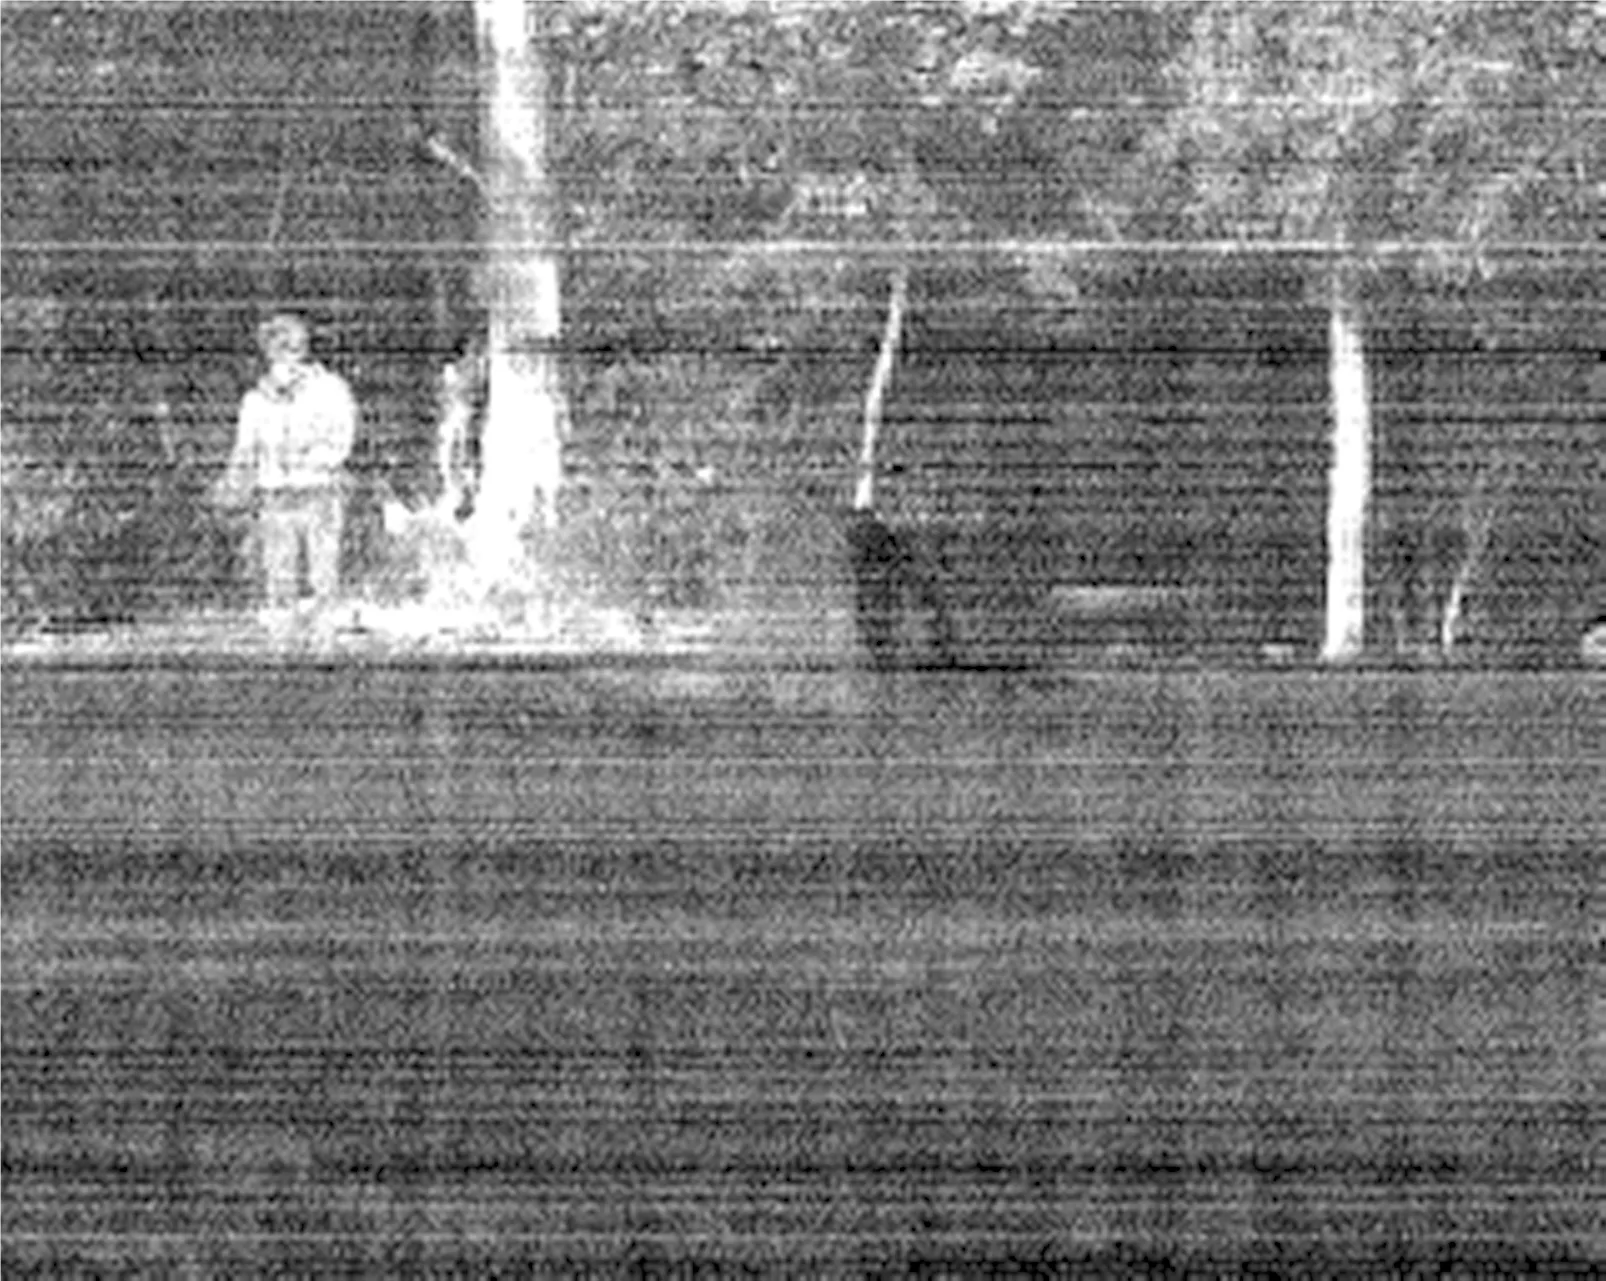
Fig.12 Background spectrogram of scene without ether gas at 1 145 cm-1 in the 50 meters
3 Analysis and Discussion
(1) Due to difference of wavelength calibration, polypropylene film absorption peak position detected by CHIPED-1 can not match perfectly with the result of OPAG33. So we should improve on the means of wavelength calibration.
(2) There are grids in the infrared imaging spectrogram of figure 10, may be caused by vibration of cooler[11], or phase noise. The further research and analysis still need to do.
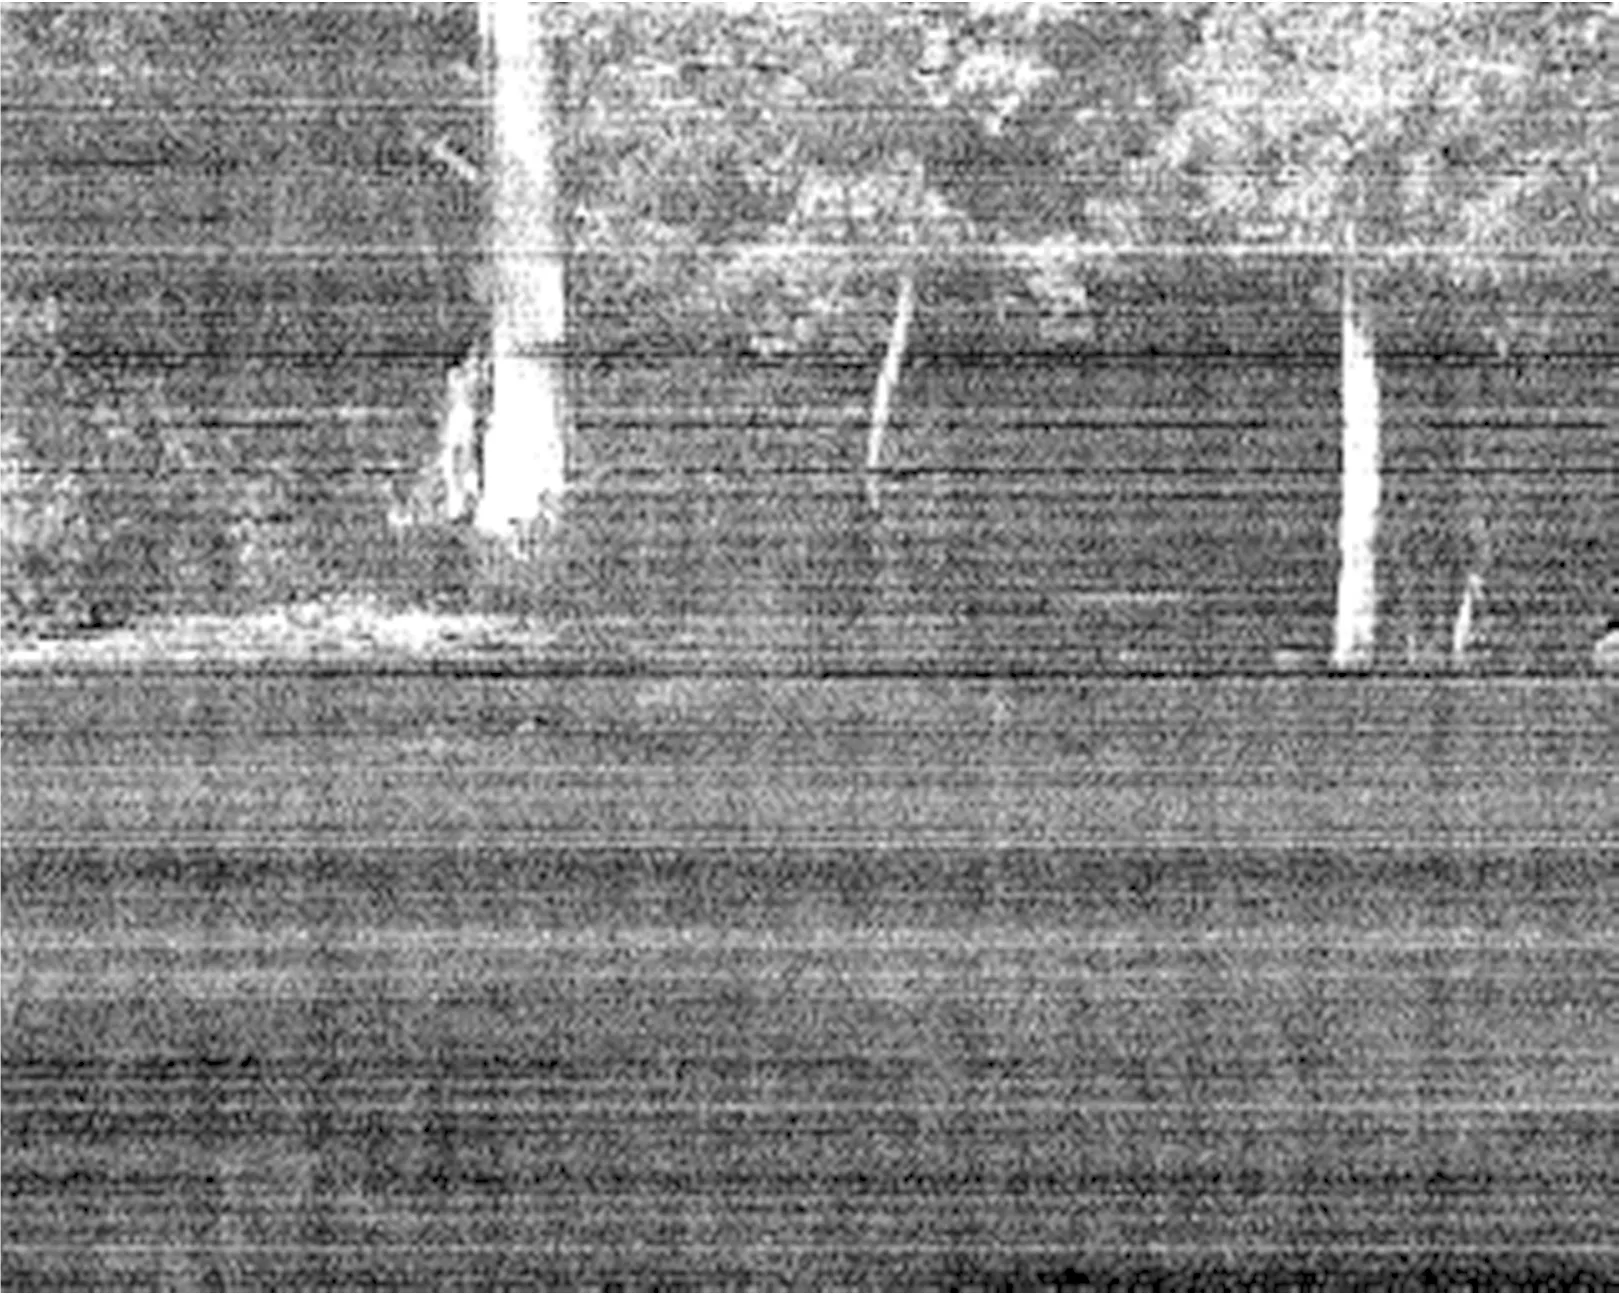
Fig.13 Spectrogram of scene with ether gas at 1 145 cm-1 in the 50 meters
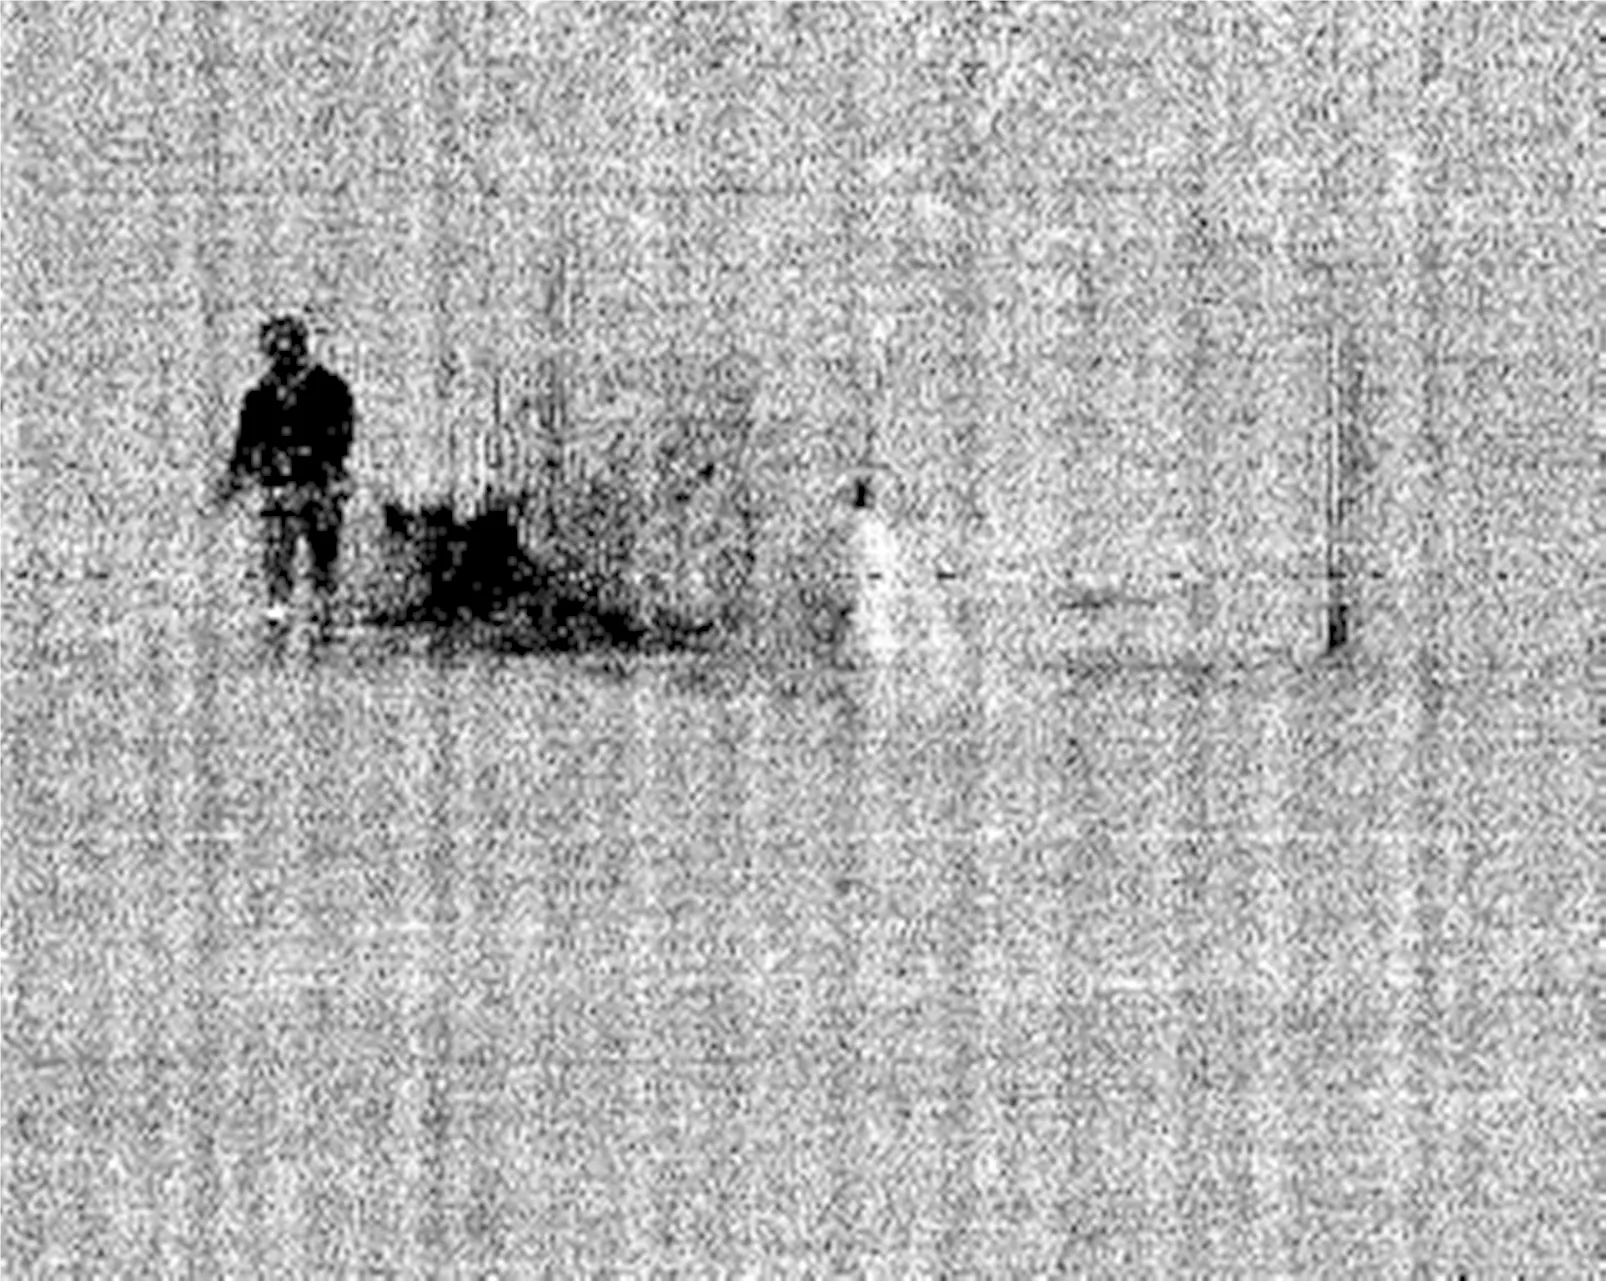
Fig.14 Difference spectrogram of the ether gas at 1 145 cm-1

Fig.15 Transmittance spectrum of Ether gas from the scene compared to both NIST literature Data (ETHYL ETHER) and BRUKER OPAG33
(3) Because we just use a few dosage of ether liquid, it can not see the ether gas from infrared spectrum slice of the same wavenumber, shown in figure 12 and figure 13. But we can see the ether gas after the difference spectrum in figure 14. Relative to wide band infrared imaging, the hyperspectral means has some advantages.
(4) The ether infrared spectrum absorption peak detected by CHIPED-1 and OPAG33 exist in ethyl ether absorption peak envelopment of NIST Chemical WebBook. It reflects the data rationality.
4 Conclusion
Experimental prototype of LWIR spectral imaging designed by our team demonstrate the principle of spatial modulated interference, and provides a new technical means for ground-based gas remote sensing. Noise equivalent spectral radiance (NESR), which is the sensitivity index of CHIPED-1 LWIR hyperspectral imaging prototype, can reach 5.6×10⁻⁸W·(cm-1·sr·cm2)-1at single sampling at present. The data is the same as commercial temporal modulation hyperspectral imaging spectrometer. It can prove the advantage of this technique. This technique still has space to be improved.
Hyperspectral imaging is used in the field of organic gas VOC infrared detection in the complicated background. Relative to wide band infrared imaging, it has some advantages. Such as, it has high sensitivity, the strong anti-interference ability, identify the variety, and so on.
With the development of detector technology, it is expected to cover 8~14 μm LWIR atmospheric window, to make a substantial contribution for detection of environmental gas in the future.
Acknowledgement
This project was supported greatly by Fang Yonghua researcher of Anhui Institute of Optics and Fine Mechanics, Chinese Academy of Science and Gao Jiaobo researcher of Xi’an Institute of Applied Optics.
[1] Dennis F Flanigan. SPIE,1996,2763.
[2] Mark L Althouse et al. Proc. of Protection Against Chemical Warfare Agents, 1995.
[3] John P Carrico. SPIE, 1998, 3383.
[4] Zheng Weijian, Hu Xu, Su Junhong, et al. Infrared and Laser Engineering, 2006,35(5): .
[5] Zheng WeiJian, Jin Weiqi, Su Junhong. SPIE, 2008, 6621: 662129-1.
[6] Samer Sabbah, Roland Harig, et al. Optical Engineering, 2012, 51(11): 111717.
[7] Chamberland M, et al. SPIE, 2004, 5416-40.
[8] Paul G Lucey, Mark Wood, Sarah T Crites, et al. SPIE,2012,8390.
[9] Crites S T,Lucey P G,Wright R,et al. SPIE, 2012, 8385: 838509-1.
[10] Noura Matallah,et al. Proc.of SPIE, 2011,8167: 816715-13.
[11] Bergstrom D,Renhorn I,et al. SPIE, 2010,7660: 76602F-1.
[12] Li Xunniu,et al. Proc.of SPIE, 2013,8910: 8910P1-10.
[13] Wang Haiyang,et al. Proc.of SPIE, 2013,8910: 89100Q1-9.
[14] Fu Yangpeng,et al. Proc. of SPIE, 2013,8910: 89100R1-8.
[15] Ma Lin, Zheng Weijian, Su Junhong. Proc. of SPIE, 2009,750: 6750610.
O657.3
A
地面长波红外高光谱成像气体探测研究
郑为建1,2,雷正刚1,余春超1,杨智雄1,王海洋1,2,付艳鹏1,2,李训牛1,2,廖宁放2,苏君红1,2
1. 昆明物理研究所,云南 昆明 650223 2. 北京理工大学,北京 100081
报道了地面长波红外遥测的新进展,具体阐述了窗扫时空调制傅里叶光谱成像技术的实现过程。演示装置基于角锥反射镜Michelson干涉具,构成了空间调制干涉; 采用了制冷型长波红外焦平面探测器组件,通过对数据立方体的采集、重组、基线校正、切趾、相位校正和傅里叶变换等处理,实现了长波红外波段高光谱成像。自研的CHIPED-1长波红外高光谱成像原理实验装置的探测灵敏度指标噪声等效辐射通量密度NESR在单次采样时达到了5.6×10⁻⁸W·(cm-1·sr·cm2)-1,与商品化时间调制干涉高光谱成像仪相当; 反映了技术的先进性,并留有较大的改进空间。通过测试聚丙烯薄膜的透过率曲线,CHIPED-1红外高光谱成像原理实验装置的光谱响应范围达到了11.5 μm。文章还以室外高楼和乙醚气体的探测实验为例,研究了二维分布化学气体VOC的高光谱成像探测方法。在复杂背景和低试验浓度情况下,从同一波数的红外光谱切片上,观察不出乙醚蒸气的存在,但是进行了差谱处理后,可以清楚看到乙醚蒸气的空间分布。高光谱方法应用在有机蒸气VOC的红外探测领域,相对于宽波段热成像方法,具有灵敏度高、抗干扰能力强和识别种类多等诸多优势。
高光谱成像; 长波红外; 遥测; 气体探测
2014-09-11,
2015-01-15)
2014-09-11; accepted: 2015-01-15
National Defence Base Scientific Research Project(A40407020201)
10.3964/j.issn.1000-0593(2016)02-0599-08