The Characteristic Spectral Selection Method Based on Forward and Backward Interval Partial Least Squares
2016-06-15QUFangfangRENDongHOUJinjianZHANGZhongLUAnxiangWANGJihuaXUHonglei
QU Fang-fang,REN Dong*,HOU Jin-jian,,ZHANG Zhong,LU An-xiang,WANG Ji-hua,,XU Hong-lei
1. College of Computer and Information Technology, Three Gorges University, Yichang 443002, China 2. Beijing Research Center for Agricultural Standards and Testing, Beijing 100097, China 3. Department of Mathematics and Statistics, Curtin University, Perth 6845, Australia
The Characteristic Spectral Selection Method Based on Forward and Backward Interval Partial Least Squares
QU Fang-fang1,REN Dong1*,HOU Jin-jian1,2,ZHANG Zhong1,LU An-xiang2,WANG Ji-hua1,2,XU Hong-lei3
1. College of Computer and Information Technology, Three Gorges University, Yichang 443002, China 2. Beijing Research Center for Agricultural Standards and Testing, Beijing 100097, China 3. Department of Mathematics and Statistics, Curtin University, Perth 6845, Australia
In the near-infrared spectroscopy, the Forward Interval Partial Least Squares (FiPLS) and Backward Interval Partial Least Squares (BiPLS) are commonly used modeling methods, which are based on the wavelength variable selection. These methods are usually of high prediction accuracy, but are strongly characteristic of greedy search, which causes that the intervals selected are not good enough to indicate the analyte information. To solve the problem, a spectral characteristic intervals selection strategy (FB-iPLS) based on the combination of FiPLS and BiPLS is proposed. On the basis of spectral segmentation, both FiPLSs are used to select useful intervals, and BiPLS is used to delete useless intervals, so as to perform the selection and deletion of the characteristic variables alternatively, which conducts a two-way choice of the target characteristic variables, and is used to improve the robustness of the model. The experiments on determining the ethanol concentration in pure water are conducted by modeling with FiPLS, BiPLS and the proposed method. Since different size of intervals will affect the result of the model, the experiments here will also examine the model results with different intervals of these three models. When the spectrum is divided into 60 segments, the FB-iPLS method obtains the best prediction performance. The correlation coefficients (r) of the calibration set and validation set are 0.967 7 and 0.967 0 respectively, and the cross-validation root mean square errors (RMSECV) are 0.088 8 and 0.057 1, respectively. Compared with FiPLS and BiPLS, the overall prediction performance of the proposed model is better. The experiments show that the proposed method can further improve the predictive performance of the model by resolving the greedy search feature against BiPLS and FiPLS, which is more efficient for and representative of the selection of characteristic intervals.
Near-Infrared Spectroscopy; FiPLS; BiPLS; FB-iPLS; Greedy search; Characteristic intervals
Biography: QU Fang-fang, (1990—), female, Master Degree Candidate in College of Computer and Information Technology, Three Gorges University e-mail: quff1128@163.com *Corresponding author e-mail: rendong5227@163.com
Introduction
Near-infrared spectroscopy contains a large number of absorption peaks of frequency doubling and frequency synthesis groups containing hydrogen, which can reflect the information of the tested substance in samples (concentration, category, etc.). It will give rise to spectral information overlapping and some redundant information including a lot of noises, sample background and the like. It is difficult to eliminate them by preprocessing[1]. If these data are involved in model building, which not only increases the computational complexity of the model, but reduces the preciseness[2]. Studies have shown that, the partial of the characteristics extracted from the full spectrum to modeling can significantly improve the prediction accuracy, and simplify the model. Furthermore, a robust model with good predictive performance will be achieved by eliminating irrelevant or non-linear variables[3-4].
Conventional methods about selecting spectral region of the spectrum are the correlation coefficient method, stepwise regression method, interval and moving window partial least squares method (MWPLS), stochastic optimization methods, etc. Studies by researchers at home and abroad show that, these methods can be used to select the wavelength spectrum effectively. However, each method has its own advantages and disadvantages without any single method universal[5-6]. For correlation coefficient method based on the Linear statistical, the results are usually unreliable in the case of non-linear correlation and the uneven distribution of calibration set samples[7]. When stepwise regression method introduces or removes an independent variable at each step, the independent variables from these steps all need a significant test (F test). MWPLS method need to select the appropriate width of the window. And stochastic optimization methods include genetic algorithms, simulated annealing algorithm, and particle swarm optimization, among others. They should be made to ensure that the results are global optimum.
Interval Partial Least Squares (iPLS) method[8]can eliminate interval ranges that are poor correlative with each other, and conduct a preliminary location of the near infrared spectroscopy sub-intervals. Based on a combination of FiPLS and BiPLS[9], a crossover selection of spectral and modeling method, which is denoted as FB-iPLS, is proposed in the paper. This method combines the characteristics of FiPLS to select useful intervals and BiPLS and to delete useless intervals. The principal component of the model is selected through cross-validation. The optimal sequences of spectra from the FiPLS and BiPLS are selected based on the minimum cross-validation root mean square error (RMSECV). The both optimal sequences are combined after removing duplicate intervals. The spectral intervals with high amount of information associated with the tested component[10]is selected. The FB-iPLS can weaken the greedy search features of FiPLS and BiPLS. The experiments on predicting ethanol concentration show that the proposed method can further improve the prediction accuracy of the model compared with the conventional FiPLS and BPLS.
1 Materials and methods
1.1 Instruments and reagents
The infrared spectrometer produced by American PerkinElmer is adopted in the experiments. The range of wavenumber is 12 000~4 000 cm-1, the scanning times are 32, the resolution is 4 cm-1, and the interval number is 2 cm-1. The experimental instruments also include PC machine and the Germany Eppendorf manually pipette. The spectrometer software used to collect the spectral data is Spectrum Version 10.4.1. The chemical reagents ethanol and deionized pure water used in the experiments are of analytical grade. The indoor temperature is kept at about 25 ℃, humidity remained basically unchanged (less than 60%). Each sample is collected three times in parallel, and the original spectrum of the sample is the average of these three times.
1.2 Preparation of samples
Anhydrous ethanol and pure water are used to exactly formulate 162 of samples, with a capacity of 2 mL, concentration of 4.5%~85.0%, and 0.5% of the sample interval. And the samples are divided into two groups by SPXY method[16]with a ratio of 2∶1. The sample sizes of the calibration set and validation set are 108 and 54, respectively. Statistics of the ethanol contention in the samples are shown in Table 1. As can be seen, the concentration range of the validation set is included in the concentration range of the calibration set, which is compliance with the modeling standards.
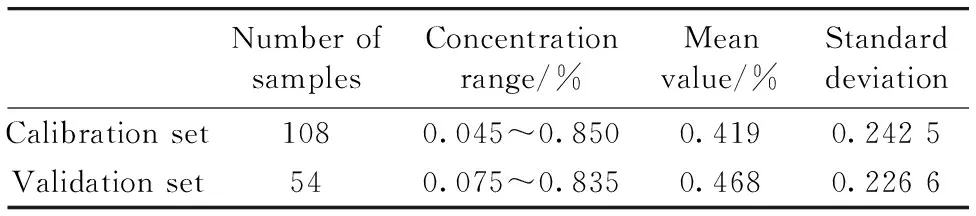
Table 1 Descriptive statistics for sample measurement
1.3 Spectral preprocessing
The near infrared absorption spectrum of 162 samples is shown in Figure 1(a). The maximum absorption peaks are at 5 162 cm-1, mainly for O—H stretching vibration, bending vibration, and a combination of C—H bending vibration of the absorption band, which is widely used for quantitative analysis of ethanol content in water.
As different spectral preprocess methods[17]have different impact on the performance of the model, the multiplicative scatter correction (MSC), standard normal variable transformation (SNV), SNV add to the trend method (DT), Savitzky-Golay smoothing convolution (SG), sliding window smooth (SW), first-order (1-Der) and second-order (2-Der) derivative spectra are used for all of the 162 samples. The results are shown in Table 2. As can be seen, PLS combined with SNV is the best, whereris 0.952 1, and RMSECV is 0.071 5. Figure 1(b) shows the spectrum that has been processed by SNV, from which, the spectral absorption peak increased and was more obvious, and more conducive to analysis of the spectrum. Therefore, SNV is selected as a pretreatment method for the followed comparative experiments.

Fig.1 (a) the Raw spectrum of samples;

Table 2 Modeling results of different preprocess methods
1.4 FiPLS and BiPLS methods
(1) FiPLS:
① To divide the entire spectral region intokintervals of the same width.
② To perform PLS model on each interval, thus obtainingklocal regression models.
③ To use RMSECV to measure the accuracy of the local models. The first selected interval is the one which corresponds to the local model with the highest accuracy. Efforts should be made to take this local model as the first sub-model.
④ Combine the remaining (k-1) intervals individually with the first selected interval, and then get (k-1) local models. The second selected interval is the one which corresponds to the local model with the highest accuracy. The local model should be made the second sub-model. And then repeat the process until all intervals are combined.
⑤ To test the RMSECV value of each sub-model from steps ②—④, and choose the best one (whose RMSECV is the lowest) as the final model. Thus the finally selected intervals are these which are used in the final model.
(2) BiPLS:
① To divide the entire spectral region intokintervals of the same width.
② To remove one interval from all of thekintervals individually, and establish PLS model with the remaining (k-1) intervals. That gives rise to k local models, which are built by (k-1) intervals.
③ To use RMSECV to measure the accuracy of these local models. The first removed interval is the one which corresponds to the local model with the highest accuracy. To take this local model as the first sub-model.
④ To individually remove one interval from the (k-1) intervals which are remained in the first sub-model, and establish PLS model with the remaining (k-2) intervals. Thus to get (k-1) local models, which are built by (k-2) intervals. The second removed interval is the one which corresponds to the local model with the highest accuracy. To take this local model as the second sub-model. To repeat the process until only one interval remained.
⑤ This step is the same as FiPLS.
1.5 The proposed method
As FiPLS and BiPLS are greedy search methods, which cannot guarantee the selected characteristic intervals are the best. Therefore, the selected intervals are not good to indicate the analyte information. Accordingly, an interval selection method, FB-iPLS is proposed in the paper, which is combined with the features of FiPLS and BiPLS. It is described below.
The entire spectral region is divided intokintervals with the same width. The first sub-model of FiPLS is gotten by using the FiPLS to select one interval, while the first sub-model of BiPLS is gotten by using the BiPLS to remove one interval. The second sub-model is gotten from the remaining (k-2) (the selected interval is different from the removed interval) or (k-1) (the selected interval is the same as the removed one) intervals. We can use FiPLS to select the second interval which can help to get the highest accuracy with the first selected interval above for modeling. Likewise, the second interval of BiPLS is selected by removing the one. To repeat the process until only one interval remained or no remaining intervals. The final sub-models with the highest accuracy of FiPLS and BiPLS are selected. The intervals of both final models are combined after removing the duplicate intervals, which are the final characteristics for FB-iPLS model.
The proposed method selects the target intervals of a two-way choice, which can weaken the greedy search feature of FiPLS and BiPLS, and further improve the accuracy of the model. The schematic diagram of FB-iPLS is showed in figure 2, where the selected intervals of FiPLS and the remaining intervals of BiPLS are the target intervals.

Fig.2 The schematic diagram of the FB-iPLS algorithm
2 Experimental results and analysis
2.1 Model of FB-iPLS, BiPLS, FiPLS
The interval divisions of different size have different impacts on the performance of the model. So when the division number is too small, it may degenerate into full-spectrum PLS algorithm, while when the number is too big, the amount of computation will be increased. In this study, the number of intervals is set from 20 to 65, at an interval of 5, and a total of 10 data points. The principal component is selected by 10-fold cross-validation. The optimal spectral for modeling is selected based on the value of RMSECV. Table 3 shows the results of the three models under different number of intervals.
As can be seen from table 3, the averagerof calibration set and validation set of the proposed method are 0.967 8 and 0.962 0 respectively, and the average RMSECV are 0.059 2 and 0.059 5. The averagerof BiPLS are 0.972 0 and 0.958 3, and the average RMSECV are 0.056 8 and 0.064 9. The averagerof FiPLS are 0.967 4 and 0.954 6, and the average RMSECV are 0.061 0 and 0.065 1. The results of calibration set of these three methods are similar. But for the validation set, the results of FB-iPLS are better than BiPLS and FiPLS. The reason may be that, FB-iPLS not only selects useful intervals according to FiPLS (which are only selected into, with poor adaptability, but an increasing stability), but also removes useless intervals according to BiPLS (which are only removed out, with good adaptability, but a weakening stability). FB-iPLS weakens the greedy search features of BiPLS and FiPLS, and enhances the stability and adaptability of the model, so it can get better prediction results.
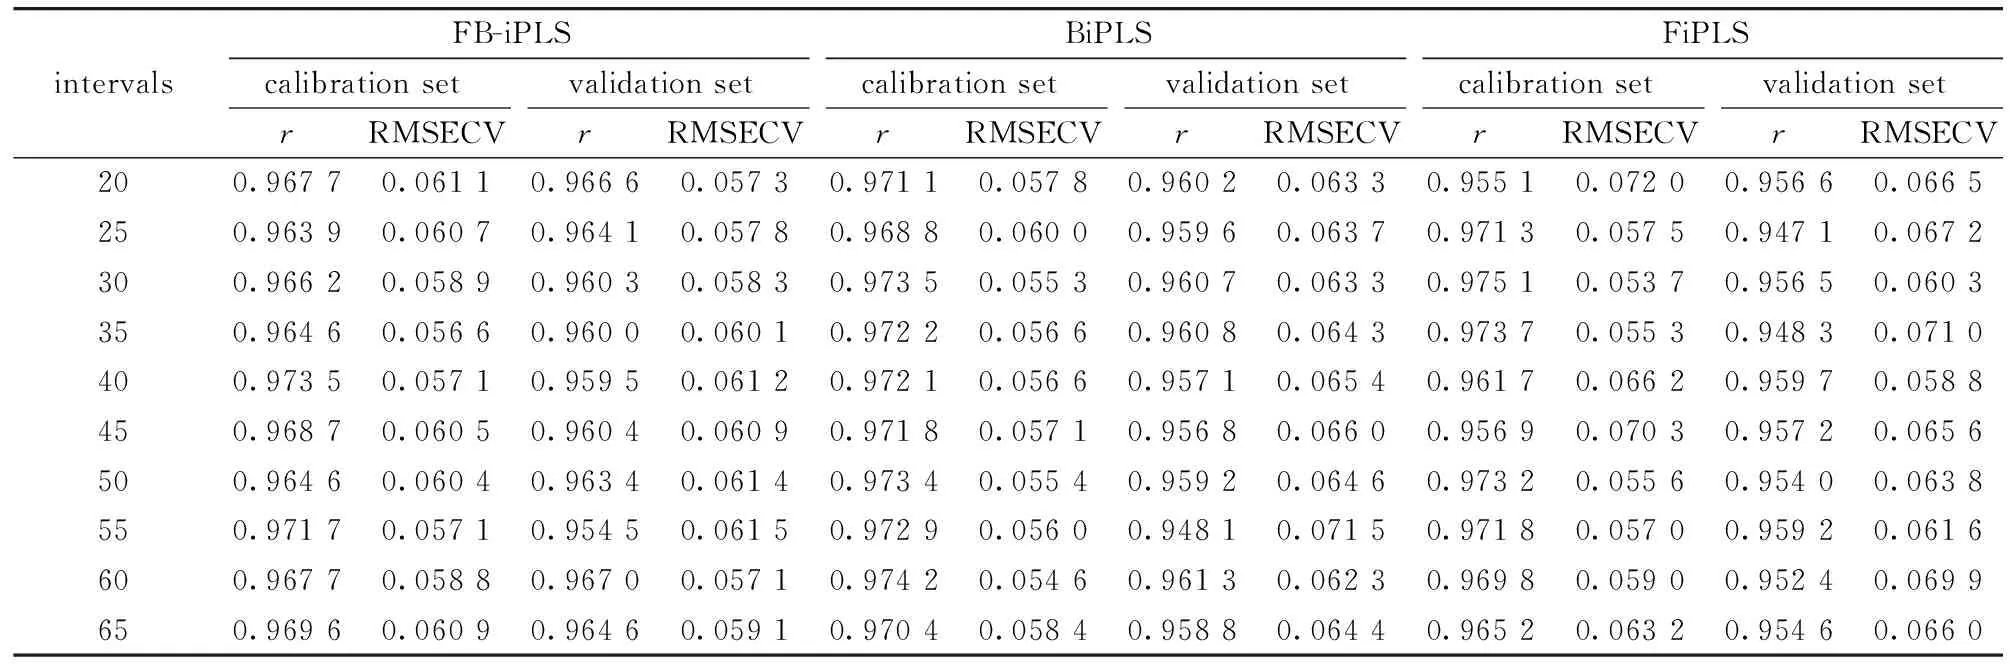
Table 3 The model results of different number of intervals
2.2 Comparative analysis of the best and worst results
The bold data in table 3 represent the best and worst results among different number of intervals of these three methods, where both FB-iPLS and BiPLS get the best results at the intervals of 55, and get the worst results at the intervals of 60. FiPLS gets the best results at the intervals of 40, and gets the worst results at the intervals of 25. Table 4 shows the best and worst comparison results of these three methods.
From table 4, the selected intervals of BiPLS are few, which may lead to inadequate useful information for modeling, and the prediction result is poor. The number of intervals and principal components that are selected by FiPLS are large, which may cause the model to be too complicated. Relatively, the selected number of variables and principal components of FB-iPLS are moderate. The best and worst R of FB-iPLS are 0.967 0 and 0.954 5, respectively, both higher than BiPLS (0.961 3 and 0.948 1) and FiPLS (0.959 5 and 0.947 1). And the best and worst RMSECV of FB-iPLS are 0.057 1 and 0.061 5, respectively, both lower than BiPLS (0.062 3 and 0.071 5) and FiPLS (0.058 8 and 0.067 2).

Table 4 The best and worst model results
Figure 3 shows the selected interval regions by the proposed method. When the spectral is divided into 60 intervals, results will be the best. The serial numbers are 3,4,5,6,7,8,9,10,11,14,15, 16,17,33,37,46,51, and the corresponding spectral regions are 11 734~10 534, 10 268~936, 7 740~7 608, 7 208~7 076, 6 012~5 818, 5 348~5 214 cm-1.
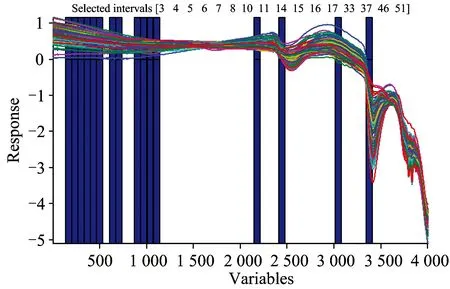
Fig.3 The selected intervals by FB-iPLS

Fig.4 The best prediction results of FB-iPLS
And Figure 4 shows the prediction result of the proposed method.
3 Conclusions
Compared with full spectrum modeling, both FiPLS and BiPLS can effectively select the characteristic variables and remove redundancy. Although the accuracy of the modes is relatively high, FiPLS is a method for intervals that is only selected into, and BiPLS intervals that are only remove out. Both of them are of a strong feature of greedy search, and need to be further optimized. As an interval selection method, FB-iPLS is proposed in this paper based on the combination of the two methods. During the process of selection, the corresponding spectral regions are selected and removed at the same time, which can effectively weaken the greedy search features and enhance the stability and effectiveness of the model. For investigating the impacts of the different interval size on the model results, the experiments on comparing the accuracy of the three models under different size of intervals are conducted. The results show that the average prediction accuracy of FB-iPLS is higher than that of BiPLS and FiPLS, and the best and worst prediction accuracy of FB-iPLS are also higher than the other two methods. The proposed method can be effectively used in quantitative analysis for spectral modeling.
[1] SUN Hong-ye. Changchun University of Science and Technology, 2014.
[2] Mall U, Wohler C, Grumpe A, et al. Advances in Space Research, 2013.
[3] Teye E, Huang X, Lei W, et al. Food Research International, 2014, 55: 288.
[4] JIA Sheng-yao, TANG Xu, YANG Xiang-long, et al. Spectroscopy and Spectral Analysis, 2014, 34(8): 2070.
[5] FAN Shu-xiang, HUANG Wen-qian, LI Jiang-bo, et al. Spectroscopy and Spectral Analysis, 2014, 34(8): 18.
[6] SHI Ji-yong, ZHOU Xiao-bo, ZHAO Jie-wen, et al. Journal of Infrared and Millimeter Waves, 2011, 5: 458.
[7] CHU Xiao-li. Molecular Spectroscopy Analytical Technology Combined with Chemometrics and Its Applications. Beijing: Chemical Industry Press, 2011. 4.
[8] Suhandy D, Yulia M, Ogawa Y, et al. Engineering in Agriculture, Environment and Food, 2013, 6(3): 111.
[9] ZHOU Xiao-bo, ZHAO Jie-wen, HUANG Xing-yi. Chinese Mechanical Engineering Society,2006. 6.
[10] WANG Chun-peng, YU Zuo-jun, MENG Fan-qiang. Journal of Chemical Industry and Engineering, 2013, 12: 4592.
[11] ZHAN Xiao-ri, ZHU Xiang-rong, SHI Xin-yuan, et al. Spectroscopy and Spectral Analysis, 2009, 29(4): 964.
*通讯联系人
O657.3
A
基于向前和向后间隔偏最小二乘的特征光谱选择方法
瞿芳芳1,任 东1*,侯金健1,2,张 忠1,陆安详2,王纪华1,2,许弘雷3
1. 三峡大学计算机与信息学院,湖北 宜昌 443002 2. 北京农业质量标准与检测技术研究中心,北京 100097 3. Department of Mathematics and Statistics, Curtin University, Perth 6845, Australia
在近红外光谱分析中,向前间隔偏最小二乘法(FiPLS)和向后间隔偏最小二乘法(BiPLS)是常用的基于波长变量选择的建模方法,其模型精度较高,但贪婪搜索特性较强,导致选出的波段并不能较好地反映待测成分的信息。针对该问题,提出一种基于两者组合策略的光谱特征波段选择方法(FB-iPLS)。在光谱分段的基础上,既利用FiPLS选取有用波段,同时利用BiPLS删除无用波段,来交互执行特征变量的选择与删除,对目标特征波段进行双向选择,用于提高模型的稳健性。用该方法建立水中乙醇含量的定量预测模型,并与FiPLS和BiPLS算法对比。由于光谱分段大小会对模型的结果有影响,该实验还考查这三种方法在不同光谱分段处的结果。在光谱划分60段时,提出的FB-iPLS方法取得最佳预测性能,其校正集与验证集相关系数r分别为0.967 7,0.967 0,交互验证均方根误差RMSECV分别为0.088 8,0.057 1。与FiPLS和BiPLS相比,该方法无论在不同光谱分段区间还是在各自最优与最差分段处,模型的整体预测性能都有所提高。实验结果表明,提出的方法能改善BiPLS与FiPLS贪婪搜索的特性,对特征波段的选取更高效、更具代表性,能进一步提高模型的预测性能。
近红外光谱; FiPLS; BiPLS; FB-iPLS; 贪婪搜索; 特征波段
2014-11-25,
2015-04-20)
2014-11-25; accepted: 2015-04-20
The National Science and Technology Projects in Rural Areas (2014BAD04B05), Natural Science Foundation of China (41371349)
10.3964/j.issn.1000-0593(2016)02-0593-06