介质阻挡放电中超四边斑图沿面放电的光谱研究
2016-06-15牛雪姣董丽芳冯建宇
牛雪姣,董丽芳,刘 莹,王 谦,冯建宇
河北大学物理科学与技术学院,河北 保定 071002
介质阻挡放电中超四边斑图沿面放电的光谱研究
牛雪姣,董丽芳*,刘 莹,王 谦,冯建宇
河北大学物理科学与技术学院,河北 保定 071002
利用水电极介质阻挡放电装置,在氩气和空气的混合气体中,首次观察到了超四边斑图沿面放电,它是由中心点和暗点组成的。通过观察普通相机的斑图照片,可以发现中心点位于周围四个暗点的中心处。利用高速录像机对斑图进行短曝光拍摄,观察发现中心点对应体放电,暗点对应沿面放电,暗点由这些沿面放电形成。中心点和暗点的亮度有所不同,这说明中心点和暗点的等离子体状态可能不同。采用发射光谱法,研究了超四边斑图沿面放电的的中心点和暗点的等离子体参量随氩气含量的变化趋势。利用氮分子第二正带系(C3Πu→B3Πg)发射谱线,计算得出了中心点和暗点的分子振动温度; 然后通过氩原子696.57nm(2P2→1S5)谱线的展宽,研究了中心点和暗点的电子密度。实验结果表明: 在相同氩气含量下,暗点的分子振动温度和电子密度均高于中心点的相应等离子体参量; 在其他实验条件不变的情况下,随着氩气含量从90%增大到99.9%,中心点和暗点的分子振动温度和电子密度均逐渐增大。结果表明中心点和暗点的等离子状态不同,说明二者的放电机制可能不同。
介质阻挡放电; 沿面放电; 分子振动温度; 电子密度
引 言
介质阻挡放电(无声放电),是一种低温等离子体气体放电。它的主要部分是两个平行放置的水电极。通过在水电极两端加上交流电压驱动,当电压可以达到气体放电的击穿阈值时,这样两极板间的气体被击穿后形成放电等离子体。介质阻挡放电可以在大气压或者近大气压条件下进行,并且装置简单、成本低及操作便捷等特点,广泛应用于众多工业领域中[1-5]。介质阻挡放电是一个非线性系统,可以自组织的形成多种多样的斑图,比如: 四边形,六边形,白眼,蜂窝等[6-8]。介质阻挡放电的放电形式可分为两类: 体放电(VD)和沿面放电(SD)。对于这两种放电的研究已有很多被报道,但对它们的放电性能的研究较少[9-11]。最近研究发现了一种特殊形状的斑图,它由中心点和暗点构成,并且每个中心点位于周围四个暗点的中心,在以往的介质阻挡放电研究中没有报道过。为了进一步的了解它的放电特性,采用了发射光谱法,对中心点和暗点的等离子体参量随氩气含量的变化进行了研究。其实验结果表明,体放电和沿面放电属于不同的放电机制,这对于研究暗点的形成机制有重要的价值。
1 实验部分
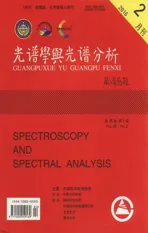
装置如图1所示,主要由水电极、高压电源、光谱仪、数字示波器组成。水电极由两个端面对称且装满水的圆柱形玻璃管组成,两侧用石英玻璃封住。在容器两端将金属环浸入水中,各从一端引出频率为54kHz的高压交流电源两极相连。将水电极平行放置在充满氩气和空气混合物的真空密闭室里,中间放一块边长L为4 cm, 厚度d为4.1 mm的四边形边界。用数码相机(Canon Powershot G16)记录放电照片。利用高压探头(Tektronix P6015A)测量外加电压,并通过数字示波器(Tektronix DPO4104B)采集和存储。通过透镜放大成像,利用光纤探头将中心点和暗点的光分别导入到光谱仪(ACTON SP-2758, CCD:1340×400Pixels, 光栅300, 800, 2 400 G·mm-1, 分辨率0.005 nm),控制计算机采集和存储光谱。用高速录像机(pco. dimax 9000000207)拍摄短曝光时间斑图照片。
Fig.1 Schematic diagram of the experimental setup
2 结果与讨论
在氩气和空气混合的气体介质阻挡放电中,观察到斑图不同位置出现两种亮暗不同的状态,如图2所示。由普通相机拍摄的图2(a)可知,斑图有两部分组成: 中心点和它周围的四个暗点。但是它们的亮度不同,表现为: 中心点(A)最亮,暗点(B)最弱。由之前研究的斑图可知,暗点一般是由放电丝组成的。为了进一步研究本斑图中暗点的组成,故利用高速录像机对斑图进行短曝光拍摄,如图2(b)所示。观察发现,放电由两部分组成: 体放电(VD)和沿面放电(SD)。中心点对应体放电,暗点对应沿面放电,暗点是由中心点周围的沿面放电形成。根据存在亮暗的差异,初步推断它们可能处于不同的等离子状态,即它们的等离子体参数是不同的。因此,采用发射光谱法,对其等离子体参量进行测量,以便进一步研究其放电机制。

Fig.2 (a) the image of square super-lattice pattern with central spot and dim spot. A represents the central spots and B represents the dim spots. Image taken by an ordinary camera with exposure time t=25 ms. (b) Image of the pattern with 20 μs exposure time taken by high speed video camera. Experimental parameters: gas pressurep=30.6 kPa, air concentrationφ=97%, driven frequencyf=54 kHz, gas gapd=4.1 mm
为了得到氮分子振动温度,选择300 G·mm-1的光栅,采集了氮分子第二正带系(C3Πu→B3Πg)波长范围在360~420nm之间的发射谱线,如图3所示。从图中可得,中心点的强度高于暗点的。采用第二正带系的两组振动序带: (0-2,1-3,2-4)和(0-3,1-4,2-5)[11],计算得出了超四边斑图的中心点和暗点的分子振动温度,如图4所示。当氩气含量相同时,暗点的分子振动温度要高于中心点的。在其他实验条件不变的情况下,随着氩气含量由90%增大至99.9%,中心点和暗点的分子振动温度都随着氩气含量的增加而增大。中心点的分子振动温度范围是2 200~2 700K,暗点的分子振动温度范围是2 300~3 000K。

Fig.3 Emission spectra in the range of 360~420 nm

Fig.4 Variation of molecular vibration temperature of two kinds of spots as a function of argon concentration
表征等离子体状态的另一个重要的参量是电子密度。选用2 400 G·nm-1的光栅,在693~700 nm范围内采集了中心点和暗点的谱线,如图5所示。由图可知,在相同的实验条件下,暗点的谱线展宽高于中心点的。通过改变氩气含量,研究了中心点和暗点的谱线线宽随氩气含量的变化,其结果图6所示。谱线的展宽可反映电子密度大小[12],谱线展宽越大,表明其电子密度越大。所以由实验结果可知,在相同含量的条件下,暗点的电子密度高于中心点,随着氩气从90%增大至99.9%,中心点和暗点的电子密度随着氩气含量的增加而增大。

Fig.6 Variation of broadenings of spectral line 696.5 nm of two kinds of spots as a function of argon concentration
3 结 论
采用水电极介质阻挡放电装置,在空气和氩气的混合气体中,观察到了超四边斑图的沿面放电,它是由中心点和位于其周围四个暗点组成,并且中心点位于四个暗点的中心。利用高速录像机对斑图进行短曝光拍摄,发现中心点存在沿面放电,暗点是由中心点的沿面放电形成。采用发射光谱法,研究了中心点和暗点的等离子体参量随氩气的变化关系。实验发现: 当氩气含量相同时,暗点的分子振动温度和电子密度均高于中心点相应的等离子体参量; 随着氩气含量从90%增大到99.9%,中心点和暗点的分子振动温度和电子密度均是逐渐增大的。实验结果对更加深入研究体放电和沿面放电之间的关系具有重要意义。
[1] Eliasson B, Kogelschatz. IEEE TRANS. Plasma Science, 1991, 19(2): 309.
[2] Kogelschatz U. Plasma Chemistry and Plasma Processing, 2003, 23(1): 1.
[3] Dong Lifang, Yin Zengqian, Li Xuechen, et al. Plasma Sources Science and Technology, 2014, 13: 164.
[4] NIU Zheng, SHAO Tao, ZHANG Cheng, et al(牛 铮,邵 涛,章 程,等). High Voltage Engineering(高电压技术), 2011, 37(6): 1536.
[5] Uhm H S, CHoi E H, Lim Y. Appl. Phys. Letts., 2002, 80(5): 737.
[6] CHEN Jun-ying, DONG Li-fang, LI Yuan-yuan, et al(陈俊英,董丽芳,李媛媛,等). Acta Physica Sinica(物理学报), 2012, 61(7): 075211.
[7] Fan Weili, Dong Lifang, Zhao Haitao, et al. IEEE Transaction on Plasma Science, 2009, 37(6): 1016.
[8] Breazeal W, Flynn K M, Gwinn E G. Phys. Rev. E, 1995, 52: 1503.
[9] Herzberg G. Molecular Spectra and Molecular Structure Ⅰ. Spectra of Diatomic Molecules. Translated by WANF Ding-chang(王鼎昌,译). Beijing: Science Press(北京: 科学出版社), 1983. 155.
[10] Kogelschatz U. Journal of Physics: Conference Series, 2010, 256: 012015.
[11] DONG Li-fang, ZHAO Long-hu, WANG Yong-jie, et al(董丽芳,赵龙虎,王永杰,等). Spectroscopy and Spectral Analysis(光谱学与光谱分析), 2014, 34(2): 308.
[12] DONG Li-fang, ZHU Ping, YANG Jing, et al(董丽芳,朱 平,杨 京,等). Spectroscopy and Spectral Analysis(光谱学与光谱分析), 2014, 34(4): 915.
*Corresponding author
Study on Square Super-Lattice Pattern with Surface Discharge in Dielectric Barrier Discharge by Optical Emission Spectra
NIU Xue-jiao, DONG Li-fang*, LIU Ying, WANG Qian,FENG Jian-yu
College of Physics Science and Technology, Hebei University, Baoding 071002, China
Square super-lattice pattern with surface discharge consisting of central spots and dim spots is firstly observed in the mixture of argon and air by using a dielectric barrier discharge device with water electrodes. By observing the image, it is found that the central spot is located at the centriod of its surrounding four dim spots. The short-exposure image recorded by a high speed video camera shows that the dim spot results from the surface discharges (SDs). The brightness of the central spot and is quite different from that of the dim spot, which indicates that the plasma states of the central spot and the dim spot may be differentiated. The optical emission spectrum method is used to further study the several plasma parameters of the central spot and the dim spot in different argon content. The emission spectra of the N2second positive band (C3Πu→B3Πg)aremeasured,fromwhichthemoleculevibrationtemperaturesofthecentralspotandthedimspotarecalculatedrespectively.Thebroadeningofspectralline696.57nm(2P2→1S5) is used to study the electron densities of the central spot and the dim spot. It is found that the molecule vibration temperature and electron density of the dim spot are higher than those of the central spot in the same argon content. The molecule vibration temperature and electron density of the central spot and the dim spot increase with the argon content increasing from 90% to 99.9%. The surface discharge induced by the volume discharge (VD) has the determinative effect on the formation of the dim spot. The experimental results above play an important role in studying the formation mechanism of surface discharge of square super-lattice pattern with surface discharge. In addition, the studies exert an influence on the application of surface discharge and volume discharge in different fields.
Dielectric barrier discharge; Molecule vibration temperature; Electron density; Surface discharge
Jan. 30, 2015; accepted May 6, 2015)
2015-01-30,
2015-05-06
国家自然科学基金项目(11375051), 河北省科技厅重点项目(11967135D)和河北省教育厅重点项目(ZD2010140)资助
牛雪姣, 女, 1988年生, 河北大学物理科学与技术学院硕士研究生 e-mail: nxj1228@126.com *通讯联系人 e-mail: donglfhbu@163.com
O461.2; O433.4
A
10.3964/j.issn.1000-0593(2016)02-0368-04