A comprehensive fractal char combustion model☆
2016-06-12YutingLiuRongHe
Yuting Liu *,Rong He
1 Department of Thermal Engineering,Tsinghua University,Beijing 100084,China
2 Institute of Materials,China Academy of Engineering Physics,Mianyang 621908,China
1.Introduction
The char particles are typical porous media with complex pore structures[1–3],so the combustion reactions can occur at both the external and the internal surfaces of the char particle.What's more,the pore structure in the char particles changes greatly during combustion[3].Many factors affect char combustion including the gas diffusion in the char pores,catalysis or inhibition effects of the ash,graphitization of the char and so on,among which the pore diffusion is the most important[4].The pore diffusion and the chemical reactions inside the pores are coupled with each other[5]which increases the complexities of the char combustion modeling.Since the char particle pore structure determines the pore diffusion resistance[2]and affects the collisions between the gas molecules and the pore surfaces,the pore structure significantly affects the char combustion kinetics[4,6].
However,the char pore structures are too complex to describe with the classical geometric method[7],so the fractal theory has been used instead[1,7–13].The fractal dimension of the char pore structures,Df,based on mercury intrusion measurements[7]is the most representative one:

whererporeis the char pore radius(m)andSa(rpore)is the accumulated pore surface area(m2)corresponding to rporein the mercury intrusion measurements.Dfdescribes the complexity of the char pore structures with a largerDfindicating a more complex structure and a higher pore diffusion resistance.The gas diffusion in a bulk space can be described by Fick's diffusion law.However,in small char pores with pore sizes close to the gas molecular mean free path,the gas molecular motion is restricted and the collision frequency between the gas molecules and the pore surface is much higher than the intermolecular collision frequency.In this situation,Fick's diffusion law is not suitable[14–16].In either case,fractal theory can be used to describe the pore diffusion effects.
The pore diffusion effects have been extensively included in various char combustion models among which the traditional intrinsic model[6,17,18]is the most famous one.The tortuosity factor,τ,is used to describe the complexity of the pore structures in the intrinsic model.However,τ has no scientific definition and cannot be measured or calculated which makes the intrinsic model difficult to use.In the intrinsic model,the pore diffusion is described by the Fick's and Knudsen's diffusion law both of which cannot be conveniently used for the fractal char pores[14–16].In addition,the intrinsic model does not include the evolution of the char pore structure during combustion.
In this article,a comprehensive fractal char combustion model was developed.The apparent reaction order,n,during combustion was allowed to vary.Four parameters(porosity,θ,specific surface area,Sg,fractal dimension Dfand particle diameter,dp)were used to describe the char pore structures with these parameters also allowed to vary during combustion.The model gives reasonable predictions of the CO/CO2ratio in the combustion products.A correction factor,α,was introduced to describe the effect of the high CO2concentration on the total char combustion rate to expand the scope of the char combustion model.Eleven different chars were combusted in two drop tube furnaces with the conversions of the partly burned char samples measured using thermogravimetric analysis.The combustion processes of these chars were then simulated by the model with the predicted char conversions compared with the measured data to determine the model parameters and verify the model.Finally,the model was used to study some phenomena in the char combustion.
2.Development of the Comprehensive Char Combustion Model
The comprehensive char particle combustion model in this article consists of five parts with the char combustion rate expression,the char particle pore structure evolution,the variation of the apparent reaction order,the CO/CO2ratio in the combustion products and the correction factor for oxy-char combustion.The first four parts have already been studied by our research group[3–5,19]and they are combined with the fifth part in this paper to form a complete model.
2.1.Char combustion rate expression
Acharcombustion rate expression was developed from a theoretical derivation in[4].The coupling effects between the chemical reactions and the gas diffusion inside the char pores were considered.The final form of the char combustion rate expression is:

wherekais the apparent reaction rate constant,kiis the intrinsic reaction rate constant,Qis an intermediate variable,Aiis the preexponential factor,Eiis the intrinsic activation energy(J·mol-1),Tpis the particle temperature(K),Ris the universal gas constant,ζ is a scale factor,θ is the porosity,Sgis the specific surface area(m2·kg-1),ρiis the char true density(kg·m-3),dpis the particle diameter(m),Dfis the fractal dimension defined in Eq.(1),χ is a dimensionless modulus which is a combination of pore structure parameters to indicate the pore diffusion resistance with a largerχindicating a lower pore diffusion resistance[3–5].In Eq.(2),Ai,Ei,andζare model parameters to be determined from experimental data.
2.2.Char particle pore structure evolution during combustion
Fractal pore models[20]generated by a random walk algorithm can be used to simulate real char particles.Fig.1(a)shows a schematic diagram of a fractal pore model.The pore shapes in the model are irregular as in natural char particles(Fig.1(b))and the model also has good fractal properties.Thus,the fractal pore model is also called the numerical char particle model.The random walk process parameters can be adjusted to generate numericalchar particle models with various porosities and fractal dimensions.
The complete char combustion processes were simulated[3]with this numerical char particle model with four chemical reactions:

They were described by simple collision theory[21]with reaction rates expressed as:
Reaction rate=(Collision frequency)

Since the Fick's and Knudsen's diffusion law cannot be conveniently used for the fractal char pores[14–16],the diffusion law[22]based on the kinetic theory of gases[23]was used.
21 different numerical char particle models were used in the char combustion simulations with 756 cases in total for various operating conditions[3]to calculate the variations of the pore structure parameters(θ,Sg,Dfanddp)with the char conversion,X,during combustion.Commonly used empirical expressions with some modifications were then used to associate these pore structure parameters withX.Then,all the coefficients in each expression were related to the operating conditions and the initial pore structure parameters.Finally,the variations of the pore structure parameters during combustion were expressed as:
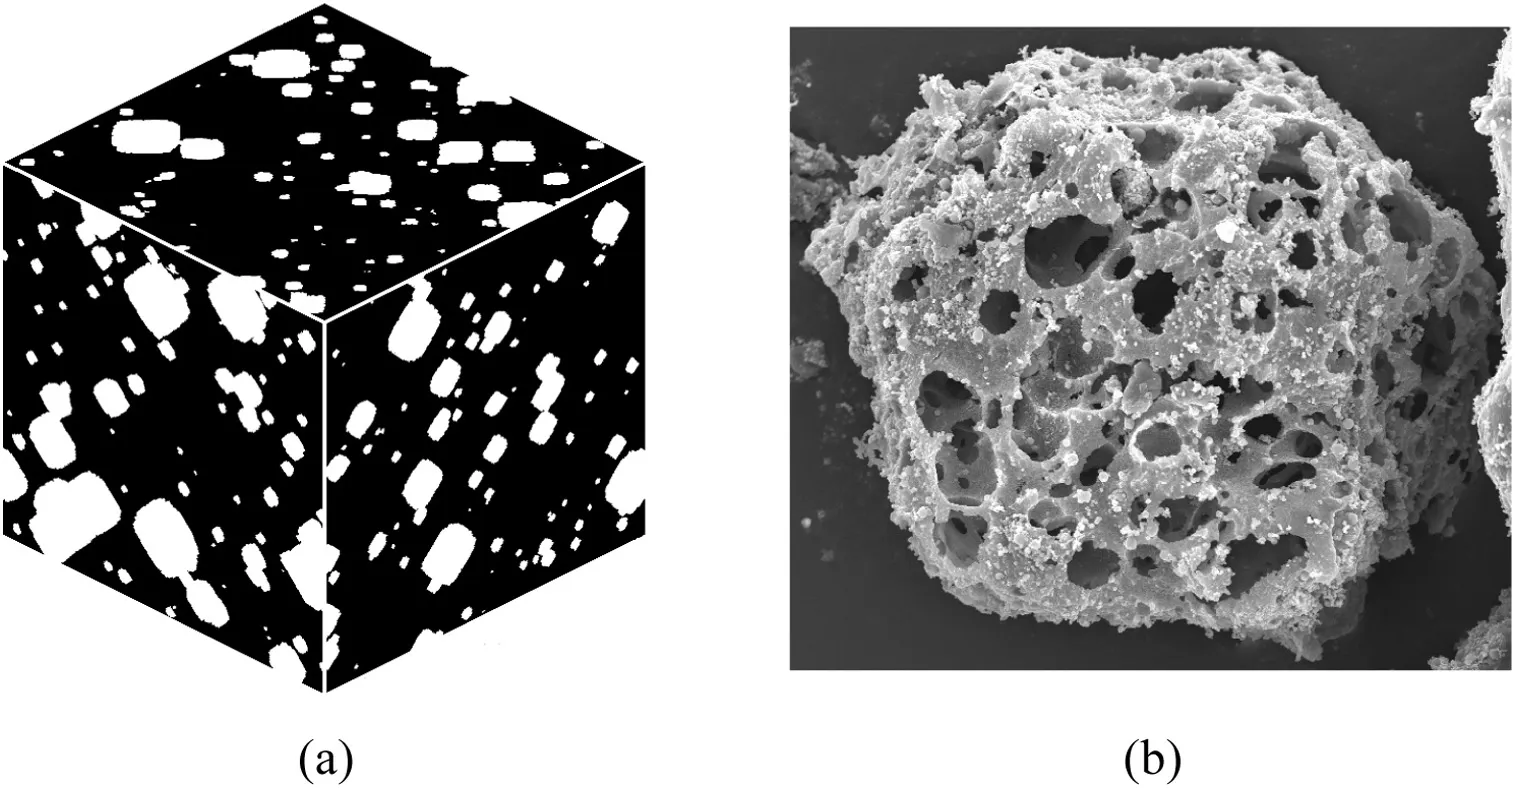
Fig.1.Schematic diagram of the fractal pore model(a)and SEM photo of a bituminous char particle(b).
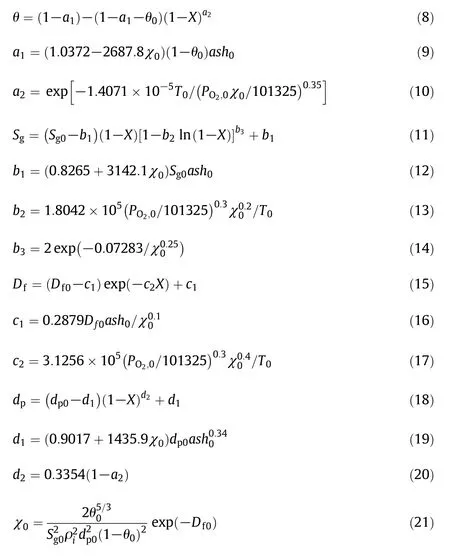
whereTis the temperature(K),PO2is the O2partial pressure at the particle external surface(Pa),ashis the ash content,Xis the char conversion,a1,a2,b1,b2,b3,c1,c2,d1andd2are constants for a given combustion process and the subscript 0 represents the initial value.
2.3.Variation of the apparent reaction order during combustion
The char combustion apparent reaction order,n,has been extensively studied in experiments,but only the values of n for specific chars for specific reaction conditions have been given and no clear universal relationships has been proposed[5,24].This may be the reason why the assumption n=1 is still commonly used in many simulations.
Recently,an expression fornwas developed for different chars and different reaction conditions from the numerical simulations with the expression validated by experimental data[5].The simulations used the numerical char particle model in Fig.1(a)and the chemical reactions and pore diffusion model described in Section 2.2.
10 different numerical char particle models were used in the char combustion simulations with 600 cases in total for various operating conditions[5].The values ofnin each case were obtained.First,the relationships betweennand the operating conditions were analyzed for each numerical char particle model to form 10 preliminary expressions.Then,the coefficients in the 10 expressions were correlated by introducing the effect of the particle category.Finally,the expression fornwas written as:

where Tpis the char particle temperature(K),PO2is the O2partial pressure at the particle external surface(Pa)and χ is the modulus which is the same as in Eq.(2).
2.4.Apparent CO/CO2 ratio in the combustion products
The apparent CO/CO2ratio in the combustion products is an important factor affecting the char combustion[19].Since the heat released when CO2is the combustion product is 3.5 times that when CO is the combustion product,a small difference in the apparent CO/CO2ratio will lead to differences of hundreds of degrees in the combustion temperature[25].Usually,the apparent CO/CO2ratio is thought to be a function of the char particle temperature,Tp,and the O2partial pressure at the particle external surface,PO2,based on experimental studies[26].
The simulations in Section 2.3 also gave the values of the apparent CO/CO2ratio by counting the numbers of CO and CO2molecules diffusing out of the numerical char particle[5].A correlation of the apparent CO/CO2ratio calculated in the simulations gave:

which is very close to the experimental results in[25].
2.5.Correction factor for oxy-char combustion
In oxy-char combustion,CO2is used as the background gas instead of N2.Since the physical properties of CO2and N2are very different and CO2is not an inert gas like N2,the char combustion characteristics in oxy-mode will be a little different.The existing studies[27,28]of oxy-char combustion focused on the effects of the high-concentration CO2in an external environment on the combustion temperature,the flame stability and so on,but the effects of the high-concentration CO2inside the char pores were usually ignored.In the complex char pores,the four chemical reactions in Eqs.(3)–(6)are coupled with each other.If the CO2concentration in the pores is excessive,the original balance will be broken.
Since the char combustion model in this paper included all the reactions within the char particle pores,a correction factor,α,was defined as:

whereRoxyis the charcombustion rate(mol·s-1)for the CO2background gas andRairis the char combustion rate(mol·s-1)for the N2background gas.Other operating conditions like the temperature,the O2concentration,and the charparticle model were the same when Roxyand Rairwere solved.In this way,the effect of using CO2instead of N2is reflected in α.
Then,the char combustion simulations were conducted to calculate α for the different operating conditions.10 different numerical char particle models(as shown in Fig.1(a))were used with the particle diameters and the pore structure parameters listed in Table 1.The chemical reactions and the pore diffusion were described in the same way as in Section 2.2.The simulation conditions are summarized in Table 2.The combustion simulations were conducted for each char particle model for each temperature and each atmosphere listed.Thus,there were 600 cases in total,with one half in air-mode(in an O2/N2atmosphere)and the other half in oxy-mode(in an O2/CO2atmosphere).The total pressure for all cases was 101.325 kPa.The simulations gave the total char combustion rate including the effects of the chemical kinetics and the pore diffusion for the corresponding operating conditions.Then,300 values of α were calculated using Eq.(24).
The C+CO2reaction rate is generally much lower than the C+O2reaction rate with the measurements giving a C+O2reaction rate that was 5 orders of magnitude higher than for the C+CO2reaction at1073 K and 10 kPa pressure[29].At higher temperatures,the difference was not so extreme,but the C+CO2reaction rate was still much lower than the C+O2reaction rate as long as comparable O2concentrations were present.So,the α obtained in the simulations were very close to 1.
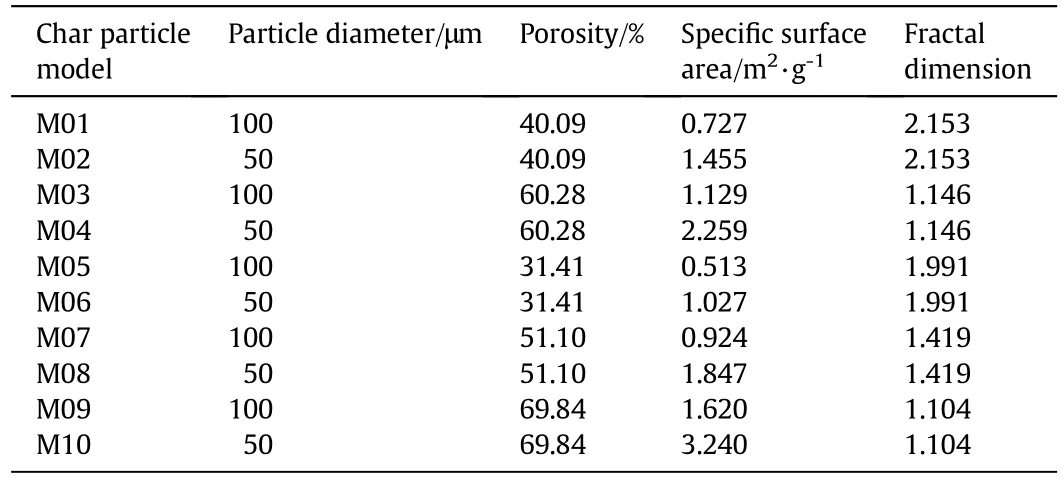
Table 1Particle diameters and pore structure parameters of the numerical char particle models

Table 2Simulation conditions for char combustion in air-mode and oxy-mode
At lower temperatures,α <1,while at higher temperatures,α >1.Also,the demarcation temperatures are different for different char particles.With lower O2partial pressures and higher CO2partial pressures,α differed more from 1.Thus,α was correlated as:

where PO2and PCO2are the partial pressures of O2and CO2at the char particle external surface(Pa),Tpis the particle temperature(K),andm1andm2are constants for a given char particle.The α calculated in the simulations were used correlated to obtain them1andm2listed in Table 3.
All the correlation coefficients in Table 3 are higher than 0.98,which shows the validity ofEq.(25).The values ofm1for all the chars are in the range of(6.02±0.017)×10-4with small standard deviations,so m1is set to 6.02×10⁻⁴for all the chars.m1seems to be a scale factor.However,m2changes greatly for the different char particles,so it cannot be taken as a constant.The major difference among the char particles is the pore structure which affects the diffusion and reactions in thepores.The modulus χ defined in Eq.(2)is a combination of the pore structure parameters andm2correlates well with the modulus χ with Fig.2 showing the relationship betweenm2and χ which is correlated as:

Table 3m1 and m2 for each numerical char particle model


Fig.2.Exponential relationship between m2 and χ.
Thus,the correction factor,α,has the following form:

The α calculated by Eq.(27)are compared with those obtained in the simulations in Fig.3.All the points are distributed along the diagonal which shows that the data correlation works well.
The physical properties of CO2are very different from those of N2.For example,the molar specific heat of CO2is significantly higher than that of N2and the O2diffusion coefficient in CO2is much lower than that in N2.Both factors restrict the char combustion in an O2/CO2atmosphere[27,28].Thus,the char combustion rate in oxy-mode is usually lower than that in air-mode.However,CO2is not inert,especially at high temperatures.As the temperature increases,the C+CO2reaction rate increases,so the char combustion rate in oxy-mode may exceed that in air-mode.
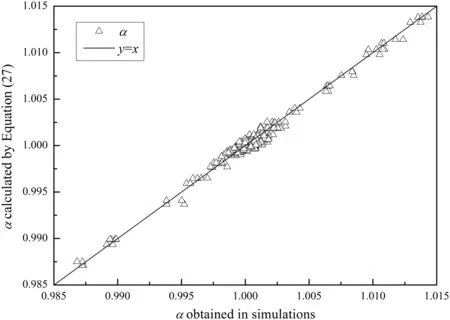
Fig.3.Data correlation results for α.
The transition process can be quantitatively described by defining a critical temperature based on Eq.(27)asTcritical=m2=258.45 exp(-59,051.09χ)+1123.3.WhenTp>Tcritical,the char combustion in oxy-mode is enhanced(α>1).WhenTp<Tcritical,the charcombustion in oxy-mode is reduced(α<1).Tcriticalis a characteristic of the char particle which only depends on the particle structure.When χ increases,Tcriticalwill decrease which indicates that the decreasing pore diffusion resistance tends to compensate for the slower oxy-char combustion caused by the lower O2diffusion coefficient in CO2.However,Tcriticalhas a limit of 1123.3 K.Thus,if the particle temperature is below 1123.3 K,the char combustion rate in oxy-mode will be always lower than that in air-mode.
These conclusions are only for the combustion process inside the char particle,without considering the effect of the bulk diffusion and the reactions in the bulk space.At the same time,only a very short combustion time was simulated since only the char combustion rate for the given operating conditions was needed.Thus,the environmental conditions did not change much in such a short time.As a result,the results do not show the effect of the lower combustion temperature caused by the higher CO2molar specific heat in oxy-mode.However,these factors will not affect the use of Eq.(27)in oxy-char combustion simulations as α only depends on the current conditions and α can be used in conjunction with some process simulation programs.α makes the char combustion rates in oxy-mode more accurate and makes the reaction process closer to the real situation.
2.6.Model summary
Sections 2.1–2.5 introduced the five parts of the char particle combustion model.Thus,the combustion rate(mol·s-1)of a char particle,Rs,can be expressed as:

where α is the correction factor for the oxy-char combustion given by Eq.(27),kais the apparent reaction rate constant described by Eq.(2),mis the char particle mass(kg),Sgis the specific surface area(m2·kg-1),ash is the ash content in the charparticle,Csis the O2concentration at the particle external surface(mol·m-3)andnis the apparent reaction order of the char combustion given by Eq.(22).The variations of all the pore structure parameters in Eqs.(2),(22),(27)and(28)during combustion are described by Eqs.(8)–(21).The apparent CO/CO2ratio in the combustion products is given by Eq.(23).All these model equations together can give a better description of the complex pore diffusion effects on the char combustion.
3.Drop Tube Furnace Experiments
Experiments were conducted[4]to determine the unknown model parameters(Ai,Eiand ζ)and to verify the model.
11 different chars were combusted in two drop tube furnaces(DTFs)with the proximate and ultimate analyses of the 11 parent coals listed in Table 4.These chars were divided into two groups with Nos.1–3 in Group 1 tested in furnace 1 and Nos.4–11 in Group 2 tested in furnace 2.The two furnaces were similar with the same schematic diagram shown as in Fig.4.Both furnaces had 50 mm inner diameters.The length of furnace 1 was 750 mm and the length of furnace 2 was 1000 mm.In furnace 1,the char particle injector was 310 mm from the inlet and the sampling points were distributed along the furnace tube to obtain char samples with different conversions.In furnace 2,the char particle injector was 200 mm from the inlet and the chars were only sampled at the furnace tube outlet.
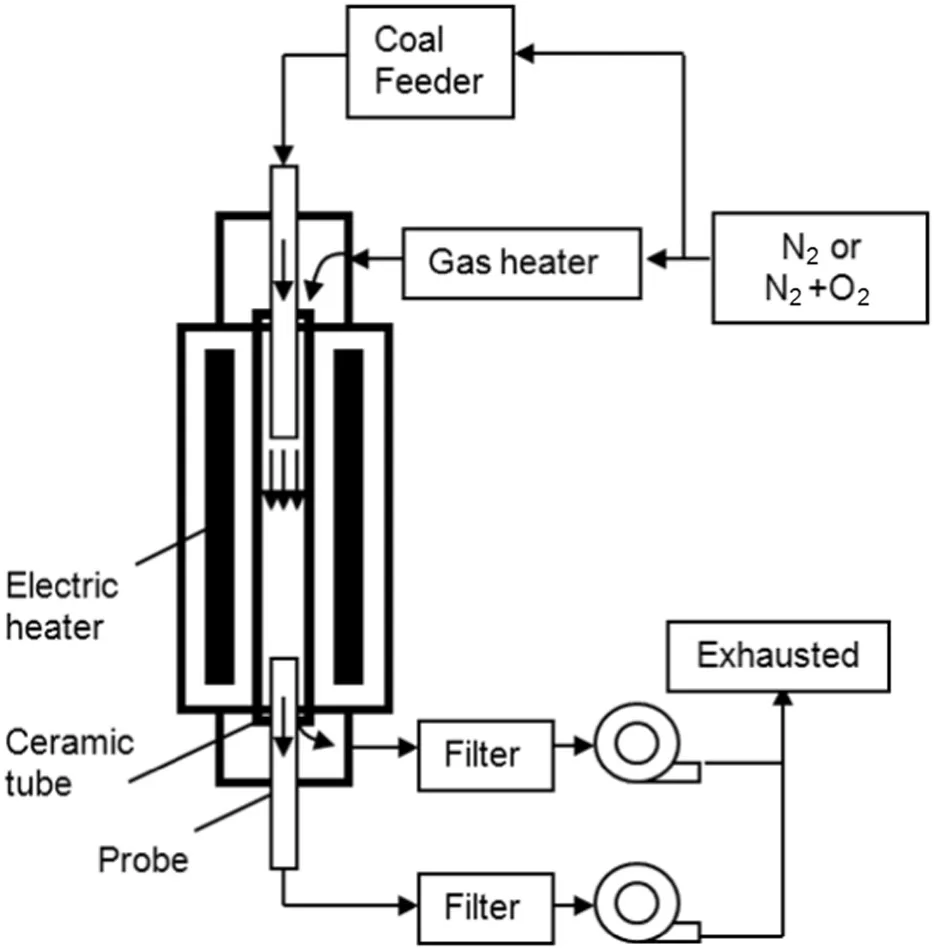
Fig.4.Schematic diagram of the drop tube furnace.
The chars were produced by pyrolysis of the parent coals in a N2atmosphere at around 1473 K in the drop tube furnaces.The experimental conditions for the char combustion are listed in Table 5.The conversions of the char samples,X,were calculated as:


Table 4Proximate and ultimate analyses of the parent coals
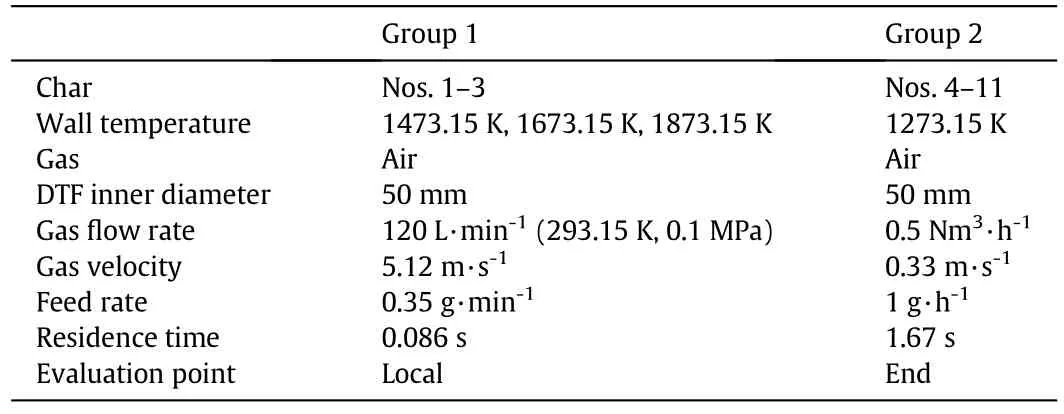
Table 5Drop tube furnace experimental conditions
whereash0is the initial ash content of the char andashis the ash content of the partly burned char sample both of which were measured by a Q500 thermogravimetric analyzer produced by TA Instruments,US.The measurement error of this analyzer was only±0.1%of the full scale.
The average charparticle diameters were measured by a Mastersizer 2000 Laser Particle Size Analyzer.This analyzer could measure particle sizes from 0.02 to 2000 μm and the measurement errors were less than 1%.Repeated measurements show differences of less than 0.5%.The char particle pore structure parameters(θ,SgandDf)were measured by an Autos can 33 mercury porosimeter with an operating pressure range of 0–232 MPa.The smallest pore which this mercury porosimeter could measure was a diameter of 3.23 nm and the nonlinearity was±0.05%of the full scale.The measured average particle diameters and the pore structure parameters of the 11 chars listed in Table 6 were used in the following simulations.The measured pore structure parameters were only for the large pores,while the small pores which nearly had no effect on the char combustion were excluded[1,7].

Table 6Measured average particle diameters and pore structure parameters of the 11 chars
4.Model Validation
Since the flow in the drop tube furnace was a typical gas–solid two phase flow,the Euler–Lagrange approach was used to simulate the drop tube furnace experiments.The air was treated as a continuum described by the Navier–Stokes equations,while the char particles were tracked through the calculated flow field.The char particles exchange mass,momentum and energy with the air in the simulations.Since both the average particle diameters in Table 6 and the feed rates in Table 5 are very small,the interactions among particles and the effects of the particles on the flow field were assumed to be negligible.The detailed equations were given in[4].
A three-dimensional grid was generated for the cylindrical furnace tube with a total of 222,400 nodes as shown in Fig.5.The air entered the furnace at the gas inlet.The particle injector was inserted into the furnace in the experiments but its influence on the flow field was neglected.Thus,the particles were assumed to be injected from a particle source location in the furnace.
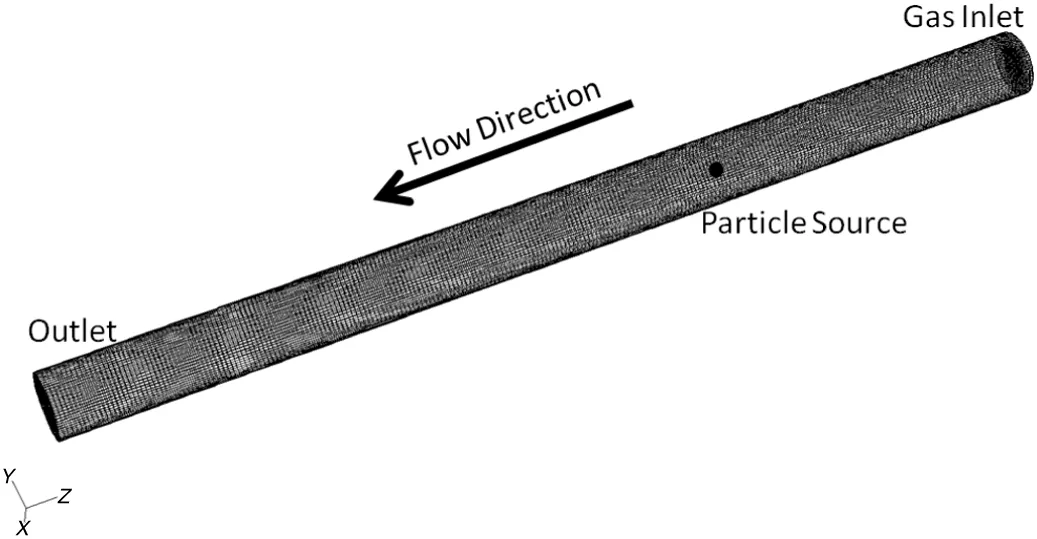
Fig.5.Grid for the drop tube furnace.
The combustion rates of each char particle were described by the model introduced in Section 2.The model parameters(Ai,Eiand ζ)given in[4]were initially used as the initial values.The predicted char conversions were then compared with the measured values(only used the experimental results of chars Nos.1–3)with the model parameters(Ai,Eiand ζ)adjusted by trial and error to minimize the differences.The final model parameters for all the chars were determined to be:which completes the char particle combustion model.The value ofEiis the same with that in[4,5],which reconfirms its physical meaning as the intrinsic activation energy.

Figs.6–8 compare the predicted char conversions with the experimental values for chars Nos.1–3 at all temperatures.The dots represent the measured char conversions and the lines represent the predicted char conversions.The good agreement shows that the comprehensive char particle combustion model is very accurate.Table 7 lists the root mean square errors of the predictions from the experimental results for both the present model and the model of He et al.[4]which shows that the present model gives a much better representation of the data.
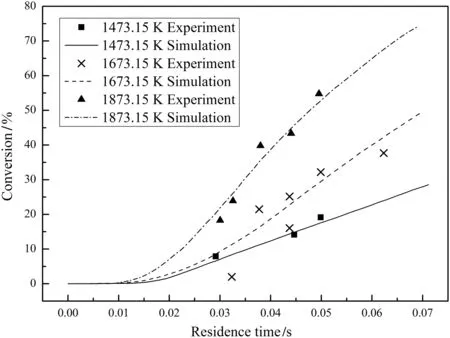
Fig.6.Measured and predicted conversions for char No.1.

Fig.7.Measured and predicted conversions for char No.2.
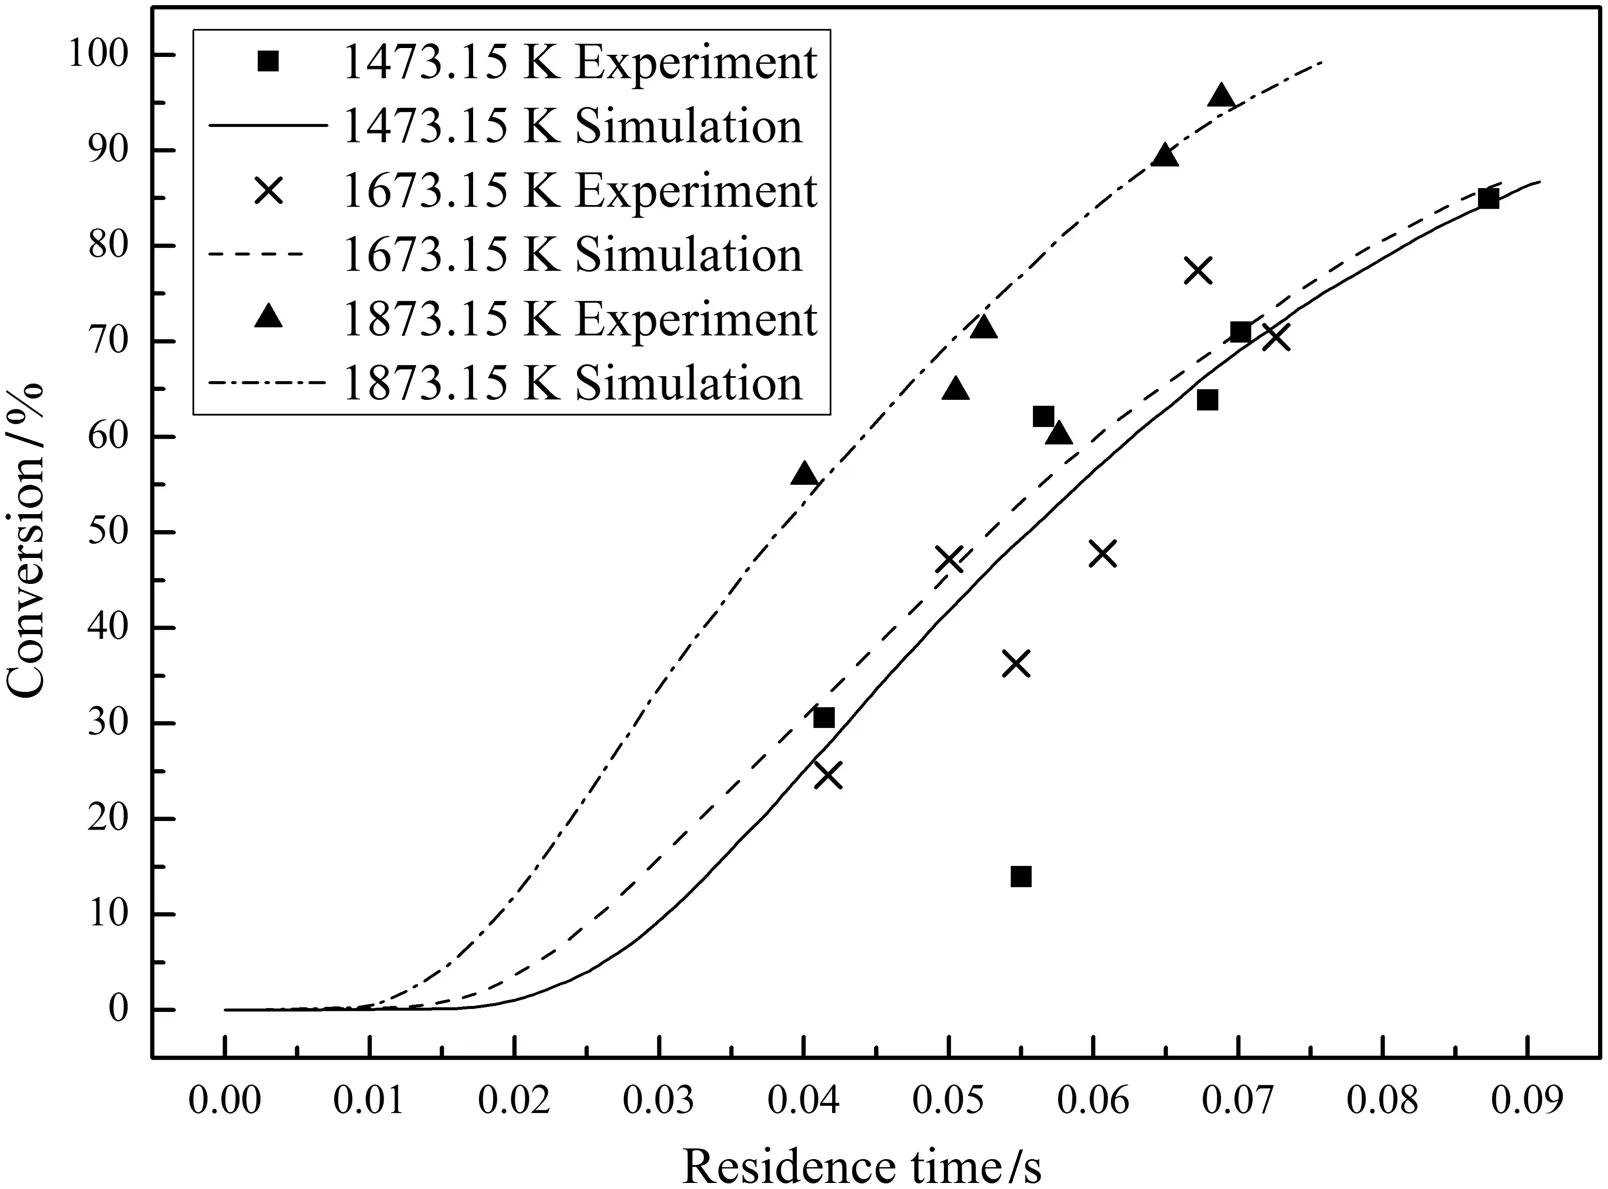
Fig.8.Measured and predicted conversions for char No.3.
Only the final conversions were measured for chars Nos.4–11 in the experiments since furnace 2 only had one sampling point at the furnace tube outlet.The measured final conversions are listed in Table 8 together with the ash contents of the char samples.Then,the final char conversions were predicted by both the intrinsic model[6,17,18]and the present model with the results also listed in Table 8.All the predicted final conversions are plotted in Fig.9 versus the measured final conversions to show that the present model is more accurate than the intrinsic model.
5.Discussion
The combustion of a single char particle in a bulk space was simulated with the present model to get more details about the charcombustion process.The char particle was assumed to be spherical and isothermal.The equations describing the char particle were the same with those in the drop tube furnace experiment simulations[4].The one-dimensional conservation equations for multicomponent reacting systems in spherical coordinates[30]were used to describe the heat and mass transfer processes and the chemical reactions in the flow field around the char particle.The effects of the char particle combustion on the flow field were used as the boundary conditions.The No.2 char in Tables 4 and 6 was used with the detailed simulation conditions listed in Table 9.In all the cases,the total pressure is 101.325 kPa and the initial char particle temperature is 300 K.
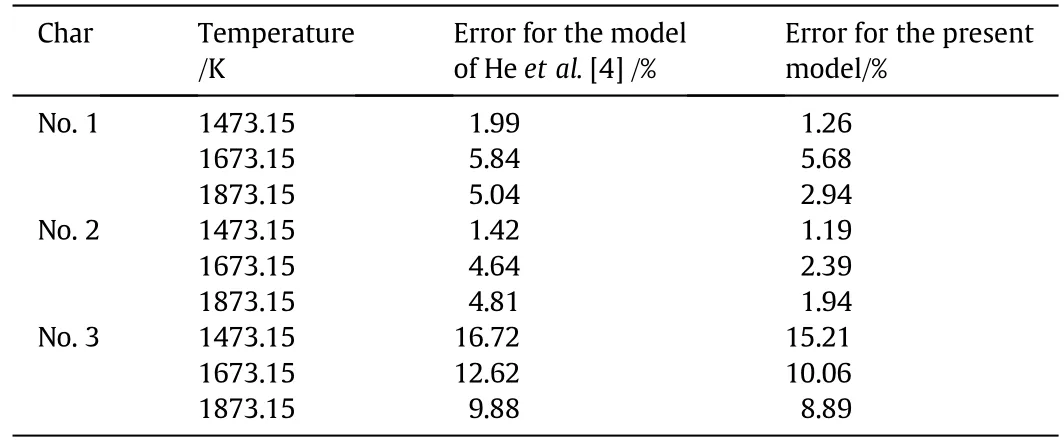
Table 7Root mean square errors for the model of He et al.[4]and the present model relative to the experimental data

Table 8Comparisons of the predicted final conversions with the measured data for chars in Group 2
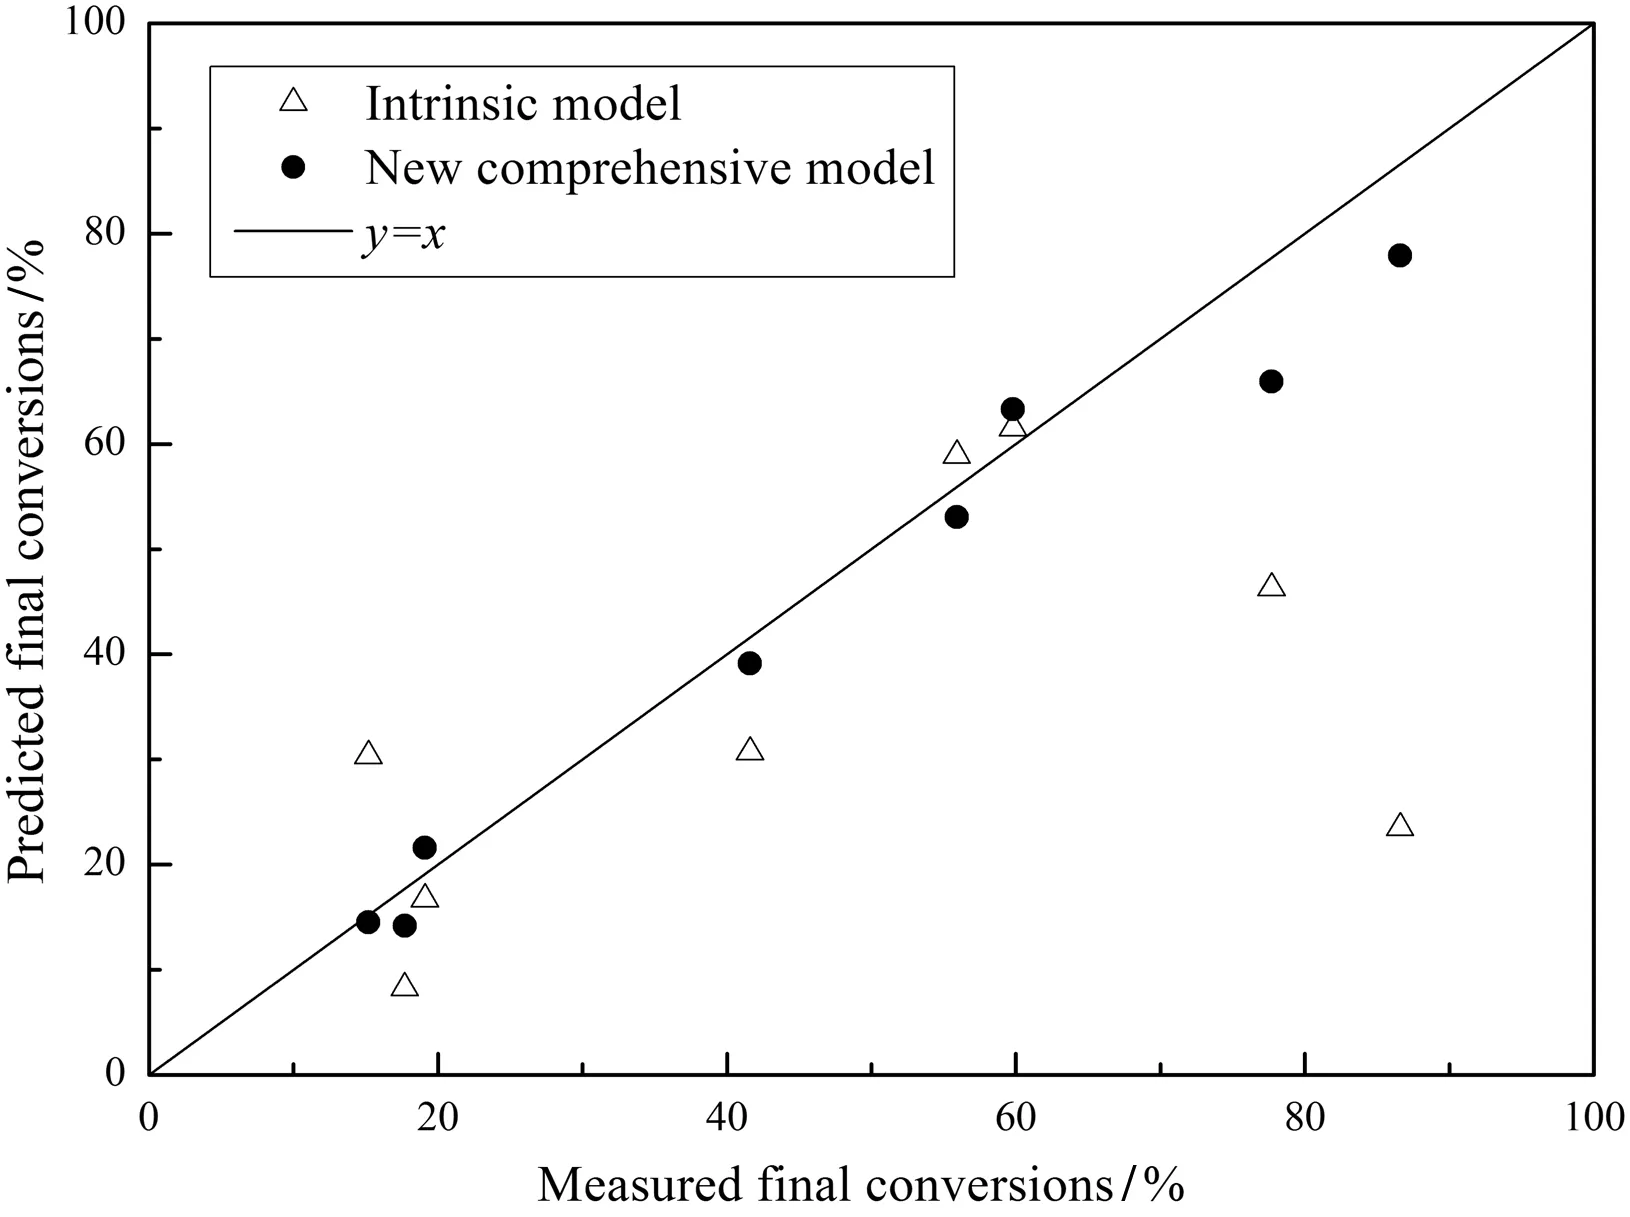
Fig.9.Comparison of the present model with the traditional intrinsic model.
Figs.10–15 show the simulation results in which “Air”means that the case used the air-mode(in an O2/N2atmosphere)and “Oxy”means the case used the oxy-mode(in an O2/CO2atmosphere).The results in Figs.10–14 were obtained with an initial O2mole fraction at the char particle external surface of 21%while the results in Fig.15 were obtained with an initial temperature of 1200 K.The other simulation conditions are indicated in the figures.
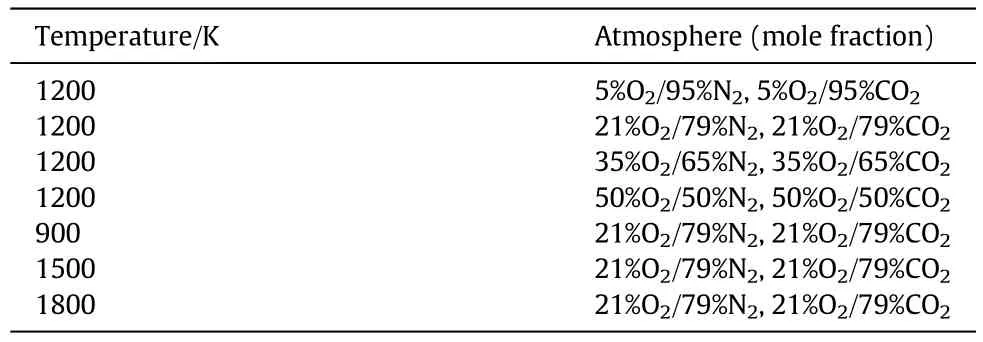
Table 9Simulation conditions for a single char particle combustion
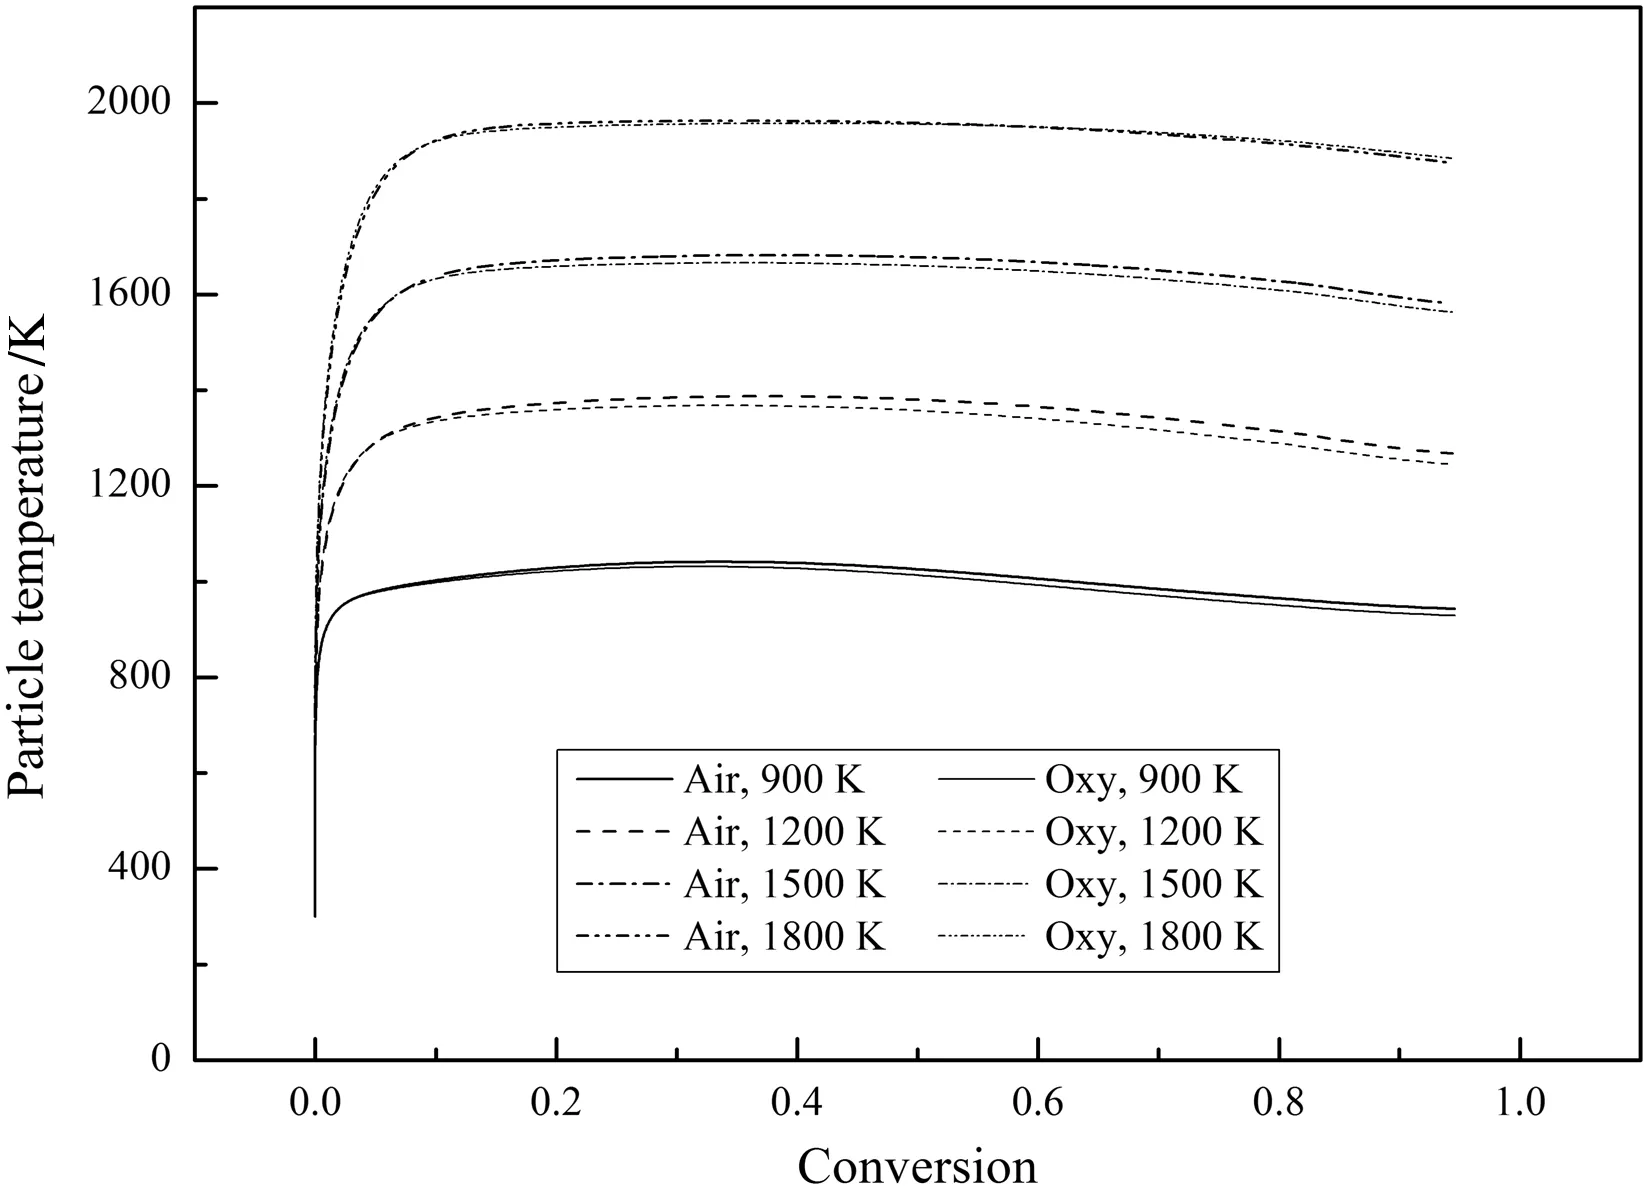
Fig.10.Variations of the char particle temperature during combustion(21%O2).
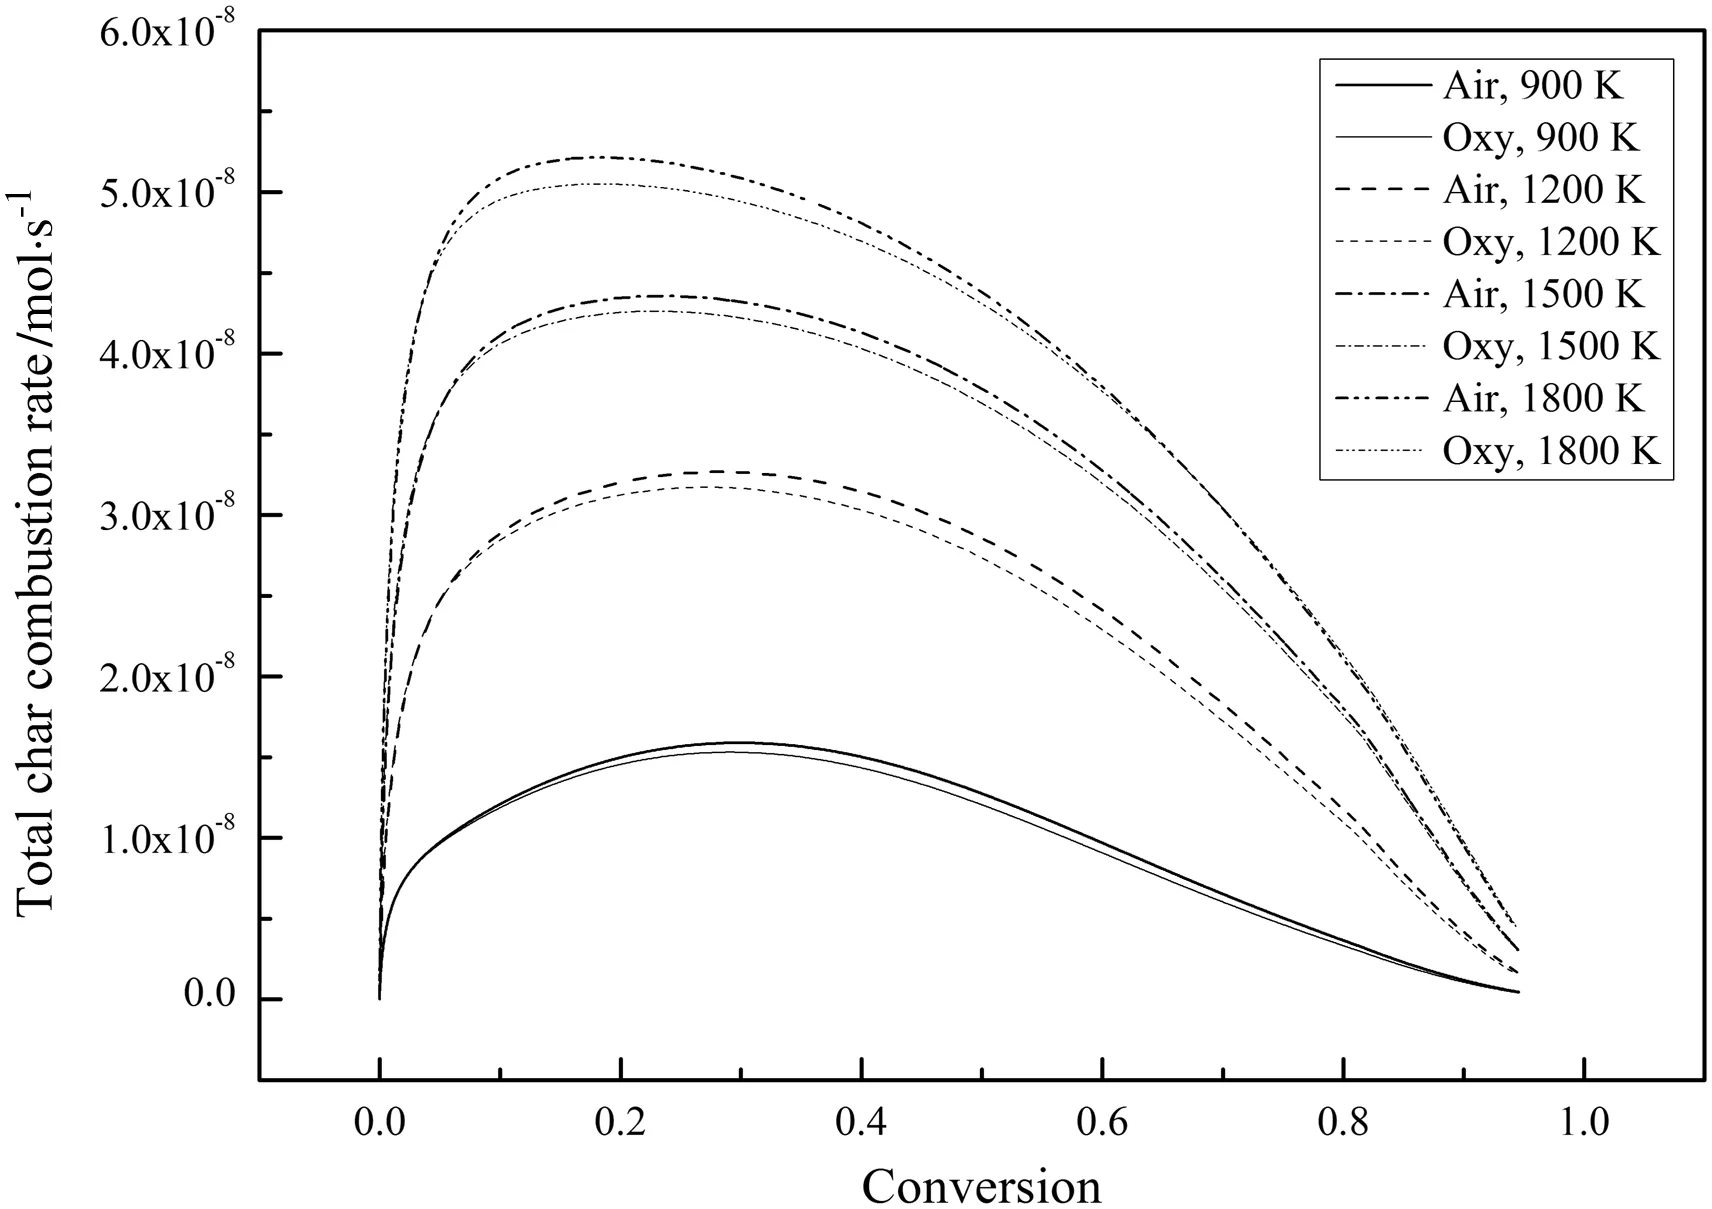
Fig.11.Variations of the total char combustion rate for different temperatures during combustion(21%O2).
Fig.10 shows the variations of the char particle temperature,Tp,during combustion.The differences inTpbetween the air-mode and the oxy-mode are very small andTpin air-mode is slightly higher than that in oxy-mode.Fig.11 shows the variations of the total char combustion rate during combustion.The combustion rates in air-mode are higher than those in oxy-mode for all temperatures.These phenomena are mainly due to the higher molarspecific heat of CO2and the lower O2diffusion coefficient in CO2which slow the char combustion in oxymode[27,28].Even though the char can react with CO2,the contribution is insignificant since the reaction rate of char with CO2is much lower than that of char with O2as long as comparable O2concentrations are present[29].Since the complete char combustion processes were simulated with the bulk diffusion effects included,the reaction rate differences between the air-mode and the oxy-mode in Fig.11 are higher than those in Fig.3.
Fig.12 shows the variations of the gas mole fractions at the char particle external surface during combustion.Since O2is a reactant in the combustion reactions,the O2mole fractions decrease as the combustion proceeds.During the final stage of the combustion,the combustion rates decrease significantly and the amount of O2diffusing from the ambient to the charparticle surface is greater than the amount ofO2consumed in the combustion reactions.Thus,the O2mole fractions gradually increase.At lower temperatures,the O2mole fractions decrease more in the air-mode than in the oxy-mode since the combustion rates in the air-mode are faster.However,at higher temperatures,although the combustion rates in air-mode are still faster,the O2mole fractions decrease more in the oxy-mode.This is because more CO is generated in the oxy-mode at higher temperatures as can be seen in Fig.12 and the combustion of CO will consume more O2.The char-CO2gasification reaction rate is faster at higher temperatures,especially in oxy-mode with a large amount of CO2in the atmosphere.What's more,the apparent CO/CO2ratio is also higher at higher temperatures.
The variations of the CO mole fractions in Fig.12 are the opposite of the O2mole fractions with the reasons being analogous to those for the variations of the O2mole fractions.In air-mode,there is no CO2in the atmosphere before combustion,so the CO2mole fractions first increase and then decrease during combustion,which is similar to the CO mole fractions.The CO mole fractions are higher than the CO2mole fractions especially at higher temperatures,which shows that CO is the main product of the char combustion.In oxy-mode,the CO2is used as the background gas with relatively high mole fractions before combustion,so the CO2mole fractions first decrease as the reactant.Then,the CO2mole fractions increase significantly and even exceed the original level,because CO2is also one of the combustion products.
Fig.13 shows the variations of the char particle specific surface area,Sg,during combustion.Since the char particle pore structure evolution model in Section 2.2 has the same form for both the air-mode and the oxy-mode,only the relationships betweenSgand the char conversion,X,in air-mode are shown.The results show that the temporal variations ofSgdiffer for the two modes.Sgfirst increases to a maximum and then decreases with increasingXwhich is the same as in some experiments[31–38].The increase ofSgis caused by the pore growth and the opening of closed pores and the decrease ofSgis caused by the collapse of the pores and the coalescence of the pore walls[3].The variations ofSgare similar to the variations of the total char combustion rates in Fig.11.The porosity,θ,increases(not linearly)while the fractal dimension,Df,and the particle diameter,dp,decrease(not linearly)during combustion,which is the same as in[3].The decrease ofDfmeans the char pore structures become less complex after combustion[3].
Fig.14 shows the variations of the apparent reaction order,n,during combustion.During the initial stage of combustion,ndecreases rapidly from 1.Then,nbecomes stable.During the final stage of combustion,nincreases gradually.As the O2concentration at the particle surface changes,the pore diffusion resistance and the time constant for the flow and diffusion into the pores postpone the variations of the O2concentration at the reactive surface inside the char pores andnis not always 1[5].In the simulations,the initial char particle temperature is very low(300 K)and the pore diffusion is not the key factor restricting the chemical reactions,sonis approximately equal to 1.As the char particle heats and burns,the particle temperature rises quickly and the effect of pore diffusion is significantly enhanced,sondecreases rapidly.As the combustion reaches steady state,nbecomes stable.During the final stage of combustion,most of the carbon has been consumed and the pore structure becomes less complex[3]which means that the pore structure provides less pore diffusion resistance,songradually increases.Liu and He[5]also studied the variations ofnduring combustion and found that n decreased first and then became stable towards the end of the combustion process without increasing because the char pore structure evolution was not included in their simulations.
Fig.15 shows the variations of the total char combustion rate for different O2concentrations at a higher temperature of 1200 K.Overall,the total char combustion rates in the air-mode are still higher than those in the oxy-mode and the differences become larger at higher O2concentrations.However,with an initial O2mole fraction of 5%,the total char combustion rates in the two modes are nearly the same.The total char combustion rates are actually a little higher in oxy-mode at this time but the difference cannot be seen in Fig.15.This shows that the effect of the char-CO2gasification reaction is important only when the temperature is relatively high and the O2concentration is relatively low.

Fig.12.Variations of the gas mole fractions at the char particle external surface during combustion(21%O2).
6.Conclusions
The char combustion mechanisms were analyzed in terms of(1)the pore diffusion effects on the char combustion,(2)the char particle pore structure evolution during combustion,(3)the variation of the apparent reaction order during combustion,(4)the apparent CO/CO2ratio in the combustion products,and(5)the effects of high CO2concentration on the char combustion.A comprehensive char particle combustion model was then developed with all these mechanisms.Nearly all the complex factors affecting the char combustion are considered except for the catalysis of the trace elements in the ash and the graphitization of the chars which will be studied in a future work.
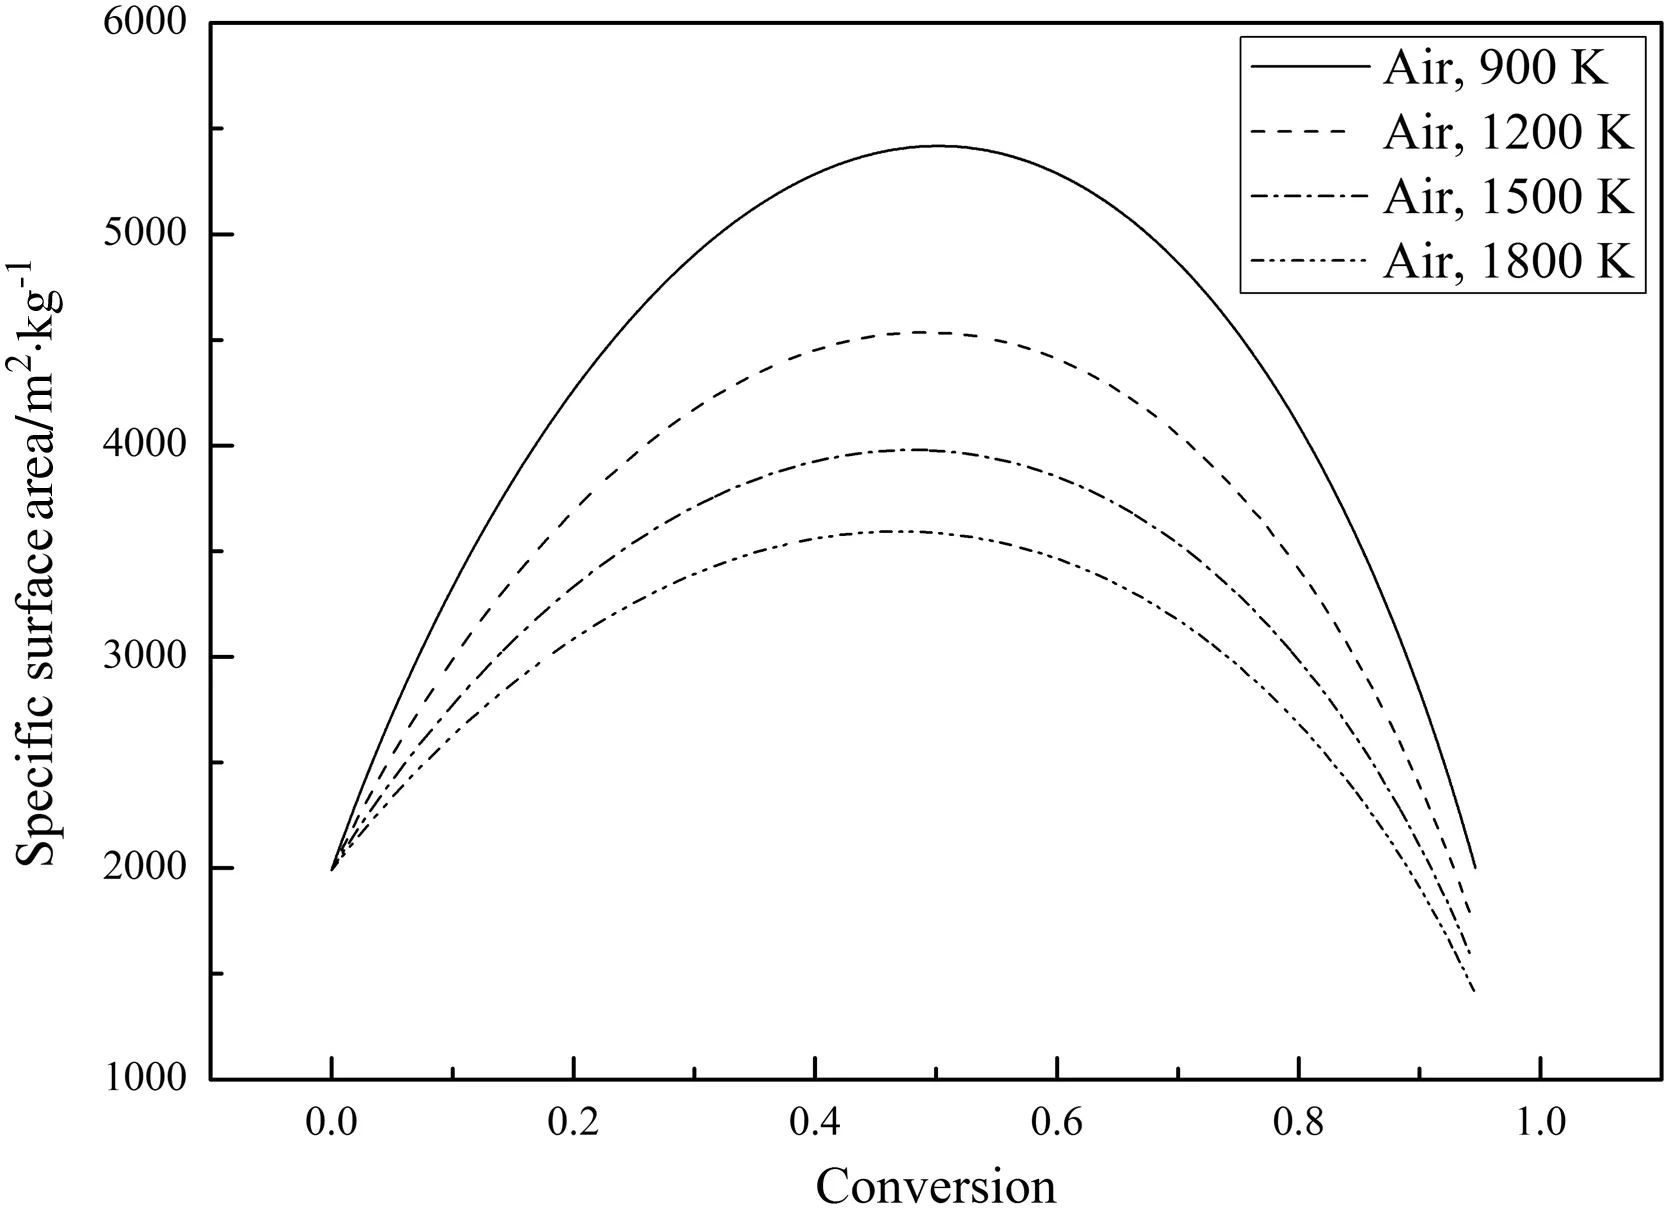
Fig.13.Variations of the char particle specific surface area during combustion(21%O2).
Eleven different chars were used in combustion experiments in two drop tube furnaces.The conversions of the partly burned char samples were measured using thermogravimetric analysis.The predicted char conversions matched very well with the measured values which showed the reliability of the present model.What's more,this model is significantly more accurate than the model of Heet al.[4]and the traditional intrinsic model.
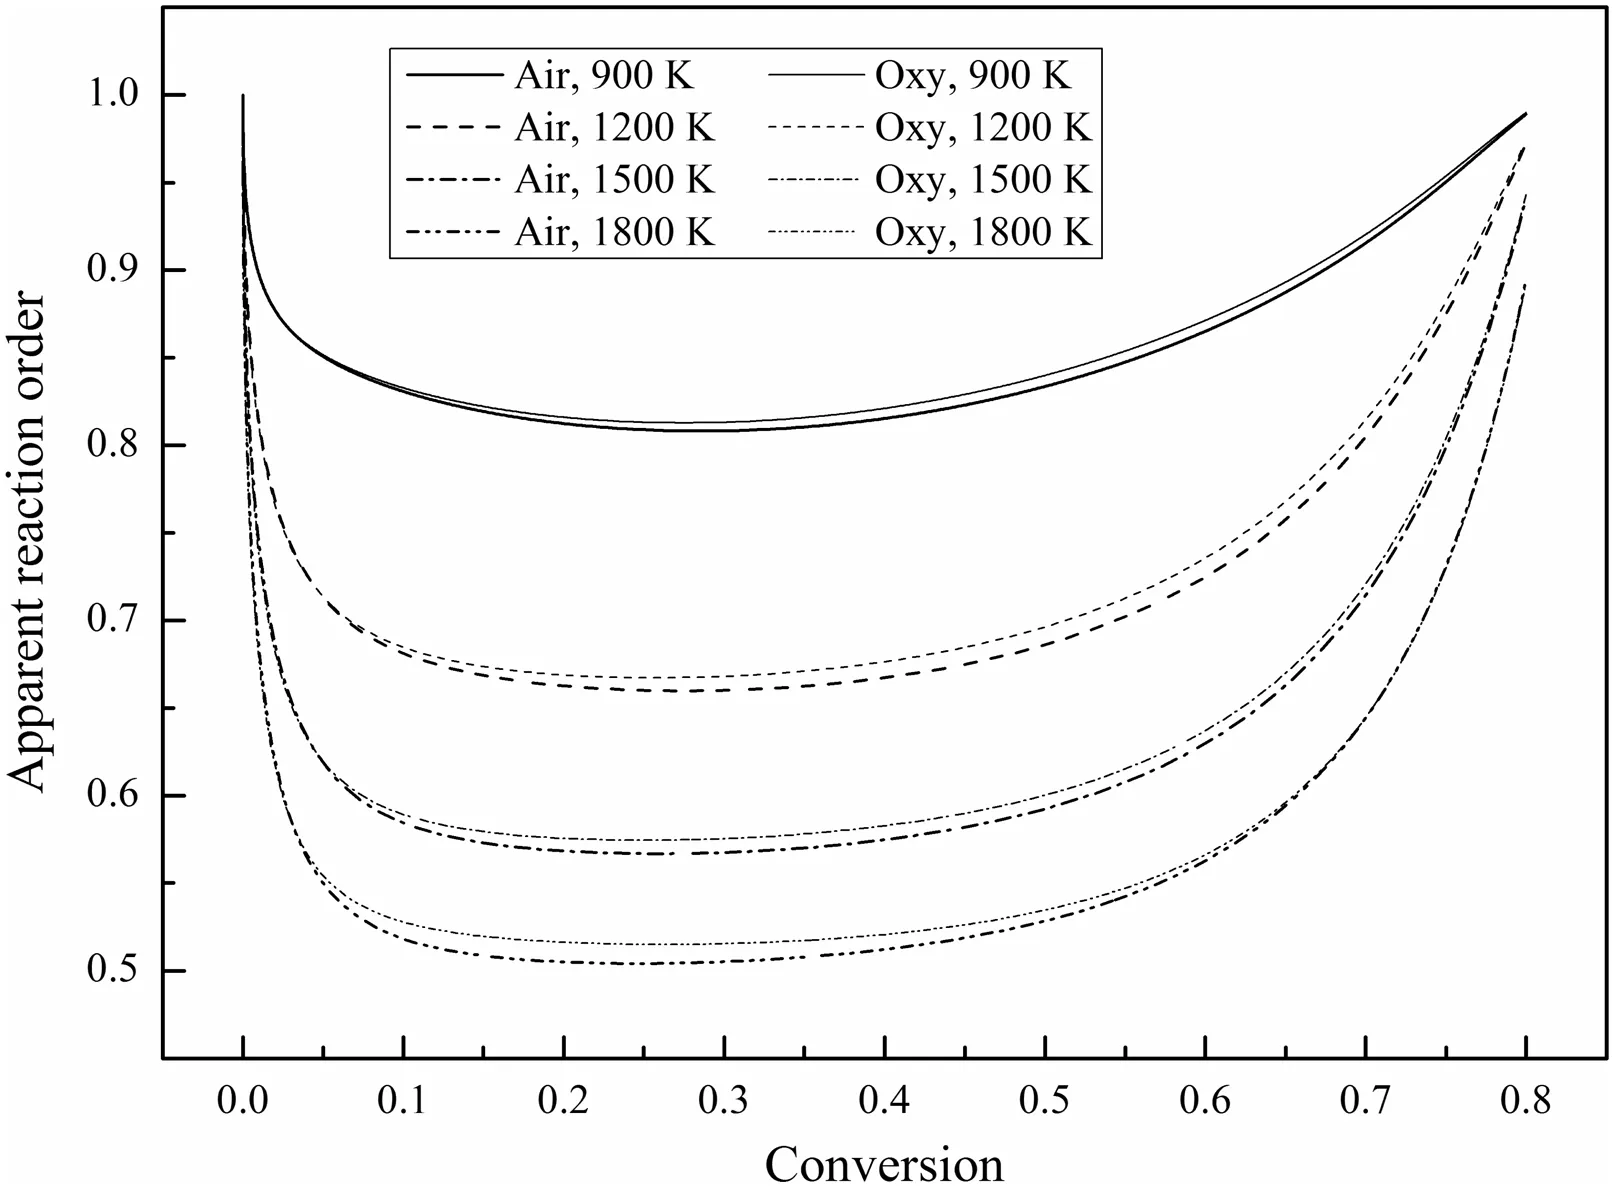
Fig.14.Variations of the apparent reaction order during combustion(21%O2).
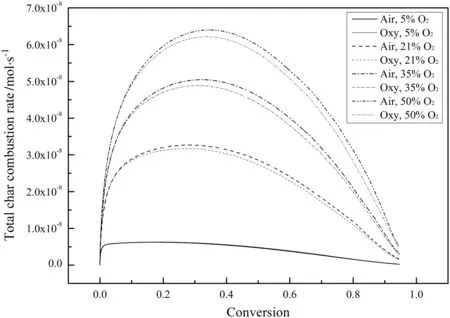
Fig.15.Variations of the total char combustion rate for different O2 concentrations during combustion(T0=1200 K).
The apparent reaction order first decreases,then stabilizes and finally increases during the combustion process.The specific surface area of the char particle first increases and then decreases with a maximum during combustion.The combustion rates in oxy-mode are generally slower than those in air-mode due to the higher CO2molar specific heat and the lower O2diffusion coefficient in CO2which slow the char combustion in oxy-mode.The effect of the char-CO2gasification reaction becomes important only when the temperature is relatively high and the O2concentration is relatively low.
Nomenclature
Aipre-exponential factor
a1,a2constants in Eq.(8)
ash char particle ash content
b1,b2,b3constants in Eq.(11)
CsO2molar concentration at the char particle external surface,mol·m-3
c1,c2constants in Eq.(15)
Dffractal dimension of the char pores
d1,d2constants in Eq.(18)
dpchar particle diameter,m
Eiintrinsic activation energy,J·mol-1
kaapparent reaction rate constant
kiintrinsic reaction rate constant
mchar particle mass,kg
m1,m2constants in Eq.(25)
napparent reaction order of char combustion
PCO2CO2partial pressure at the char particle external surface,Pa
PO2O2partial pressure at the char particle external surface,Pa
Qintermediate variable
R universal gas constant(R=8.314 J·mol-1·K-1)
Rairchar particle combustion rate in the O2/N2atmosphere,mol·s-1
Roxychar particle combustion rate in the O2/CO2atmosphere,mol·s-1
Rschar particle combustion rate,mol·s-1
rporechar pore radius,m
Saaccumulated pore surface area in mercury intrusion measurements,m2
Sgspecific surface area of the char particle,m2·kg-1
Ttemperature,K
Tcriticalcritical temperature defined based on Eq.(27),K
Tpchar particle temperature,K
X char conversion
α correction factor for oxy-char combustion defined in Eq.(24)
ΔHreaction heat,kJ·mol-1
ζ scale factor
θ char particle porosity
ρitrue density of the char particle,kg·m-3
τ tortuosity factor of the char pores
χ dimensionless modulus defined in Eq.(2)
Subscript
0 initial value of the variable
[1]R.He,J.I.Sato,C.H.Chen,Modeling char combustion with fractal pore effects,Combust.Sci.Technol.174(2002)19–37.
[2]W.He,R.He,L.Cao,T.Ito,T.Suda,J.I.Sato,Numerical study of the relationships between pore structures and reaction parameters for coal char particles,Combust.Sci.Technol.184(2012)2084–2099.
[3]Y.Liu,R.He,Modeling of the pore structure evolution in porous char particles during combustion,Combust.Sci.Technol.188(2016)207–232.
[4]W.He,Y.Liu,R.He,T.Ito,T.Suda,T.Fujimori,H.Ikeda,J.I.Sato,Combustion rate for char with fractal pore characteristics,Combust.Sci.Technol.185(2013)1624–1643.
[5]Y.Liu,R.He,Variation of apparent reaction order in char combustion and its effect on a fractal char combustion model,Combust.Sci.Technol.187(2015)1638–1660.
[6]I.W.Smith,The combustion rates of coal chars:A review,Symp.Combust.19(1982)1045–1065.
[7]R.He,X.Xu,C.Chen,H.Fan,B.Zhang,Evolution of pore fractal dimensions for burning porous chars,Fuel77(1998)1291–1295.
[8]D.Avnir,D.Farin,P.Pfeifer,Surface geometric irregularity of particulate materials:The fractal approach,J.Colloid Interface Sci.103(1985)112–123.
[9]C.Fairbridge,S.H.Ng,A.D.Palmer,Fractal analysis of gas-adsorption on syncrude coke,Fuel65(1986)1759–1762.
[10]W.I.Friesen,O.I.Ogunsola,Mercury porosimetry of upgraded western Canadian coals,Fuel74(1995)604–609.
[11]P.J.Mcmahon,I.K.Snook,S.D.Moss,P.R.Johnston,Influence of fractal pores on the oxidation behavior of brown coal,Energy Fuel13(1999)965–968.
[12]P.Pfeifer,D.Avnir,Chemistry in noninteger dimensions between two and three:I.Fractal theory of heterogeneous surfaces,J.Chem.Phys.79(1983)3558–3565.
[13]P.Salatino,F.Zimbardi,S.Masi,A fractal approach to the analysis of lowtemperature combustion-rate of a coal char:I.Experimental results,Carbon31(1993)501–508.
[14]M.Costa,A.D.Araujo,H.F.Da Silva,J.S.Andrade,Scaling behavior of diffusion and reaction processes in percolating porous media,Phys.Rev.E67(2003)061408–061411.
[15]Y.Gefen,A.Aharony,S.Alexander,Anomalous diffusion on percolating clusters,Phys.Rev.Lett.50(1983)77–80.
[16]P.Levitz,From Knudsen diffusion to Levy walks,Europhys.Lett.39(1997)593–598.
[17]D.Fortsch,R.H.Essenhigh,U.Schnell,K.R.G.Hein,On the application of the Thiele/Zeldovich analysis to porous carbon combustion,Energy Fuel17(2003)901–906.
[18]L.Ma,R.Mitchell,Modeling char oxidation behavior under Zone II burning conditions at elevated pressures,Combust.Flame156(2009)37–50.
[19]W.He,R.He,T.Ito,T.Suda,J.I.Sato,Numerical investigations of CO/CO2ratio in char combustion,Combust.Sci.Technol.183(2011)868–882.
[20]Z.Liang,R.He,Q.Chen,X.Xu,J.I.Sato,Fractal generation of char pores through random walk,Combust.Sci.Technol.179(2007)637–661.
[21]J.E.House,Principles of chemical kinetics,second ed.Academic Press,Pittsburgh,2007.
[22]L.Cao,R.He,Gas diffusion in fractal porous media,Combust.Sci.Technol.182(2010)822–841.
[23]T.I.Gombosi,Gas kinetic theory,Cambridge University Press,Cambridge,1994.
[24]R.H.Hurt,J.M.Calo,Semi-global intrinsic kinetics for char combustion modeling,Combust.Flame125(2001)1138–1149.
[25]L.Tognotti,J.P.Longwell,A.F.Sarofim,The products of the high temperature oxidation of a single char particle in an electrodynamic balance,Symp.Combust.23(1991)1207–1213.
[26]A.N.Hayhurst,M.S.Parmar,Does solid carbon burn in oxygen to give the gaseous intermediate CO or produce CO2directly?Some experiments in a hot bed of sand fluidized by air,Chem.Eng.Sci.53(1998)427–438.
[27]L.Chen,S.Z.Yong,A.F.Ghoniem,Oxy-fuel combustion of pulverized coal:characterization,fundamentals,stabilization and CFD modeling,Prog.Energy Combust.Sci.38(2012)156–214.
[28]T.Wall,Y.Liu,C.Spero,L.Elliott,S.Khare,R.Rathnam,F.Zeenathal,B.Moghtaderi,B.Buhre,C.Sheng,R.Gupta,T.Yamada,K.Makino,J.Yu,An overview on oxyfuel coal combustion—State of the art research and technology development,Chem.Eng.Res.Des.87(2009)1003–1016.
[29]P.L.Walker Jr.,F.Rusinko Jr.,L.G.Austin,Gas reactions of carbon,Adv.Catal.11(1959)133–221.
[30]K.K.Kuo,Principles of combustion,second ed.John Wiley and Sons,New Jersey,2005.
[31]I.Aarna,E.M.Suuberg,Changes in reactive surface area and porosity during char oxidation,Symp.Combust.27(1998)2933–2939.
[32]K.E.Adams,D.R.Glasson,S.A.A.Jayaweera,Development of porosity during the combustion of coals and cokes,Carbon27(1989)95–101.
[33]B.Feng,S.K.Bhatia,Variation of the pore structure of coal chars during gasification,Carbon41(2003)507–523.
[34]H.Lorenz,E.Carrea,M.Tamura,J.Haas,The role of char surface structure development in pulverized fuel combustion,Fuel79(2000)1161–1172.
[35]L.M.Lu,V.Sahajwalla,D.Harris,Coal char reactivity and structural evolution during combustion—Factors influencing blast furnace pulverized coal injection operation,Metall.Mater.Trans.B Process Metall.Mater.Process.Sci.32(2001)811–820.
[36]A.K.Sadhukhan,P.Gupta,R.K.Saha,Characterization of porous structure of coalchar from a single devolatilized coal particle:coal combustion in a fluidized bed,Fuel Process.Technol.90(2009)692–700.
[37]I.Sircar,A.Sane,W.Wang,J.P.Gore,Experimental and modeling study of pinewood char gasification with CO2,Fuel119(2014)38–46.
[38]J.L.Su,D.D.Perlmutter,Effect of pore structure on char oxidation kinetics,AIChE J.31(1985)973–981.
杂志排行
Chinese Journal of Chemical Engineering的其它文章
- Statistical mechanics and artificial intelligence to model the thermodynamic properties of pure and mixture of ionic liquids☆
- Kinetic effects of nanosecond discharge on ignition delay time☆
- Modification and sequential treatment of EU-1 zeolite in mild alkali and alkaline-acid conditions
- Catalytic kinetics of dimethyl ether one-step synthesis over CeO2–CaO–Pd/HZSM-5 catalyst in sulfur-containing syngas process☆
- Development of a bifurcation analysis approach based on gPROMS platform☆
- Molar volume of eutectic solvents as a function of molar composition and temperature☆
