磁敏感加权成像技术鉴别乳头状和嫌色细胞肾癌的价值研究
2016-05-17张永成俞胜男陈杰孙军邢士军陈铜兵
张永成,俞胜男*,陈杰,孙军,邢士军,陈铜兵
磁敏感加权成像技术鉴别乳头状和嫌色细胞肾癌的价值研究
张永成1,俞胜男1*,陈杰1,孙军1,邢士军1,陈铜兵2
目的评价磁敏感加权成像(susceptibility weighted imaging,SWI)上肿瘤内磁敏感信号(intratumoral susceptibility signal,ITSS)鉴别乳头状肾癌(papillary renal cell carcinoma,pRCC)和嫌色细胞肾癌(chromophobe renal cell carcinoma,CRCC)的价值。材料与方法对经病理证实的21例肾细胞癌(renal cell carcinoma,RCC)病例(其中pRCC12例,CRCC9例)进行回顾性分析。SWI上的ITSS根据形态分为出血和微血管。采用非参数Mann-Whitney检验比较SWI上pRCC和CRCC的 ITSS主要结构、瘤内血管和出血灶数目及ITSS与肿瘤面积比值。采用受试者工作特征(receiver operating characteristic,ROC)曲线分析ITSS 4种评价指标鉴别pRCC和CRCC的诊断效能。结果21例RCC中18例肿瘤内可见ITSS。pRCC的ITSS主要结构的评分显著高于CRCC (P<0.05)。pRCC的ITSS与肿瘤面积比值显著高于CRCC (P<0.05)。pRCC的瘤内出血灶数目显著多于CRCC (P<0.05)。pRCC (100%)瘤内出血的出现率显著高于CRCC (66.67%)。瘤内出血灶数目鉴别pRCC和CRCC的阳性预测值(100%)和特异性(100%)最高,ITSS与肿瘤面积比值鉴别pRCC和CRCC的阴性预测值(87.50%)和敏感性(88.89%)最高。结论通过分析比较ITSS的主要结构、瘤内出血灶和血管数目及ITSS与肿瘤面积比值,SWI可作为评价pRCC和CRCC之间结构差异的有效手段。
磁共振成像;磁敏感加权成像;肾肿瘤;癌,肾细胞;亚型
肾癌(renal cell carcinoma,RCC)是临床常见的泌尿系统恶性肿瘤。RCC的主要病理类型包括透明细胞(clear cell renal cell carcinoma,CCRCC)、乳头状(papillary renal cell carcinoma,pRCC)和嫌色细胞RCC(chromophobe renal cell carcinoma,CRCC)[1]。不同病理类型RCC的治疗方法及预后存在很大差异[2]。影像学检查是术前明确RCC病理类型的主要手段。CCRCC血供丰富,增强明显强化,与pRCC和CRCC存在明显差异[3-4]。而pRCC和CRCC的影像表现存在重叠。本研究旨在利用磁共振磁敏感成像技术(susceptible weighted imaging,SWI)观察pRCC和CRCC瘤内磁敏感信号的差异,为两者的鉴别提供帮助。
1 材料与方法
1.1 病例资料
回顾性分析我院2011年3月至2015年12月经手术病理证实的48例pRCC和CRCC患者。27例由于未行SWI检查未纳入研究,最终21例患者纳入本研究。其中男14例,女7例,年龄27~79岁,平均年龄54岁。
1.2 检查技术
所有病例MRI检查均使用Siemens Verio 3.0 T超导MRI,12通道相位阵列体部线圈。先行冠状位T2WI定位,然后行横断位T1WI、T2WI,TE 2.5/96 ms,TR 161/700 ms,FOV 285 mm× 380 mm,矩阵180×320/285×320,层厚5 mm,间隔1 mm。横断位多次屏气2D-SWI序列TR/ TE,162/10.3 ms,FOV 285 mm × 380 mm,矩阵187×384,层厚5 mm,间隔1.0 mm,翻转角20°,带宽 620 Hz/pixel,扫描过程中屏气2~3次,每次持续约12~16 s,两次屏气间隔5 s自由呼吸,总扫描时间约1 min。
1.3 影像分析
所有SWI图像由两位经验丰富的影像科医生独立分析,结果不一时,协商决定。肿瘤内磁敏感信号(intratumoral susceptible signal,ITSS)根据形态划分为出血和微血管两类。出血为点状或斑片状直径大于0.5 cm低信号;微血管表现为瘤内线样低信号[5]。
ITSS的主要结构划分为:0=肿瘤内无ITSS;1=ITSS主要为微血管结构;2=微血管与出血分布近似;3=ITSS主要为出血[6]。
瘤内出血灶和血管使用半定量方法计数。出血灶数目分为4个级别:0=瘤内无ITSS;1=1~10个点状或斑片状ITSS;2=11~20个点状或斑片状ITSS;3=大于20个点状或斑片状ITSS。瘤内血管数目同样划分为4个等级:0=瘤内无ITSS;1=1~5条线样ITSS;2=6~10个线样ITSS;4=大于10个线样ITSS[7]。
使用3级划分标准评价ITSS与肿瘤的面积比:0=瘤内无ITSS;1=任意层面比值<50%;2=任意层面比值≥50%[8]。
1.4 统计学分析
使用MedCalc11.4.2.0统计分析软件,结果以均数±标准差表示。使用非参数Mann-Whitney检验比较pRCC和CRCC之间ITSS的主要结构、瘤内出血灶和瘤内血管数目及ITSS与肿瘤面积比之间的差异。使用受试者工作特征(receiver operating characteristics,ROC)曲线分别评价ITSS的主要结构、瘤内出血灶和血管数目及ITSS与肿瘤面积比鉴别pRCC和CRCC的诊断效能,并计算敏感性、特异性、阳性预测值及阴性预测值。P<0.05认为差异有统计学意义。
2 结果
2.1 病理学结果
21例肾脏肿瘤中,12例为pRCC,9例为CRCC。其中1例左肾CRCC患者术后出现复发性右肾CRCC,于外院行根治性右肾切除术。
2.2 SWI结果
21例肾脏肿瘤中,18例可见ITSS,另3例未见ITSS的病理为CRCC。ITSS主要结构的平均分值、瘤内出血灶和血管数目及ITSS与肿瘤面积的比值见表1。pRCC在SWI上ITSS主要结构的平均分值显著高于CRCC (P<0.05),见图1。
4例pRCC (4/12)的肿瘤内出血灶融合成大片状出血。pRCC (12/12,100%)瘤内出血的出现率高于CRCC (6/9,66.67%),且pRCC的瘤内出血数目显著多于CRCC (P<0.05),见图2。
5例pRCC (5/12)和5例CRCC (5/9)可见瘤内血管。pRCC的瘤内血管数目较CRCC少,但两者之间差异无统计学意义(P>0.05)。
7例pRCC (7/12)和1例CRCC (1/9)的任意层面ITSS与肿瘤面积比值超过50%。pRCC的ITSS与肿瘤面积比值显著高于CRCC (P<0.05),见图3。
2.3 ROC曲线分析结果
ITSS主要结构、瘤内出血灶和血管数目及ITSS与肿瘤面积比值鉴别pRCC和CRCC的曲线下面积(area under ROC,AUC)分别为0.866、0.750、0.625和0.806(图4)。ITSS主要结构与瘤内血管数目的AUC之间存在显著差异。ITSS主要结构、瘤内出血灶和血管数目及ITSS与肿瘤面积比值鉴别pRCC和CRCC的临界值见表2。
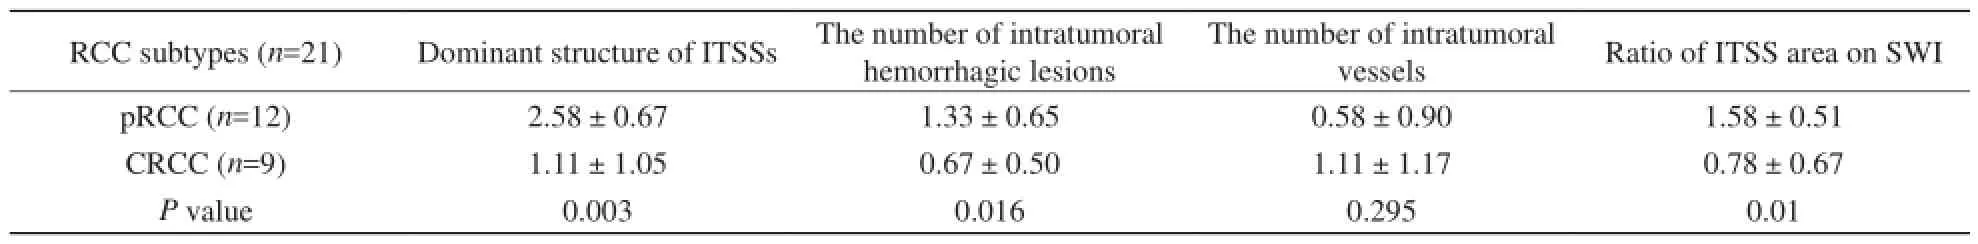
表1ITSS 4项评价指标的平均值Tab.1Mean scores of four indices for ITSS
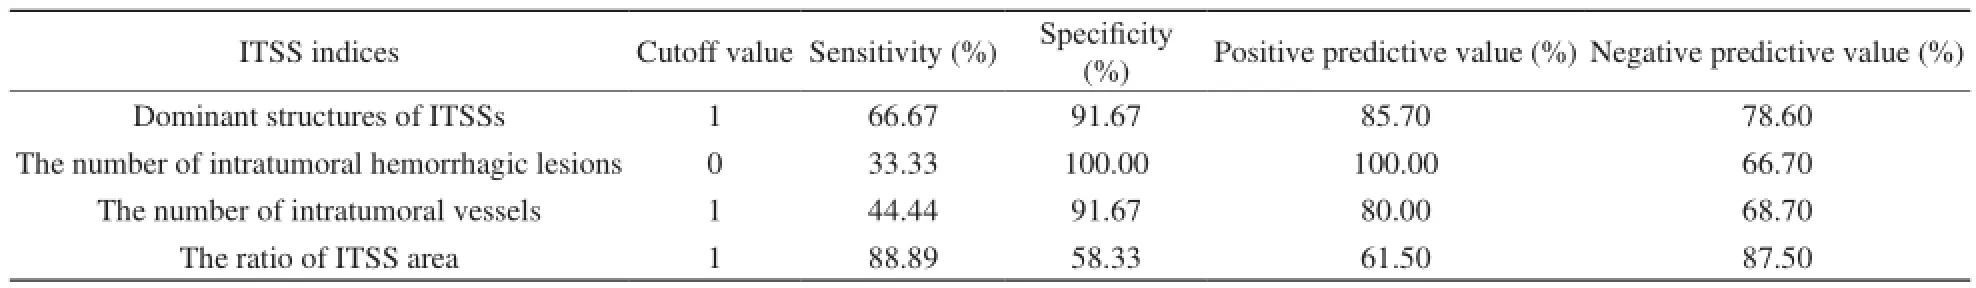
表2ITSS不同指标鉴别pRCC和CRCC的诊断效能Tab.2Diagnostic value of different indices of ITSS in differentiating pRCCs from CRCCs

图1pRCC与CRCC的ITSS主要结构。A:1例右肾pRCC,ITSS主要结构呈点状低信号,提示为出血灶;B:1例右肾CRCC,肿瘤内未见明显ITSS (箭),左肾可见肾盂积水(星状)及一枚复杂性囊肿(箭头)图2pRCC和CRCC的瘤内出血灶数目的差别。A:1例左肾pRCC,瘤内可见斑片状低信号出血灶(箭);B:1例左肾CRCC,瘤内出血灶(箭头)数目较A少,而线状ITSS(箭)数目较A多图3pRCC和CRCC的ITSS与肿瘤面积比值。A:1例右肾pRCC,ITSS面积大于肿瘤面积的50%;B:1例右肾CRCC,ITSS面积小于肿瘤面积的50%Fig. 1Difference of dominant structures of ITSSs between pRCC and CRCC. In the case with right renal pRCC, the dominant structures of ITSSs are prominently dot-like hypo-intensities, which indicate intratumoral hemorrhage (A). In the other case with right renal CRCC (B), no significant ITSSs was seen in the tumor (arrow). Hydronephrosis (star) and a complicated cyst (arrow head) also were present in the left kidney.Fig. 2Difference of the number of intratumoral hemorrhagic lesions between pRCC and CRCC. In the case with left renal pRCC, many hemorrhagic lesions are present, which reveal patchy hypo-intensities on SWI (arrow) (A). In the other case with left renal CRCC, the number of intratumoral hemorrhagic lesions (arrow head) decreases on SWI (B), while the number of linear ITSSs significant increases (arrow).Fig. 3Difference of the ratio of ITSS area to tumor area between pRCC and CRCC. In the case with right renal pRCC, the ratio is larger than half of the tumor on SWI (A). On the contrary, the ratio is less than half of the tumor on SWI in the other
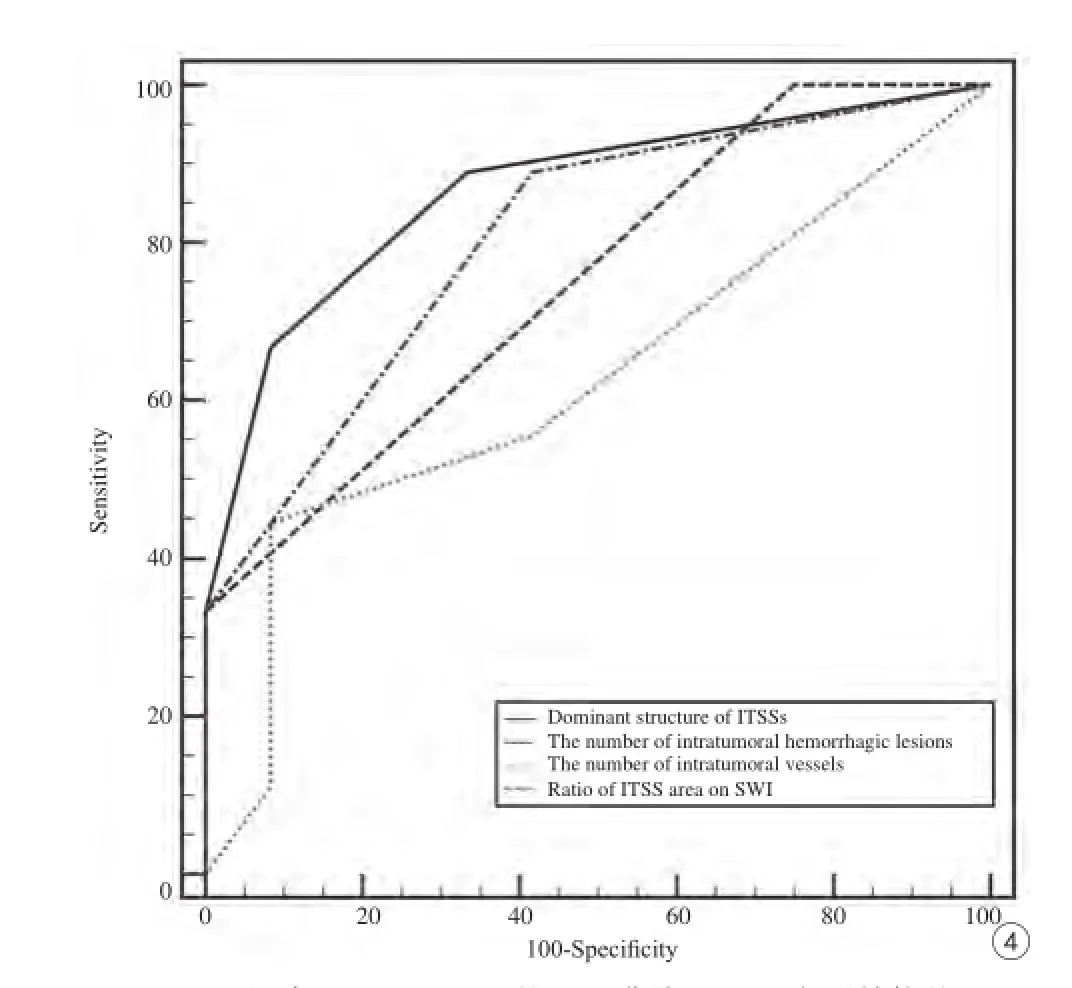
图4ITSS鉴别pRCC和CRCC的ROC曲线。ITSS主要结构的AUC (0.866)大于瘤内出血灶(0.750)和血管数目(0.625)以及ITSS与肿瘤面积比值(0.806)Fig. 4ROC curve for the ITSSs in differentiating pRCCs from CRCCs. The area under ROC curve (AUC) for dominant structures of ITSSs (0.866) is greater than those for the number of intratumoral hemorrhagic lesions and vessels, and the ratio of ITSS area on SWI (0.750, 0.625 and 0.806 respectively).
3 讨论
本研究结果显示pRCC与CRCC在SWI上ITSS主要结构、瘤内出血灶和血管数目及ITSS与肿瘤面积比值存在显著差异。ITSS主要结构鉴别pRCC和CRCC的AUC大于瘤内出血灶和血管数目及ITSS与肿瘤面积比值。与其他评价指标相比,瘤内出血灶数目的特异性(100%)和阳性预测值(100%)最高,而ITSS与肿瘤面积比值的敏感性(88.89%)和阴性预测值(87.50%)最高。
与其他影像学技术相比,SWI对磁性物质非常敏感[9-11]。Park等[7]的研究显示细线状和点状ITSS混合存在多见于IV级脑胶质瘤,而细线状ITSS多见于III级脑胶质瘤。另外,Ding等[12]研究发现高级别胶质瘤和脑转移瘤在SWI上检出的瘤内出血灶和血管数目显著高于原发性中枢神经系统淋巴瘤。本研究的结果显示,SWI可检出所有pRCC和CRCC的ITSS,且pRCC的ITSS主要结构的平均分值显著高于CRCC。当ITSS主要结构的分值小于1(即SWI上瘤内无ITSS)时,敏感性、特异性、阳性预测值和阴性预测值分别为66.67%、 91.67%、85.7%和78.6%。
pRCC的病理学检查可见由上皮细胞构成乳头状结构,内部可见出血、囊变及含铁血黄素颗粒[13-14]。瘤内出血较常见,且有时很明显,而含铁血黄素则常见于肿瘤细胞和巨噬细胞的胞浆内[15]。Pedrosa等[16]曾报道pRCC (60%)瘤内出血的出现率显著高于CRCC (20%)。本研究结果也证实这一观点。本研究中pRCC瘤内出血的出现率为100%,CRCC的出现率为66.67%,均高于文献报道。出现这一结果的原因可能是SWI对血液成分特别敏感,与常规MRI相比能检出更多出血灶[11]。
血管增生是恶性肿瘤最显著的生物学行为之一[17]。本试验组先前的研究发现,与高级别ccRCC相比低级别ccRCC可见更多血管结构、较少出血灶[8]。这一研究结果表明瘤内血管数目与肿瘤恶性程度呈负相关。CRCC被认为是RCC的一种亚型,其预后较好。Kattan等[18]研究发现CRCC的恶性程度不及pRCC。本研究中,pRCC的瘤内血管数目较CRCC少,提示pRCC恶性程度更高。
本研究存在以下局限性:(1)所有入选患者均行根治性肾切除术,因此本研究为回顾性研究;(2)由于pRCC和CRCC较少见,本研究样本量不大;(3)本研究没有分析其他少见RCC亚型之间ITSS的差异。随着病例数的增加,本试验组将对可能存在的差异展开研究。
综上所述,通过分析比较ITSS主要结构、瘤内出血灶和血管数目及ITSS与肿瘤面积比值,SWI可作为评价pRCC和CRCC之间结构差异的有效手段。
[References]
[1] Nguyen DP, Vertosick EA, Corradi RB, et al. Histological subtype of renal cell carcinoma significantly affects survival in the era of partial nephrectomy. Urol Oncol, 2016, 34(6): 1-8.
[2] Udager AM, Mehra R. Morphologic, molecular, and taxonomic evolution of renal cell carcinoma: a conceptual perspective with emphasis on updates to the 2016 World Health Organization Classification. Arch Pathol Lab Med, 2016, 140(10): 1026-1037.
[3] Young JR, Margolis D, Sauk S, et al. Clear cell renal cell carcinoma: discrimination from other renal cell carcinoma subtypes and oncocytoma at multiphasic multidetector CT. Radiology, 2013, 267(2): 444-453.
[4] Wang HY, Su ZH, Xu X, et al. Dynamic contrast-enhanced MR imaging in renal cell carcinoma: reproducibility of histogram analysison pharmacokinetic parameters. Sci Rep, 2016, 6: 29146.
[5] Li RK, Zeng MS, Rao SX, et al. Using a 2D multibreath-hold susceptibility-weighted imaging to visualize intratumoral hemorrhage of hepatocellular carcinoma at 3.0 T MRI: correlation with pathology. J Magn Reson Imaging, 2012, 36(4): 900-906.
[6] Chen J, Sun J, Xing W, et al. Prediction of nuclear grade of clear cell renal cell carcinoma with MRI: intratumoral susceptibility signal intensity versus necrosis. Acta Radiol, 2014, 55(3): 378-384.
[7] Park MJ, Kim HS, Jahng GH, et al. Semiquantitative assessment of intratumoral susceptibility signals using non-contrast-enhanced highfield high-resolution susceptibility-weighted imaging in patients with gliomas: comparison with MR perfusion imaging. AJNR Am J Neuroradiol, 2009, 30(7): 1402-1408.
[8] Chen J, Ding J, Dai Y, et al. Assessment of intratumoral micromorphology for patients with clear cell renal cell carcinoma using susceptibility-weighted imaging. PLoS One, 2013, 8(6): 65866.
[9] Xing W, He X, Kassir MA, et al. Evaluating hemorrhage in renal cell carcinoma using susceptibility weighted imaging. PLoS One, 2013,8(2): 57691.
[10] Niwa T, Aida N, Osaka H, et al. Intracranial hemorrhage and tortuosity of veins detected on susceptibility-weighted imaging of a child with a type IV collagen alpha1 mutation and schizencephaly. Magn Reson Med Sci, 2015, 14(3): 223-226.
[11] Schelhorn J, Gramsch C, Deuschl C, et al. Intracranial hemorrhage detection over time using susceptibility-weighted magnetic resonance imaging. Acta Radiol, 2015, 56(12): 1501-1507.
[12] Ding Y, Xing Z, Liu B, et al. Differentiation of primary central nervous system lymphoma from high-grade glioma and brain metastases using susceptibility-weighted imaging. Brain Behav, 2014, 4(6): 841-849.
[13] Klatte T, Said JW, Seligson DB, et al. Pathological, immunohistochemical and cytogenetic features of papillary renal cell carcinoma with clear cell features. J Urol, 2011, 185(1): 30-35.
[14] Verine J. Papillary renal-cell carcinoma. N Engl J Med, 2016, 374(20): 1990-1991.
[15] Gargouri MM, Bargaoui W, Kallel Y, et al. Papillary renal cell carcinoma: clinic and pathological study about 27 cases. Tunis Med, 2015, 93(6): 381-385.
[16] Pedrosa I, Chou MT, Ngo L, et al. MR classification of renal masses with pathologic correlation. Eur Radiol, 2008, 18(2): 365-375.
[17] Kisseleva EP, Krylov AV, Lyamina IV, et al. Role of vascular endothelial growth factor (VEGF) in thymus of mice under normal conditions and with tumor growth. Biochemistry (Mosc), 2016, 81(5): 491-501.
[18] Shim SR, Kim SJ, Kim SI, et al. Prognostic value of the Glasgow Prognostic Score in renal cell carcinoma: a meta-analysis. World J Urol. 2016. doi:10.1007/s00345-016-1940-1.
Susceptibility weighted imaging in differentiating papillary from chromophobe renal cell carcinoma
ZHANG Yong-cheng1, YU Sheng-nan1*, CHEN Jie1, SUN Jun1, XING Shi-jun1, CHEN Tong-bing2
1Department of Radiology, Affiliated Third Hospital of Suzhou University, Changzhou 213000, China
2Department of Pathology, Affiliated Third Hospital of Suzhou University, Changzhou 213000, China
ACKNOWLEDGMENTSThis work was part of National Natural Science Foundation of China (No. 81371513).
Objective:To differentiate papillary RCC (pRCC) from chromophobe RCC (CRCC) based on intratumoral susceptibility signals (ITSSs) detected on SWI.Materials and Methods:A retrospective review was performed on patients with CRCC (n=9) or pRCC (n=12) classified by pathology. The ITSSs were classified into hemorrhage and microvessels based on their morphology. Nonparametric Mann-Whitney test was used to compare the differences in the dominant structure of ITSSs, the number of intratumoral vessels and hemorrhagic lesions, and the ratio of ITSS area on SWI between pRCC and CRCC. The diagnostic values of the dominant structure of ITSSs, the number of intratumoral vessels and hemorrhagic lesions, and the ratio of ITSS area on SWI in differentiating pRCCs from CRCCs were compared by receiver operating characteristics (ROC).Results:ITSSs were seen in 18 of 21 patients. No ITSSs were seen in 3 patients with CRCC. Mean scores of dominant structures of ITSSs on SWI were significantly higher for pRCCs than that for CRCCs (P<0.005). There was significant difference of the ratio of ITSS area on SWI between pRCCs and CRCCs (P<0.05). The number of hemorrhagic lesions in pRCCs was significantly larger than thatin CRCCs (P<0.05). The occurrence of intratumoral hemorrhage was more common in pRCCs (12/12, 100%) than that in CRCCs (6/9, 66.67%). The number of intratumoral hemorrhagic lesions revealed the highest positive predictive value (100%) and specificity (100%) as compared with other features, while the ratio of ITSS area on SWI showed the highest positive predictive value (87.5%) and sensitivity (88.89%).Conclusion:SWI is a useful technique to analyze the structural difference between pRCC and CRCC by the dominant structures ITSSs, the number of intratumoral hemorrhagic lesions, as well as the ratio of ITSS area on SWI.
Magnetic resonance imaging; Susceptibility weighted imaging; Kidney neoplasms; Carcinoma, renal cell; Subtype
Yu SN, E-mail: 15851921163@163.com
Received 28 Sep 2016, Accepted 8 Nov 2016
国家自然科学基金面上项目(编号:81371513)
1.苏州大学附属第三医院放射科,常州 213000
2.苏州大学附属第三医院病理科,常州 213000
俞胜男,E-mail:15851921163@163. com
2016-09-28
接受日期:2016-11-08
R445.2;R737.11
A
10.12015/issn.1674-8034.2016.12.006
张永成, 俞胜男, 陈杰, 等. 磁敏感加权成像技术鉴别乳头状和嫌色细胞肾癌的价值研究. 磁共振成像, 2016, 7(12): 921-925.*