ARTICLE High-Resolution Threshold Photoelectron Spectroscopy by Vacuum Ultraviolet Laser Velocity-Map-Imaging Method†
2016-04-08ZhouLuHongGaoYuntaoXuLeiYangChowShingLamYaniceBenitezNgDepartmentofChemistryUniversityofCaliforniaDavisCA95616USADatedReceivedonDecember2015AcceptedonDecember152015
Zhou Lu,Hong Gao,Yun-tao Xu,Lei Yang,Chow-Shing Lam,Yanice Benitez,C.Y.Ng∗Department of Chemistry,University of California,Davis CA 95616,USA(Dated:Received on December 1,2015;Accepted on December 15,2015)
ARTICLE High-Resolution Threshold Photoelectron Spectroscopy by Vacuum Ultraviolet Laser Velocity-Map-Imaging Method†
Zhou Lu,Hong Gao,Yun-tao Xu,Lei Yang,Chow-Shing Lam,Yanice Benitez,C.Y.Ng∗Department of Chemistry,University of California,Davis CA 95616,USA
(Dated:Received on December 1,2015;Accepted on December 15,2015)
Key words:Photoionization,Threshold photoelectron,Velocity-map imaging,Radical
†Part of the special issue for“the Chinese Chemical Society’s 14th National Chemical Dynamics Symposium”.
∗Author to whom correspondence should be addressed.E-mail: cyng@ucdavis.edu
I.INTRODUCTION
Due to the space charge e ff ect,ions cannot be prepared in high concentrations.As a result,most of the conventional methods for spectroscopic measurements of neutral species cannot be directly applied to the study of ions.Spectroscopic properties of cations, such as rotational and vibrational constants and ionization energies(IEs),can be directly measured by highresolution photoelectron spectroscopy.Thus,progress and development made in photoionization and photoelectron spectroscopy can be considered as advancement in ion spectroscopy.
Modern high-resolution photoelectron spectroscopic techniques that are based on the detection of zero kinetic energy(ZEKE)photoelectrons have their origin in the development of threshold photoelectron(TPE) measurements.The TPE spectroscopy,also previously referred to as ZEKE spectroscopy,was initiated about a half of century ago when tunable laboratory vacuum ultraviolet(VUV)photoionization sources based on monochromatized discharge radiation became available.By tuning the VUV photon energy across a photoionization transition band,the most popular approach for TPE detection involves the measurement of ZEKE photoelectrons using a dc extraction electric fi eld and a steradiancy analyzer,which essentially consists of a metal capillary to de fi ne a small solid angle for discriminating kinetic photoelectrons.Since ZEKE photoelectrons can be collected e ffi ciently with a small electric fi eld,this approach has been proven to give excellent TPE detection sensitivity.Nevertheless,the inability to discriminate against kinetic electrons traveling in the same solid angle de fi ned by the steradiancy analyzer[1], along with the relatively low optical resolutions o ff ered by tunable laboratory VUV discharge sources,has generally limited the TPE resolution to about 20−30 meV (full-width at half-maximum,FWHM).
When a high-resolution pulsed laser is used as the photoionization source,the employment of a delayed electric fi eld pulse(with respect to the application of the photoionization laser)for TPE extraction is expected to be e ff ective for dispersing kinetic photoelectrons,and thus improve the TPE resolution.This idea of using a pulsed laser photoionization source together with the delayed pulsed electric fi eld photoelectron detection has led to the development of the pulsed fi eld ionization (PFI)-ZEKE or PFI-photoelectron(PFI-PE)spectros-copic technique[2−4].The VUV-PFI-PE scheme was later understood to originate from the detection of ZEKE photoelectrons formed by Stark electric fi eld ionization of high-n(n>100)Rydberg states populated by pulsed VUV laser excitation.Thus,the development of the PFI-PE detection method can be considered to derive from the TPE measurement scheme.Subsequent to the discovery of the laser PFI-PE technique,Zhu and Johnson introduced a variation of the PFI detection method,namely,the mass analyzed threshold ionization (MATI)detection scheme by detecting PFI-photoions (PFI-PIs)instead of PFI-PEs formed by PFI of high-n (n>100)Rydberg states[5].Due to the need to separate prompt background ions from MATIs or PFI-PIs,the PFI-PI measurements are more di ffi cult to perform and the achievable energy resolution is generally lower compared to that for PFI-PE measurements.Nevertheless, the PFI-PI detection provides information about the mass identity as well as the internal energy state of the photoion formed from the neutral precursor molecule, and has shown to allow the preparation of rovibronically selected molecular ions for unimolecular and bimolecular dynamics studies[6−8].This aspect of PFI studies is not in the scope of the present experiment.
At the present time,the laser PFI-PE and PFI-PI detection techniques[9]are recognized as state-of-theart photoionization methods,which generally o ff er the highest energy resolution of 1−4 cm−1(FWHM).Although the VUV-PFI-PE and VUV-PFI-PI schemes are in principle applicable to all molecular systems,the application of these VUV laser PFI methods for the study of important molecular species,such as transient reaction intermediates and radicals,remains nontrivial.Since the PFI signal is derived from PFI of high-n (n>100)Rydberg species populated by photoexcitation (PEX)and the application of the electric fi eld pulse for PFI detection is usually delayed up to a fewµs with respect to the laser excitation,these high-n(n>100) Rydberg species can undergo decay induced by stray electric fi elds existed at the PEX/PI region.Without a careful e ff ort to minimize stray electric fi elds,the PFIPE and PFI-PI signals can be reduced,particularly in high-resolution PFI studies.This is the major disadvantage of PFI measurements.
A highly e ff ective method for the separation and thus suppression of kinetic electrons in TPE detection is the velocity-map imaging(VMI)photoelectron(VMI-PE) scheme,which has been demonstrated previously by using a tunable laboratory VUV discharge photoionization source[10],achieving an energy resolution limited mostly by the optical bandwidth of 3−30 meV (FWHM)of the VUV discharge sources used.In addition to the merit of velocity-focusing of photoelectrons, the VMI-TPE and VMI-PE detection schemes also allow the collection of all low energy photoelectrons because a relatively high dc extraction electric fi eld and a large imaging microchannel plate(MCP)detector can be used in VMI-PE measurements.That is,the VMIPE and VMI-TPE detection schemes do not su ff er from the signal-decay problem as in PFI measurements,and thus result in enhanced sensitivity for VMI-PE measurements.
The nature of VMI measurements is that the velocity resolution(∆v)depends only on∆r,and remains constant across the image(i.e.,for all the velocities),where r is the radial distance measured in term of the center of the VMI-PE image on the imaging detector.Thus, the achievable bandwidth(∆E)in term of photoelectron√kinetic energy(E)is expected to be proportional toE and can be signi fi cantly narrowed by lowering E[11].This relation suggests that the highest photoelectron resolution or the narrowest∆E value can be achieved by detecting TPEs as the VUV laser energy is scanned across the photoelectron transition bands of interest.This detection scheme is referred to the VUVVMI-TPE method.
Both the VMI-PE measurement of neutral photoionization[12]and the slow electron velocity-map imaging (SEVI)measurement[13,14]of anion phot √odetachment take advantage of the character of∆E∝E for VMIPE detection to achieve higher electron energy resolution.However,in many aspects,the VMI-PE and VMITPE measurements are di ff erent from the SEVI measurements.Photoionization of neutral species slightly below the ionization threshold is mediated by excitation to high-n Rydberg states.Due to the continuity of oscillator strength,the ionization threshold for neutral photoionization exhibits the step-function behavior[15].The measured photoionization thresholds for neutral species can be lowered by the applied electric fi eld in the photoionization/photoexcitation(PI/PEX) region,making it necessary to make Stark shift corrections,which is particularly important in high resolution photoelectron measurements.Anionic species have no Rydberg states;and the threshold law for anion photodetachment is proportional to E(l+1/2),where l is the angular momentum of the outgoing photoelectron.That is,the yield of photodetachment can be zero at true thresholds.The threshold law can also limit the photodetachment cross section to very low values at photon energies near the threshold.
Preliminary reports on the successful implementation and application of the VUV-VMI-TPE and VUV-VMIPE detection methods for the high resolution photoelectron study of propargyl radical(C3H3)have been communicated[12,16].In this work,we present more detailed considerations and procedures on the application of these methods using C3H3and allyl(C3H5)radicals and their cationsas examples. The comparison between the VUV-VMI-TPE spectra observed here and the VUV-PFI-PE spectra[17]reported previously has illustrated the excellent performance in sensitivity and resolution of the VUV-VMIPE and VUV-VMI-TPE methods.Because the IE of chlorobenzene(C6H5Cl)(IE(C6H5Cl)=9.072 eV)has been well-established by VUV-PFI-PE measurements[18,19]and is close to the IE(C3H3)=8.698 eV[12,17], we have also chosen C6H5Cl to demonstrate the VUVVMI-PE and VUV-VMI-TPE methods.
II.EXPERIMENTAL CONSIDERATION
In the present experimental study,two apparatuses were used,namely,the VUV laser PFI-PE apparatus and the VUV laser VMI-PE and VMI-TPE apparatus.The experimental arrangements and procedures employed in using these apparatuses for VUV-PFI-PE detections have been described in detail;and those for VUV-VMI-PE and VUV-VMI-TPE measurements have been brie fl y described in Refs.[12,16].Thus,a more detailed description for the VUV-VMI-PE and VUVVMI-TPE measurements is given below in the present study.
Both the PFI and VMI apparatuses employed in this work were equipped with a tunable VUV laser system,which was generated by resonance-enhanced fourwave di ff erence-frequency mixing(2ω1−ω2)schemes in a pulsed Kr or Xe gas jet as the nonlinear medium, where ω1and ω2represent the respective ultraviolet (UV)and visible laser frequencies generated by a UV and a visible dye laser,respectively.The UV and visible dye lasers were pumped by a common injection seeded Nd:YAG laser(Spectra-physics,GCR-290)operated at 30 Hz.The UV ω1frequency was fi xed at 212.556 nm (222.560 or 249.629 nm)to match the two-photon(2ω1) resonances of the Kr(Xe)transitions.The visible ω2output was scanned in the range of 485−760 nm to generate the desired VUV(2ω1−ω2)output range of 8.1−9.4 eV as required for the present experiment[16, 20,21].Here,the tunable VUV(2ω1−ω2)output was selected by an o ff-axis plano-convex MgF2lens before entering the PEX/PI region;and its intensity was monitored by a Cu photoelectric detector.The optical bandwidth of the VUV laser output was measured to be 0.12 cm−1(FWHM)for the VUV-PFI-PE apparatus [20,21]and 0.45 cm−1(FWHM)for the VUV-VMI-PE and VUV-VMI-TPE apparatus[22−26].
A.The VUV-PFI-PE apparatus
As described above,the VUV-PFI-PE apparatus consists of a pulsed(30 Hz)tunable VUV laser system as the photoionization source,a pulsed supersonic beam production system to introduce the gaseous sample,a time-of- fl ight(TOF)mass spectrometer for photoion detection,and a photoelectron spectrometer for PFIPE detection.The TOF ion mass spectrometer and the TOF electron spectrometer are situated above and below the PI/PEX center,such that the central axes of the TOF ion mass spectrometer and TOF electron spectrometer are perpendicular to the traveling direction of the molecular beam.
Using the VUV-PFI-PE apparatus along with procedures described previously[20,21,27−29],we have measured the VUV-PFI-PE spectra of C6H5Cl near its ionization threshold.In this experiment,the C6H5Cl vapor pressure at room temperature(11.8 Torr)was seeded in He to a total stagnation pressure of 30 psi prior to supersonic expansion through a pulse valve (General valve,repetition rate=30 Hz).The resulting C6H5Cl pulsed beam was skimmed by a conical skimmer(diameter=2 mm)before intersecting perpendicularly with the VUV(2ω1−ω2)laser beam in the PI/PEX center.The timings of operating the pulsed valve and the VUV photoionization laser were synchronized by delayed pulse generators(Stanford Research System,DG535).
B.The VUV-VMI-PE and VUV-VMI-TPE apparatus
The VUV-VMI-PE and VUV-VMI-TPE apparatus was modi fi ed from the VUV laser VMI-photoion(VMIPI)apparatus,which has been described in detail[22, 23,30].Since electrons are susceptible to perturbation by the Earth and stray magnetic fi elds,we have shielded the electron-imaging lenses and the electron TOF tube of the apparatus by two layers ofµmetals.The VUVVMI-PE and VUV-VMI-TPE apparatus,in sequential order,consists of a pulsed molecular beam production system,a set of VMI aperture lenses,a 75-cm electron TOF tube,and a VMI-PE detector.The VMI-PE detector comprises of a dual set of electron-imaging MCPs (diameter=75 mm),a P47 phosphor screen,and a CCD camera.
In the present experiment,the gas sample was seeded in He or Ar to a total stagnation pressure of 30 psi prior to supersonic expansion into the beam source chamber through a pulsed valve(Evan-Lavie Model: EL-5-2004,nozzle diameter=0.2 mm,30 Hz).The gas sample beam thus produced traveled along the central axes of the VMI lenses and the VMI-PE detector,and was skimmed by two conical skimmers(diameter=1 mm)before entering the PI/PEX region to intersect perpendicularly the VUV(2ω1−ω2)laser beam. The photoelectrons thus formed were velocity-focused and mapped onto the electron-imaging MCP detector [31].When collecting photoelectron images,the front MCP plate was grounded at all time,and a dc voltage of around+1.5 kV was applied to the second MCP plate.The amplitude of this dc voltage applied can alter the ampli fi cation of the photoelectron signal.Thus, the actual amplitude was adjusted depending on the signal level.A high voltage was applied to the P47 phosphor and the resulting fl uorescence was captured by a CCD camera and transferred to a computer using the DAVIS7 software provided by LaVision.The images recorded represent 3-dimensionsal(3D)Newtonian spheres mapped onto the 2D detector plane.The 3D distribution of photoelectrons can be reconstructedfrom the recorded 2D VMI-PE image by the inverse Abel transformation[32];and thus the kinetic energy distribution of photoelectrons can be obtained from the reconstructed 3D VMI-PE images.
We have measured the VUV-VMI-PE and VUVVMI-TPE spectra of C6H5Cl,C3H3and C3H5near their ionization thresholds.A supersonically cooled radical beam source based on 193.3 nm laser photodissociation of propargyl chloride(C3H3Cl)and allyl bromide(C3H5Br)was used to prepare the C3H3and C3H5radicals,respectively[12,16,20,33].The C3H3Cl (C3H5Br)precursor sample was introduced into the beam source chamber as a gas jet of~10%C3H3Cl (C3H5Br)seeded in He.The 193 nm ArF excimer laser pulse(GAM laser,pulse energy≈10 mJ,repetition rate=30 Hz)intersects the precursor sample jet at the tip of the nozzle,inducing the formation of C3H3(C3H5)radicals from photodissocation of C3H3Cl (C3H5Br).It has been demonstrated previously that radicals,such as C3H3and C3H5formed in the high pressure region of the pulsed jet can undergo supersonic cooling by collisions with He or Ar atoms in the jet. The supersonically cooled C3H3(C3H5)radical beam passed through two conical skimmers(diameter=1 mm) before intersecting the tunable VUV laser radiation at the PI/PEX region of the VUV-VMI apparatus.
The imaging MCP detector used has an active area with a diameter of 75 mm,and the distance between the PI/PEX center and the center of the MCP detector is 747 mm.The photoelectron signal arriving at the MCP is monitored by the 960 pixel×960 pixel area.For VMI-TPE measurements of C3H3,C3H5,and C6H5Cl, the smallest central image area of 0.5 mm×0.5 mm (3 pixels×3 pixels)was used to gate the VUV-VMITPE counts.Thus,the critical solid angle that characterizes the steradiancy TPE detector is very small, corresponding to a very high TPE energy resolution. The optimal resolution of the VMI-TPE technique can be achieved by lowering the electric fi eld applied at the PI/PEX region and reducing the pixel area at the center of the VMI-PE image during the scan of VUV laser energy.The VUV-VMI-TPE spectra obtained by scanning the VUV energy are normalized by the VUV intensities recorded by a Cu photoelectric detector.
III.RESULTS AND DISCUSSIONS
A main motivation of the present study of C6H5Cl, C3H3,and C3H5and their cations is to establish proper procedures for VUV-VMI-PE and VUV-VMITPE measurements as a general method for highresolution photoelectron spectroscopic studies.
A.VUV-PFI-PE,VUV-VMI-PE,and VUV-VMI-TPE measurements for
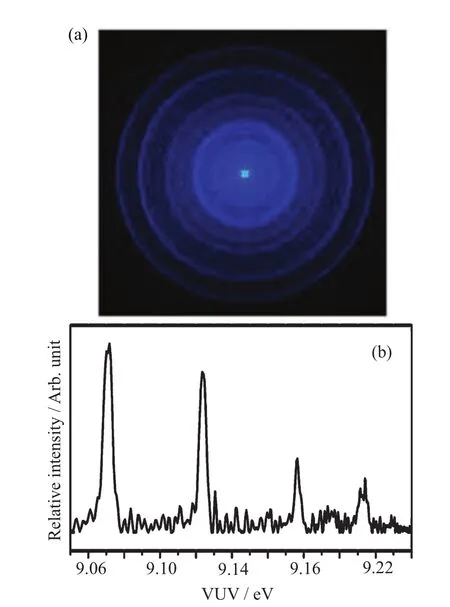
FIG.1(a)VUV-VMI-PEimagerecordedathν (VUV)=9.240 eV and F=33.2 V/cm.(b)VUV-VMI-PE spectrum for the formation of C6H5Cl+(X2B1)converted from the VMI-PE image shown in(a).
The study of a stable molecule such as C6H5Cl is aimed to illustrate the important consideration and procedures involved in the application of the VUV-VMI-PE and VUV-VMI-TPE methods.As an example,we show in Fig.1(a)the VUV-VMI-PE image for the formation ofobtained at hν(VUV)=9.240 eV and F=33.2 V/cm.On the basis of inverse Abel transformation and the consideration of VUV photon energy,this photoelectron image was converted to the VUV-VMIPE spectrum foras shown in Fig.1(b). The photoelectron bands ofresolved in Fig.1(b)correspond to the VMI-PE rings observed in Fig.1(a).
TheVUV-VMI-PEspectrumobservedat hν(VUV)=9.240eViscomparedtoVUV-VMIPE spectra formeasured at other hν(VUV)values of 9.110,9.150,9.185,9.200,9.220, 9.290,9.340,9.377,9.425,and 9.450 eV in Fig.2. The downward pointing red arrows marked the actual hν(VUV)energies used for individual VUV-VMI-PE measurements.The VMI-PE spectra reveal the excitation of two major vibrational progressions,nv6aand v7a+nv6a,n=0−2,as marked on top of the spectra in Fig.2.The present measurement yields 420±5 and 1120±5 cm−1for the v6aand v7avibrational frequencies,respectively,which are in good agreement with the previous(1+1′)PFI-PE measurements[19].

FIG.2The VUV-VMI-PE spectra for C6H5Cl+(X2B1) converted from VUV-VMI-PE images measured at the hν(VUV)=9.110,9.150,9.185,9.200,9.220,9.240,9.290, 9.340,9.377,9.425,and 9.450 eV and F=33.2 V/cm. The red downward pointing arrows represent the actual hν(VUV)values used for individual VUV-VMI-PE measurements.The top energy scale is the VUV energy in eV;and the bottom energy scale is in cm−1measured with respect to the peak of C6H5Cl+origin band.The vibrational assignments are marked by red droplines on top of the fi gure. The excitation of two major vibrational progressions,nv6aand v7a+nv6a,n=0−2,are observed as marked on top of the fi gure.
The comparison of Fig.2 shows that as hν(VUV)is decreased,the number of vibrational bands observable in the VUV-VMI-PE spectrum is reduced because of the reduced photoelectron kinetic energy span,which is determined by the di ff erence between the hν(VUV)employed and the origin band position of C6H5Cl+(X2B1). As pointed out above concerning the application of the VMI-PE method,the kinetic energy of photoelectrons ejected from a vibrational band is proportional to the square of photoelectron velocity,and thus to r2,where r is the radius of the VMI-PE ring observed on the imaging MCP detector.For a given hν(VUV),the outermost VMI-PE ring(radius=rmax)observed in this experiment correspond to the formation of the origin band of C6H5Cl+(X2B1).Thus,we expect that hν(VUV)used is proportional to rm2ax.This expectation is con fi rmed by the excellent linear plot of hν(VUV)versus rm2axplot observed in Fig.3.This linear plot yields an intercept of 9.070 eV at rmax=0.This value can be taken as the ionization threshold of C6H5Cl at a dc electric fi eld F=33 V/cm.To determine the IE(C6H5Cl)value from this intercept based on the VUV-VMI-PE measurements of Fig.2 requires the Stark shift correction. S tein rmce in t e hde Ib Ey ( Ct h 6eH 5VCUl )V=-7P 3F1I7-2P. 1E± m1.e6a csmur −em 1h ena ts b [1e 8 e,n 1 d9 e]-, a simple energy calibration of the VUV-VMI-PE spectra would involve normalizing the peak position of the VUV-VMI-PE origin band to the latter IE(C6H5Cl) value.
The comparison of the VUV-VMI-PE spectra in Fig.2 also reveals that as the photoelectron kinetic energy E for a selected vibrational band is decreased due to the lowering of the hν(VUV)value,the FWHMs
0 40000120000 80000
rmax/ Arb. unit
9.10
9.20
9.30
9.40
9.50
Photonenergy / eV
2 FIG.3 The plot of hν(VUV)versus r2max,where rmaxin arbitrary units represents the radius of the outmost ring of the VMI-PE image for the C6H5Cl+(X2B1)origin band measured at selected hν(VUV)values of 9.110,9.150,9.185, 9.200,9.220,9.240,9.290,9.340,9.377,9.425,and 9.450 eV and F=33.2 V/cm.A linear plot is observed,yielding an intercept of 9.070 eV at rmax=0. for the vibrational bands appearing in the spectra become narrower,indicative of higher energy resolutions at lower E values.This observation is as pointed out above.The FWHM for the origin band obtained hν(VUV)=9.110 eV is 25 cm−1,and is the lowest value observed in Fig.2.Spectral simulation indicated that this FWHM value represents a limit set by overlapping rotational transitions and the rotational temperature achieved in supersonic expansion for the C6H5Cl molecular beam.
The relation of∆E∝√E observed in the VUV-VMIPE measurement of C6H5Cl indicates that the highest resolution can be achieved by using the VUV-VMI-TPE method.This method involves scanning the hν(VUV) energy across the vibrational band of interest and gating the TPEs arriving at the center of the VMI-PE detector.We have recorded the VUV-VMI-TPE spectrum for C6H5Cl+(X2B1)in the hν(VUV)range of 9.05−9.22 eV,and this spectrum is compared in Fig.4 with the VUV-PFI-PE spectrum for C6H5Cl+(X2B1) measured in the range of 9.05−9.42 eV.The VUV-PFIPE spectrum has been corrected for the Stark shift effect,and thus the IE(C6H5Cl)is marked by the peak of the VUV-PFI-PE origin band.Due to the Stark shift e ff ect,the vibrational peaks observed in the VUVVMI-TPE spectrum are red shifted with respect to the corresponding vibrational peak resolved in the VUVPFI-PE spectrum.The assignment of the vibrational bands is marked on top of the spectra in the fi gure.In addition to the strong v6aand v7avibrational bands, weak vibrational bands attributable to v1and v12vibrational excitations are also observed in these spectra.Previous simulation of the VUV-PFI-PE origin band indicates that the PFI-PE resolution achieved was 1.5−2.0 cm−1(FWHM).The essentially identical structures and FWHMs(≈25 cm−1)for the vibrational
9.069.129.189.249.309.369.42
Relativeintensity/A
rb. unitυ1
υ6a
υ12υ7a+n*υ6a
VUV energy / eV
FIG.4(a)Comparison of the VUV-VMI-TPE spectrum (upper curve)with the VUV-PFI-PE spectrum(lower curve)for C6H5Cl+measured in the hν(VUV)range of 9.05−9.42 eV and F=33.2 V/cm.The VUV-VMI-PE spectrum has not been corrected for the Stark shift e ff ect, whereas the Stark shift for the VUV-PFI-PE spectrum has been corrected by normalizing the VUV-PFI-PE origin band of C6H5Cl+to the IE(C6H5Cl).The vibrational assignments are marked by red droplines on top of the spectra. bands observed in the VUV-VMI-TPE and the VUVPFI-PE spectra of Fig.4 support the conclusion that the photoelectron energy resolution attained in the VUVVMI-TPE measurement is comparable to that observed in the VUV-PFI-PE detection.
Although the FWHMs of vibrational peaks resolved in the VUV-VMI-TPE and VUV-PFI-PE spectra of Fig.4 are about the same,the energy pro fi les observed for the VUV-PFI-PE peaks appear to be different from those of the VUV-VMI-TPE peaks.In order to examine the di ff erent energy pro fi le of the VUV-PFI-PE and VUV-VMI-TPE vibrational band for,we show in Fig.5 the magni fi ed VUV-PFI-PE and the VUV-VMI-TPE spectra for the origin band of.The IE(C6H5Cl)is marked by the downward pointing blue arrow or the VUV-PFIPE peak as the VUV-PFI-PE spectrum has been corrected for the Stark shift due to the pulsed electric f i eld applied in the PFI-PE measurement.The di ff erent spectral characteristics observed in the VUV-VMITPE and VUV-PFI-PE measurements have been brie fl y discussed previously[16].As shown in Fig.5,both of these spectra are asymmetric.The VUV-PFI-PE origin band forshows higher intensities on the low energy side of the origin band,which have been attributed to forced autoionization in VUV-PFIPE measurements[4].The VUV-VMI-TPE spectrum reveals higher intensities on the high energy side due to contribution from hot photoelectrons,resulting in a tailing structure toward higher energies.The discrimination of hot photoelectrons in the present detection of TPEs or ZEKE photoelectrons is achieved by the VMIPE arrangement,such that the TPEs are expected to
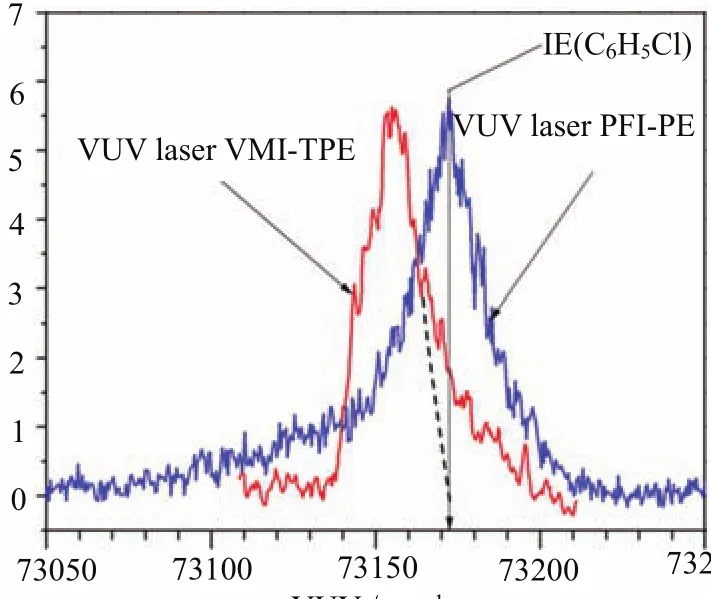
FIG.5 A magni fi ed plot of the VUV-VMI-TPE spectrum (red curve)and the VUV-PFI-PE spectru+m(blue curve) for the origin vibrational band of C6H5Clin the energy rhaansg bee oefn 7 c3o0r5re0c−te7d32 f5o0r ctmhe− 1S.taTrkhe s hVifUtV e -ffP eFctI.-P TEh esp veecrttriucmaldownward pointing arrow,which passes through the peak of the VUV-PFI? -PE spectrum marks the IE(C6H5Cl).The peak position of the VUV-VMI-PE spectrum is 17 cm−1 lower than that of the VUV-PFI-PE spectrum,attributing to the Stark shift induced by the dc fi eld of F=33.2 V/cm used in the VUV-VMI-PE measurement.The dashed line gives the estimated pro fi le of the VMI-TPE spectrum.The intensities above the dashed line can be attributed as the hot photoelectron background[16].
7305073100731507320073250 VUV / cm-1
Electronintensity/A
rb. unitarrive at the center of the imaging MCP detector.
B.DC Stark shift in VMI-TPE measurements for C6H5Cl+(X2B1)
A dc electric fi eld F=33.5 V/cm was applied at the PI/PEX region in the VMI-TPE measurement of theorigin band shown in Fig.4 and Fig.5. In an ideal situation of achieving completed discrimination of hot photoelectrons,the transmission for true TPEs is zero at the VUV energies above IE(C6H5Cl). Furthermore,we expect the energy pro fi le for VMI-PE detection is a symmetric function.We have estimated the energy pro fi le for the true VUV-VMI-TPE detection by drawing the dashed line in Fig.5 to separate the hot photoelectron contribution.That is,the signal above the dashed line are attributed to hot electrons travelling perpendicular to the MCP detector and arriving at the center of the VMI-PE image.The peak position of theorigin band observed in the VUV-VMITPE spectrum is found to be 17 cm−1lower than that found in the VUV-PFI-PE spectrum.This fi nding provides an estimate that the S√tark shift correction from the true IE(C6H5Cl)is−3.1F in cm−1,which is h√alf of the value predicated by classical formula of−6.1F in cm−1.

FIG.6The VUV-VMI-TPE spectra of the origin vibrationalbandofC6H5Cl+intheenergyregionof 73075−73225 cm−1measuredatthedcelectric fi eld F=33.2,66.2,98.4,130.5,and 162.0 V/cm.The vertical blue arrow marks the IE(C6H5Cl).The dashed curves are the Gaussian function fi ts to individual VUV-VMI-TPE bands.The intensities above the dashed curves at the high energy side of the VUV-VMI-TPE peak can be attributed to contribution of hot photoelectron background.
The PFI-PE method is based on the detection of ZEKE photoelectron originating from delayed PFI of high-n(n>100)Rydberg states by a delayed,PFI fi eld after laser excitation.It is well-established that the lowering of the ionization threshold in delayed P√FI detection is governed by the diabatic formula−4F in cm−1[34].To our knowledge,a detailed examination of the electric fi eld e ff ects on the VMI-PE and VMITPE methods has not been reported.We have performed a series of VUV-VMI-TPE measurements for theorigin band at the dc electric fi elds of F=33.2,66.2,98.4,130.5,and 162.0 V/cm.These spectra obtained without the Stark shift correction are depicted in Fig.6.The vertical line shown in the fi gure marks the IE(C6H5Cl)value determined in previous VUV-PFI-PE measurements.As shown in the fi gure, the increase of the dc electric fi eld F results in shifting of the VMI-TPE origin band to a lower hν(VUV) value together with broadening of the VMI-TPE origin band.All the VMI-TPE peaks observed in Fig.6 have a similar intensity pro fi le,i.e.,it drops rapidly on the low energy side and exhibits a tailing structure on the high energy side.We fi nd that the VMI-TPE peaks observed can be simulated well by a Gaussian function except the tailing structure toward higher energies as shown by the dashed curves of Fig.6.The intensities above the dashed curves can be attributed to hot photoelectrons.While the broader VMI-PE peaks observed at a higher F fi eld correspond to higher photoelectron intensities and thus better experimental sensitivity,the energy resolution observed is lower at a higher F value.
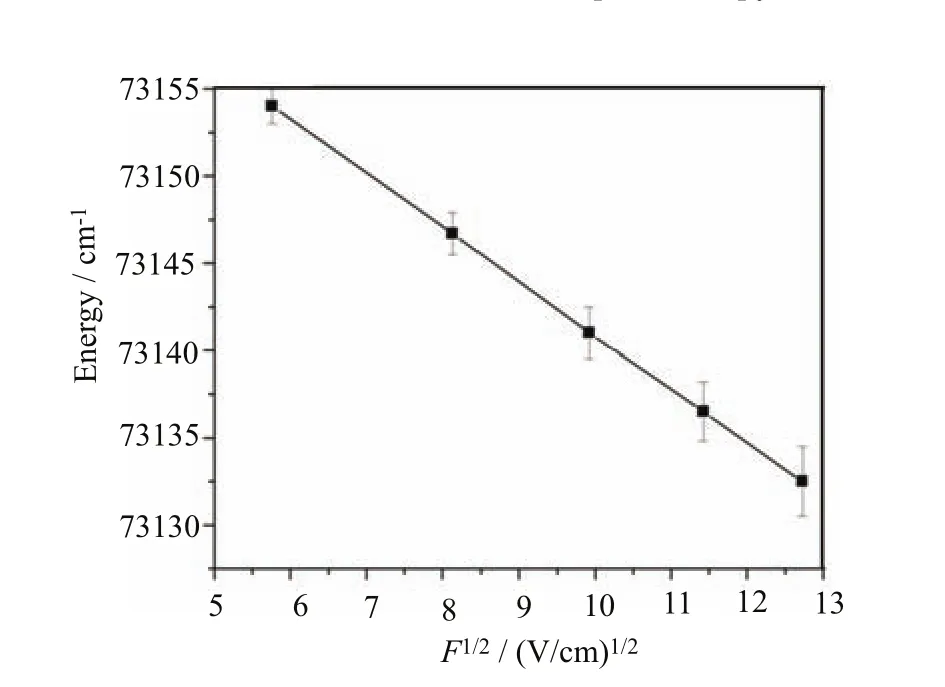
FIG.7 Plot of the peak position of the VUV-VMI-TPE spectrum for the C6H5Cl+origin band versus the square root of the dc electric fi eld F used for photoelectron extraction.The solid line represents a linear least squares fi t to the plot,giving a slope of−3.10±0.01 cm−1/(V/cm−1)1/2and an intercept of 73171.83±0.13 cm−1at F=0.
According to the Stark shift observed in the VUVVMI-TPE spectrum of Fig.5,the Stark shift induced by a F fi eld can be estimated by the formula, in cm−1.For the dc electric fi elds of F=33.2,66.2, 98.4,130.5,and 162.0 V/cm are predicted to be 35, 50,61,70,and 78 cm−1,respectively.These Stark shift values were found to be consistent with the VUVVMI-TPE peak positions observed in Fig.6.The Gaussian fi ts to individual VMI-PE peaks for F=33.2,66.2, 98.4,130.5,and 162.0 V/cm are shown as the dashed red curves in Fig.6.The center positions of the best fi t Gaussian curves are also in agreement with the peak positions of the V√MI-TPE spectra.The center peak positions of theF in Fig.7.The solid line is the linear least squares fi t to the data with a slope of−3.10±0.01 cm−1(V/cm)−1/2and an intercept of 7 iz3 a1t 7 io1 n . 8t3 h±r0es.1h3olcdm m−e1a.s u Sri n edce a tt h F e = l a0t,t e itr c vaanl u b ee i si d tehnet i ifio endas the IE(C6H5Cl).Thus,this least square analysis provided a more precise IE value compared to the values determined in previous VUV-PFI-PE measurements.Furthermore,the least squares fi t of F√ig.7 also provides a more precise formula,(−3.10±0.01)F in cm−1,for the Stark shift correction for the present VUV-VMI-TPE measurements.
C.VUV-VMI-TPE measurements of C3H3and C3H5
The high resolution photoelectron studies of C3H3and C3H5radicals have been made in previous VUVPFI-PE measurements[17,35,36].Recently,we have shown that high resolution studies of transient radicals, such as C3H3,can also be performed using the VUVVMI-PE and VUV-VMI-TPE methods[12,16].The present study provides further examinations of the dc electric fi eld e ff ect on the photoionization of C3H3and C3H5radicals.

FIG.8 The VUV-VMI-TPE spectra for the origin vibrational band of C3H3+measured at the dc electric fi elds of F=3.2,16.8,26.8,and 33.5 V/cm.The C3H3sample was prepared by a pulsed supersonically cooled radical beam source based on 193 nm photodissociation of C3H3Cl.All VUV-VMI-PE spectra have been co√rrected for the dc Stark shift according to the formula−3.1F cm−1.
Figure 8 depicts the VUV-VMI-TPE spectra for the origin band ofobtained at the applied dc electric fi elds of F=3.2,8.4,16.8,26.8,and 33.5 V/cm.The comparison of these spectra reveals that the FWHM for the VUV-VMI-TPE origin band increases as F is increased.All these spectra have been corrected for the dc Star√k shifts according to the formula derived above(−3.1F cm−1).At F=33.5 V/cm, the VMI-TPE spectrum reveals a left shoulder structure on the lower energy of the main peak,while a right shoulder structure is not noticeable.As the dc electric fi eld is decreased to 3.2 V/cm(the bottom trace in Fig.8),the right shoulder structure becomes discernible.The VUV-VMI-TPE spectrum obtained at F=3.2 V/cm is in excellent agreement with that reported recently by Gao et al.after taking into account the experimental uncertainties.The simulation (to be presented below)of the VUV-VMI-TPE spectrum obtained at F=3.2 V/cm yielded an IE(C3H3) (fr7o0m17 4th±e2 r cemce−n1t) V,wUhVic-hV Mis Iid-TenPtEic aml etoas tuhree mvaelnute bdyer iGveado et al.[16]and that from the VUV-PFI-PE measurements by Jacovella et al.[17]. Figur
e 9 compares the VUV-PFI-PE spectra for the C3H5+(X1A1)origin band measured by Xi et al.[36] (top curve)and Gasser et al.[35](middle curve)with that recorded by the present VUV-VMI-TPE measurement(bottom curve).All three experiments used a pulsed supersonic molecular beam source to introduce the radical sample into the PI/PEX center.The VUVPFI-PE experiment of Xi et al.used a radical beam source based on pyrolysis,and thus the rotational temperature achieved was higher and thus the FWHM of the origin band is larger compared to that attained in the experiment of Grasser et al.and the present VUVVMI-TPE experiment,which used a supersonic radical beam source based on 193 nm photodissociation.The dc electric fi eld used was F=3.2 V/cm;and the VUVVMI-TPE spectrum of Fig.9 has been corrected for the Stark shift.The double peak structure resolved in the VUV-PFI-PE spectra has been shown to arise from partially resolved rotational contours based on spectral simulations to be presented below.

FIG.9 Comparison of the VUV-MI-PE spectrum(bottom) for the C3H5+origin band with the VUV-PFI-PE spectra for the C3H5+origin band obtained by Xi et al.(top)and Gasser et al.[35](middle).The VUV-VMI-TPE spectrum was obtained by setting the dc electric fi eld F=3.2 V/cm. The VUV-VMI-TPE and the VUV-PFI-PE spectra have been corrected for the Stark shift e ff ect.
D.Simulation of the origin bands for C3H3+(X1A1)and C3H5+(X1A1)
The observation of partially resolved rotational contours in the VUV-VMI-TPE spectra allows rotational simulations of the VUV-VMI-TPE origin bands ofandas shown in Fig.10 and Fig.11,respectively.Although the semi-empirical simulation presented below cannot be considered as de fi nitive,it is useful for providing a more precise IE value and a more reliable spectral assignments.The semi-empirical simulation procedures have been discussed in detail previously,and thus only a brief description of the selection rules for the molecular symmetry group C2v(M)is given below[16,17,35−39].
Since both the neutral and cationicandsystems belong to the molecular symmetry group C2v(M),the asymmetric top rotational energy levels can be labeled as,whereis the total angular momentum quantum number andare the projection quantum numbers of the neutral(cation).By using the previous reported rotational constants A′′,B′′,and C′′and[16,35,36],the Ray’s asymmetry parameters,de fi ned as(2B′′-A′′-C′′)/(A′′-C′′)for the neutral and

FIG.10ComparisonoftheVUV-VMI-TPEspectrum for the origin band of C3H3+in the region of 70050−70300 cm−1with the best simulated spectrum, which is the sum of all rotational branch contributions (shown below the best simulated spectrum).The simulation is based on the selection rules that∆Ka=odd and ∆Kc=even and odd.The simulation uses a Gaussian instrumental pro fi le(FWHM=3.5 cm−1),assumes a rotational temperature of 35 K,and the rotational branch ratios of N:O:P:Q:R:S:T=2:3:5:3:5:3:2.

C+)/(A+-C+)for the cation,yield the value of−0.998(−0.998)and−0.926(−0.905)for ofand).Since the asymmetric parameters are very close to−1,bothand C3H5can be considered as prolate symmetric top molecules.The rotational energy levels(Erot)of C3H3andare calculated by diagonzalizing the Hamiltonian matrix using the symmetric top rotational basis set.The intensityfor a rotational transition from a neutral state to a cationic level is proportional to the rotational population of the neutral molecule according to the Boltzmann distribution, where Trotrepresents the rotational temperature for the molecular sample,∆Erotis the rotational energy measured with respect to the ground rovibronic state of the neutral molecule,and rBis a scaling parameter for a given rotational branch.In the electric dipole approximation for the selection rule,the conservation of the total angular momentum ignoring the electron spin gives:|∆J|=|J+−J′′≤l+1,where l represents the orbital angular momentum quantum number of the outgoing photoelectron.The simulation takes into consideration of the rotational branches,N,O,P,Q,R,S,and T for ∆J=0,±1,±2,and±3.
Thegeneralsymmetryselectionrulesforhasbeendiscussedindetailpreviously[16,17].The symmetry analysis of the rovibronic wavefunctions for the neutral and cation shows that the rotational selection rules for the photoionization
was recorded at F=3.2 V/cm, achieving a FWHM of 18 cm−1.The simulation is based on the selection rules that∆Ka=odd,∆Kc=odd for l=odd, and∆Ka=even,∆Kc=even for l=even,where l represents the orbital angular momentum quantum number of the outgoing photoelectron.The best simulated spectrum was obtained b assumes a Gaussian instrumental pro fi le (FWHM=1.0 cm−1),a rotational temperature of 20 K,and rotational branch ratios of N:O:P:Q:R:S:T=3:4:7:6:7:4:3.

Figure 10 reveals the best overall simulated spectrum (second spectrum from the top)in comparison with the experimental VMI-TPE spectrum(top spectrum)obtained at F=3.2 V/cm.Since two H atoms are located symmetrically about the main molecular axis of C3H3, it is necessary for the neutral rotational population to take into account the nuclear spin statistics,yielding a ratio of 3:1 for even.The best simulated spectrum for the formation ofis the sum of the rotational contributions of the Q;P and R;O and S;and N and T branches shown below the best overall simulated spectrum in Fig.10.The corresponding rotational branching ratios that give the best simulation are N:O:P:Q:R:S:T=2:3:5:3:5:3:2.The simulation also provide a rotational temperature of Trot=35 K for the C3H3radical sample.The experimental VUVVMI-TPE spectrum was simulated by assuming a Gaussian instrumental energy function(FWHM=3.5 cm−1). The experimental spectrum reveals a main peak with the distinctive left and right shoulders.The main peak of theorigin band is contributed by the photoionization transitionwhich lies 9 cm−1higher than the IE(C3H3)de fi ned the photoionization transitionThe simulation yields the IE(C3H3)value of 70169 cm−1.Since F=3.2 V/cmis applied in the PI/PEX region during the TPE detection,the Stark shift correction is determined to be 5.4 cm−1.Thus,the IE(C3H3)is determined to be 70174.4±3.5 cm−1,which is in excellent agreement with the published IE values of 70175±2 and 70174.5±2.0 cm−1determined by Hong et al.[16]and Jacovella et al.[17]respectively.
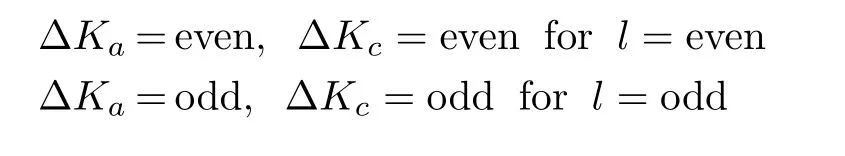
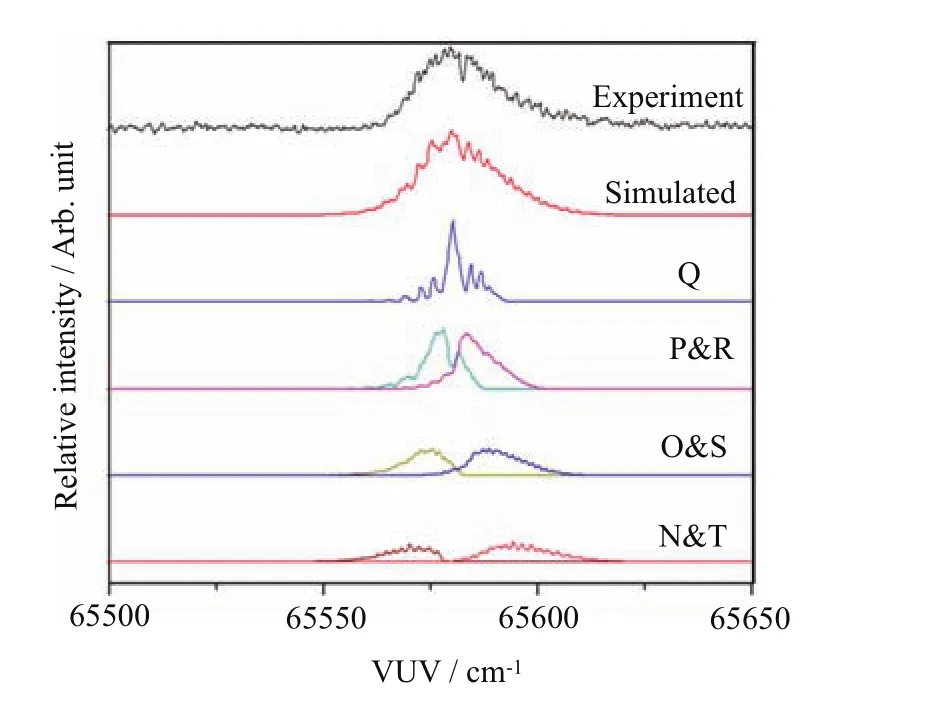
Figure 11 depicts the best overall simulated spectrum (second spectra from the top)for the comparison with the experimental VMI-TPE spectrum(top spectrum) obtained at F=3.2 V/cm.The best simulated spectrum represents the sum of the contributions of the N,O,P,Q,R,S,and T-branches with the branching ratios of N:O:P:Q:R:S:T=3:4:7:6:7:4:3.The simulation yielded an estimate of 20 K for the rotational temperature Trotof C3H5radicals.The experimental VUV-VMI-TPE spectrum was simulated by a Gaussian instrumental energy function(FWHM=1 cm−1).The experimental VUV-VMI-TPE spectrum for the origin band oreveals a discernible double peak structure,which is also observed in the previous PFIPE measurements[35,36].The double peak structure (separation≈5 cm−1)observed in the VUV-VMI-TPE curve is less pronounced compared to that found in the previous VUV-PFI-PE,and is mainly contributed by the P and R rotational branches.The simulation yields an ionization threshold of 65580 cm−1for C3H5.After taking into account the Stark shift of 5.4 cm−1due to the applied of F fi eld of 3.2 V/cm at the PI/PEX region,the IE(C3H3)is determined to be 65585±2 cm−1. This latter value is also in good accord with the previous PFI-PE measurements of 65584.6±2 cm−1determined by Xing et al.[36]and 65580.1±2.0 cm−1obtained by Gasser et al.[35].
E.VUV-VMI-PE spectra for
The VUV-VMI-PE and VUV-VMI-TPE detection schemes are complimentary methods,which provide high detection sensitivity as well as high energy resolution.Although the VUV-VMI-TPE method can achieve higher energy resolution,it requires the continuous scanning over a wide VUV energy range.The VUV-VMI-PE technique has the capability of detecting photoelectrons over a broad energy range with good energy resolutions,and can avoid the time consuming and challenging task of tuning the VUV laser over a wide energy range.
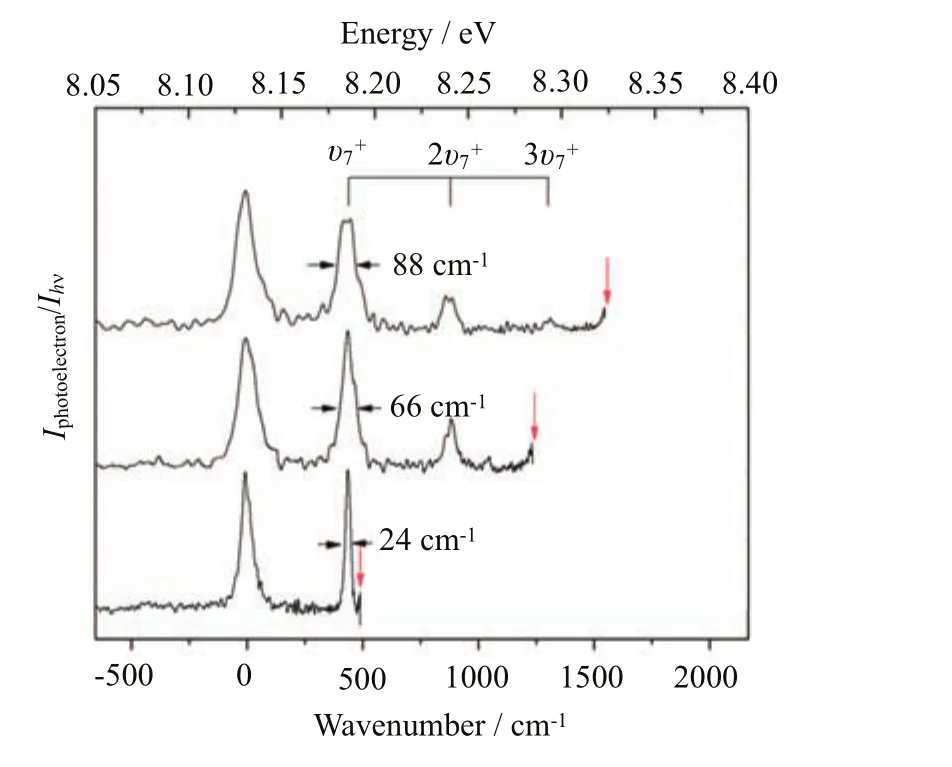
FIG.12 The VMI-PE spectrum for C3H5+converted from VUV-VMI-PE images recorded at the respective VUV energies of 8.192,8.284,and 8.323 eV(marked by downward pointing arrows).The vibrational assignments are marked by drop lines.The top scale is VUV energy in eV and the bottom energy scale is measured with respect to the origin band of C3H5+.
The application of the VUV-VMI-PE method on radical species has been demonstrated in the previous study of;and the VUV-VMI-PE study ofhas not been made.Figure 12 depicts the VUV-VMI-PE spectra forrecorded at F=33.5 V/cm and hν(VUV)=8.192,8.284,and 8.323 eV.The photoelectron kinetic energiesof the VMI-PE spectrum were calibrated by setting the peak position of the VMI-PE origin band ofto equal the IE(C3H5) value of 65585±2 cm−1.The VUV-VMI-PE spectra reveal discernible excitation of the v7+(C−C−C bending) vibrational progression at 436,741,876,and 1309 cm−1 above theorigin band[35,36].Similar to the comparisonof the VUV-VMI-PE spectra forshown in Fig.2,the VUV-VMI-PE spectra forof Fig.12 show that the VMI-PE resolution improves as the hν(VUV)is decreased closer to the ionization threshold of C3H5,resulting in narrower FWHMs of the vibrational bands for[11].As an example,the FWHM of thevibrational band was found to decrease from 88 cm−1to 66 cm−1 to 24 cm−1as the hν(VUV)energy is decreased from 8.323 eV to 8.284 eV to 8.192 eV.
IV.CONCLUSION
We have recorded the VUV-VMI-TPE and VUVVMI-PE spectra of,,andnear their ionization thresholds,aiming to establish the experimental procedures for general high-resolution photoelectron measurements of gaseous molecules.The comparison of these measurements with the corresponding VUV-PFI-PE measurementsshows that the energy resolutions achieved in the VUVVMI-TPE and VUV-PFI-PE detection are comparable. Since a relatively large dc fi eld can be used to extract all photoelectrons produced,we expect the VMI-PE method to have higher detection sensitivity than that observed in the PFI-PE method.The VUV-VMI-TPE spectra of C6H5Cl,C3H3,and C3H5have also been examined as a function of the applied dc electric fi eld F employed for photoelectron extraction.The analysis of the observed Stark shift for the VU√V-VMI-TPE measurements yields a Stark shift of−3.1F in cm−1, whichis half the value predicted by classical formula in cm−1.
V.ACKNOWLEDGMENTS
This work was supported by the National Science Foundation under CHE-0910488 and CHE-1462172.C. Y.Ng also acknowledges the support by the Chemical Sciences,Geosciences and Biosciences Division,Offi ce of Basic Energy Sciences,O ffi ce of Science,(US) Department of Energy(DOE)under Contract No.DEFG02-02ER15306.
[1]T.Baer,W.B.Peatman,and E.Schlag,Chem.Phys. Lett.4,243(1969).
[2]K.Mller-Dethlefs,M.Sander,and E.W.Schlag,Chem. Phys.Lett.112,291(1984).
[3]K.Muller-Dethlefs and E.W.Schlag,Annual Rev. Phys.Chem.42,109(1991).
[4]E.W.Schlag,ZEKE Spectroscopy,Edition Anglaise, Cambridge:Cambridge University Press,(1998).
[5]L.Zhu and P.Johnson,J.Chem.Phys.94,5769(1991).
[6]Y.C.Chang,H.Xu,Y.Xu,Z.Lu,Y.H.Chiu,D.J. Levandier,and C.Y.Ng,J.Chem.Phys.134,201105 (2011).
[7]Y.Xu,B.Xiong,Y.C.Chang,and C.Y.Ng,J.Chem. Phys.137,241101(2012).
[8]Y.Xu,B.Xiong,Y.C.Chang,and C.Y.Ng,J.Chem. Phys.139,024203(2013).
[9]C.Y.Ng,Annu.Rev.Phys.chem.53,101(2002).
[10]T.Baer and Y.Li,Int.J.Mass Spectrom.219,381 (2002).
[11]C.J.Hammond and K.L.Reid,Phys.Chem.Chem. Phys.10,6762(2008).
[12]H.Gao,Z.Lu,L.Yang,J.Zhou,and C.Y.Ng,J. Chem.Phys.137,161101(2012).
[13]C.Nicole,I.Sluimer,F.Rosca-Pruna,M.Warntjes, M.Vrakking,C.Bordas,F.Texier,and F.Robicheaux, Phys.Rev.Lett.85,4024(2000).
[14]A.Osterwalder,M.J.Nee,J.Zhou,and D.M.Neumark,J.Chem.Phys.121,6317(2004).
[15]D.M.Neumark,J.Phys.Chem.A 112,13287(2008).
[16]H.Gao,Y.Xu,L.Yang,C.S.Lam,H.Wang,J.Zhou, and C.Y.Ng,J.Chem.Phys.135,224304(2011).
[17]U.Jacovella,B.Gans,and F.Merkt,J.Chem.Phys. 139,084308(2013).
[18]X.Ripoche,P.Asselin,F.Piuzzi,and I.Dimicoli, Chem.Phys.175,379(1993).
[19]T.G.Wright,S.I.Panov,and T.A.Miller,J.Chem. Phys.102,4793(1995).
[20]C.S.Lam,H.Wang,Y.Xu,K.C.Lau,and C.Y.Ng, J.Chem.Phys.134,144304(2011).
[21]H.Woo,K.C.Lau,J.Zhan,C.Y.Ng,C.L.Li,W. K.Li,and P.M.Johnson,J.Chem.Phys.119,7789 (2003).
[22]H.Gao,Y.Song,W.M.Jackson,and C.Y.Ng,J. Chem.Phys.138,191102(2013).
[23]H.Gao,Y.Song,L.Yang,X.Shi,Q.Yin,C.Y.Ng,and W.M.Jackson,J.Chem.Phys.135,221101(2011).
[24]Z.Jingang,B.Jones,Y.Xueliang,W.Jackson,and C. Y.Ng,J.Chem.Phys.128,014305(2008).
[25]X.Yang,J.Zhou,B.Jones,C.Y.Ng,and W.M.Jackson,J.Chem.Phys.128,084303(2008).
[26]J.Zhou,K.C.Lau,E.Hassanein,H.Xu,S.X.Tian, B.Jones,and C.Y.Ng,J.Chem.Phys.124,034309 (2006).
[27]Y.Hou,H.K.Woo,P.Wang,X.Xing,C.Y.Ng,and K.C.Lau,J.Chem.Phys.129,114305(2008).
[28]K.C.Lau,H.Woo,P.Wang,X.Xing,and C.Y.Ng, J.Chem.Phys.124,224311(2006).
[29]B.Reed,C.S.Lam,Y.C.Chang,X.Xing,D.S.Yang, and C.Y.Ng,Astrophys.J.693,940(2009).
[30]Z.Lu,Y.C.Chang,Q.Z.Yin,C.Y.Ng,and W.M. Jackson,Science 346,61(2014).
[31]A.T.J.B.Eppink and D.H.Parker,Rev.Sci.Instrum. 68,3477(1997).
[32]C.J.Dasch,Appl.Opt.31,1146(1992).
[33]S.Willitsch,J.M.Dyke,and F.Merkt,Helvetica Chim. Acta 86,1152(2003).
[34]S.Pratt,J.Chem.Phys.98,9241(1993).
[35]M.Gasser,A.M.Schulenburg,P.M.Dietiker,A.Bach, F.Merkt,and P.Chen,J.Chem.Phys.131,014304 (2009).
[36]X.Xing,B.Reed,K.C.Lau,C.Y.Ng,X.Zhang,and G.B.Ellison,J.Chem.Phys.126,171101(2007).
[37]R.Signorell and F.Merkt,Mol.Phys.92,793(1997). [38]S.Willitsch,A.Haldi,and F.Merkt,Chem.Phys.Lett. 353,167(2002).
[39]S.Willitsch and F.Merkt,Int.J.Mass Spectrom.245, 14(2005).
杂志排行

CHINESE JOURNAL OF CHEMICAL PHYSICS的其它文章
- ARTICLE E ffi cient Separation of Ar and Kr from Environmental Samples for Trace Radioactive Noble Gas Detection†
- REVIEW Polarization Dependent Time-Resolved Infrared Spectroscopy and Its Applications†
- ARTICLE Reactions of Group V Metal Atoms with Hydrogen Sul fi de:Argon Matrix Infrared Spectra and Theoretical Calculations†
- ARTICLE Structural Dynamics of Phenyl Azide in Light-Absorbing Excited States: Resonance Raman and Quantum Mechanical Calculation Study†
- ARTICLE Structural and Infrared Spectroscopic Study on Solvation of Acetylene by Protonated Water Molecules†
- ARTICLE Excited-State Proton Transfer and Decay in Hydrogen-Bonded Oxazole System:MS-CASPT2//CASSCF Study†