Sample Plot Change in the Seventh Review of Continuous National Forest Inventory in Zigui County
2016-01-11,,,,,
, , , , ,
Zigui Forestry Science and Technology Promotion Center, Yichang 443600, China
SamplePlotChangeintheSeventhReviewofContinuousNationalForestInventoryinZiguiCounty
ZhongmeiDENG*,JiaxuanXIANG,JunSONG,XueyongQIN,DongweiWANG,LeiZHOU
Zigui Forestry Science and Technology Promotion Center, Yichang 443600, China
The following qualitative conclusions of forest resources in Zigui can be drawn by the research on 73 plots and 5 vegetation plots: forest area is increasing; forest growing stock is increasing; the adjustment of forest category structure is constantly improved; forest quality has been improving; stand structure is optimized continuously; biodiversity has initially appeared.
National Forest Inventory, The seventh review in Zigui, Sample plot change
1 Introduction
Zigui County is a county of western Hubei Province. It is under the administration of Yichang City and encompasses the easternmost portion of the Yangtze River Gorges, including the Xiling Gorge. Most of Zigui is hilly or mountainous with basic farming and tea production. There are many small coal mines in the mountains, with the coal trucked to the river then loaded onto barges for shipping downstream. The forest resources of Zigui directly affect the safety of the Three Gorges Dam. To provide accurate data to the state and evaluate forest resource status in Zigui County, according toNoticeonCarryingouttheSeventhReviewofContinuousForestInventoryinHubeiProvinceissued by Hubei Provincial Department of Forestry, Forestry Bureau of Zigui County attaches great importance to the evaluation and sends six professional technical personnel to conduct a 90-day survey on 73 review sample plots and 5 vegetation sample plots, successfully passing through the final inspection and acceptance of Central South Forest Inventory and Planning Institute of the State Forestry Administration.
2 Basic situation
The sample points are set according to the province’s mechanical sampling method, one sample point for every 4 km ×8 km. The county has a total of 73 permanent sample plots, and the sample plot is square (25.82 m×25.82 m). There are 30 forest-measurement sample plots and 43 non-forest-measurement sample plots (early period survey). Compared with the previous survey, this survey covers the vegetation sample plot, one sample plot per 20 km ×20 km. The county has a total of 5 permanent sample plots, and the sample plot is square (4 m×4 m). The central pit and angular pit are added. The survey was conducted from May 2014 to October 2014. The sample plot type, amount of sample plot and plot number are shown in Table 1.
3 Survey methods
(i) Finding sample plots and central pile. The sample plots and central pile are found by GPS and original guide. (ii) Measuring four corners and four sides. The compass is erected on central pile to measure the length of north, east, south and west points. At the north point, the compass is erected to measure the length from north to south, and north to west. At the south point, the compass is also erected to the length from south to east, and south to west. Finally the error of closure is calculated. (iii) Measuring locater and sample tree. At the central pile, the compass is erected to measure the azimuth angle and horizontal distance of locater. And the azimuth angle and horizontal distance of sample tree are also measured. (iv) Sample tree scaling. Groove is cut at 1 meter, it is scaled and marked at 1.3 meters, and plate is nailed at 10 centimeters from the ground. (v) Survey records. 63 factors are investigated and recorded in detail, without omissions. (vi) Marking. At 1 meter inside central pile, central pit is dug, and 90°angular pit is dug outside angular pile. (vii) Photographing. The photos of central pile, locater and panoramic photos are taken. (viii) Acquiring coordinates and track. GPS is used to acquire horizontal and vertical coordinates as well as track.
4 Key technology
(i) Resetting correctly. Resetting involves the azimuth angle and horizontal distance of central pile, angular pile, locater and sample tree. (ii) Measuring accurately. Azimuth, horizontal distance and diameter are measured. (iii) Judging accurately. In-boundary wood, out-boundary wood and on-line wood are accurately judged. (iv) Marking clearly. The marks include central pile, central pit, angular pile, angular pit, locater, out-boundary wood, sample tree kerf, sample tree scaling point and sample tree aluminum plate.
5 Review results
5.1PlotcompositionThere are 73 sample plots in the county. Through this review, in terms of sample plot type, there are 55 forest land sample plots and 18 non-forest sample plots; in terms of land type, there are 26 pieces of arbor forest land, 18 pieces of special shrubbery land, 10 general shrubbery land, 1 piece of other forestation-suitable land, 1 piece of unused land, 13 pieces of arable land, 3 pieces of water area, and 1 piece of transportation and construction land.
Table1Plottype,amountofsampleplotandplotnumber

PlottypeAmountofsampleplotPlotnumberArborforests276090,5879,5877,5882,5881,5402,5876,5638,5404,5874,5872,6093,6296,5634,5868,5149,4894,5153,5870,4898,5156,5398,5869,4889,4890,4893,5399Specialshrubbery175641,5880,5883,5403,5637,5636,5151,4895,5154,4892,5155,4896,4897,5407,5147,5148,5397Generalshrubbery105643,6095,5878,6097,5875,5152,4632,5400,4634,4633Otherforestation-suitableland15642Arableland136092,5640,5639,5873,5635,6091,6094,6295,4891,5405,5633,5401,5871Waterarea35644,5406,5150Unusedland15632Transportationandconstructionland15645
5.2ChangeinsampleplottypeThe county has 73 sample plots, and there are changes in 5 permanent sample plots. 2 permanent sample plots are changed due to other human factors; 2 permanent sample plots are changed due to planting adjustment; 1 permanent sample plot is changed because of artificial upgrading. 2 plots are changed due to other human factors, and the original type is shrub forest land, namely 5152 and 5400, and it is changed into planned afforestation land. In the absence of management, the citrus is withered. 2 plots are changed due to planting adjustment, namely 4892 and 4895, and the original type is arable land. The planting structure is adjusted during an interval. Through reforestation, the original land, where citrus is planted, is identified as economic shrub land in this survey. 1 sample plot is changed due to artificial upgrading, namely 4893, and the original type is arbor forest land. During this survey, it is mostly planted with citrus, and it is identified as economic shrub land.
5.3Changeinnon-landtypeIn this review, in addition to land type change, there are also changes in forest category, age group, origin, dominant tree species, and vegetation type. There are different types of changes in 39 sample plots. 5 sample plots go through forest category change, namely 4892, 4896, 5400, 5152 and 5151. 3 plots are changed from arable land to fruit forest land, namely 4892, 4896 and 5151, and the change is due to the adjustment of planting structure. The previous fruit forest land is changed into soil conservation forest land (5152) and water conservation forest land (5400), and the change is due to other natural variations. 10 sample plots go through the age group changes, namely 5636, 5876, 5637, 5403, 5868, 5399, 5870, 5869, 4894 and 4889. 6 sample plots are changed from the early young forest land to half-mature forest land, namely 5868, 5399, 5870, 5869, 4894 and 4889, and the change is due to natural variation. 1 sample plot (5876) is changed from young forest land to near-mature forest land, and the change is due to natural variation. Due to natural variation, 2 sample plots change from initial production stage to abundant production stage, namely 5636 and 5403, and 1 sample plot changes from pre-production stage to initial production stage, namely 5637. 5 sample plots go through the origin change, namely 4892, 4896, 5400, 5152 and 5151. Due to planting structural adjustment, 3 sample plots change from farmland to tree planting land, namely 4892, 4896 and 5151; due to other natural variations, 2 sample plots change from tree planting land to natural land, namely 5400 and 5152. 10 sample plots go through the change in dominant tree species, namely 5882, 6296, 4898, 5868, 5149, 4892, 4896, 5400, 5152 and 5151. Due to natural variation, 1 sample plot changes from locust forest land to mixed broadleaf forest land, namely 5882; 1 sample plot changes from Quercus L. forest land to mixed broadleaf forest land, namely 6296; 1 sample plot changes from fir forest land to mixed broadleaf-conifer forest land, namely 4898; 1 sample plot changes from cypress and birch forest land to fir forest land, namely 5868; 1 sample plot changes from mixed broadleaf-conifer forest land to cypress forest land, namely 5149. Due to planting structural adjustment, 3 sample plots change from farmland to citrus land, namely 4892, 4896 and 5151. Due to other natural variations, 2 sample plots change from citrus land to rose and other shrub land, namely 5400 and 5152. 7 sample plots go through vegetation type change, namely 4898, 5868, 4892, 4896, 5400, 5152 and 5151. Due to natural variation, 1 sample plot changes from warm coniferous forest land to warm mixed broadleaf-conifer forest land, namely 4898; 1 sample plot changes from broadleaf forest land to coniferous forest land, namely 5868. Due to planting structural adjustment, 2 sample plots change from field crop land to shrubbery land, namely 4892 and 4896. Due to other natural variations, 2 sample plots change from shrubbery land to deciduous broad-leaved shrub forest land, namely 5400 and 5152. Due to other human factors, 1 sample plot changes from farmland to shrubbery land, namely 5151.
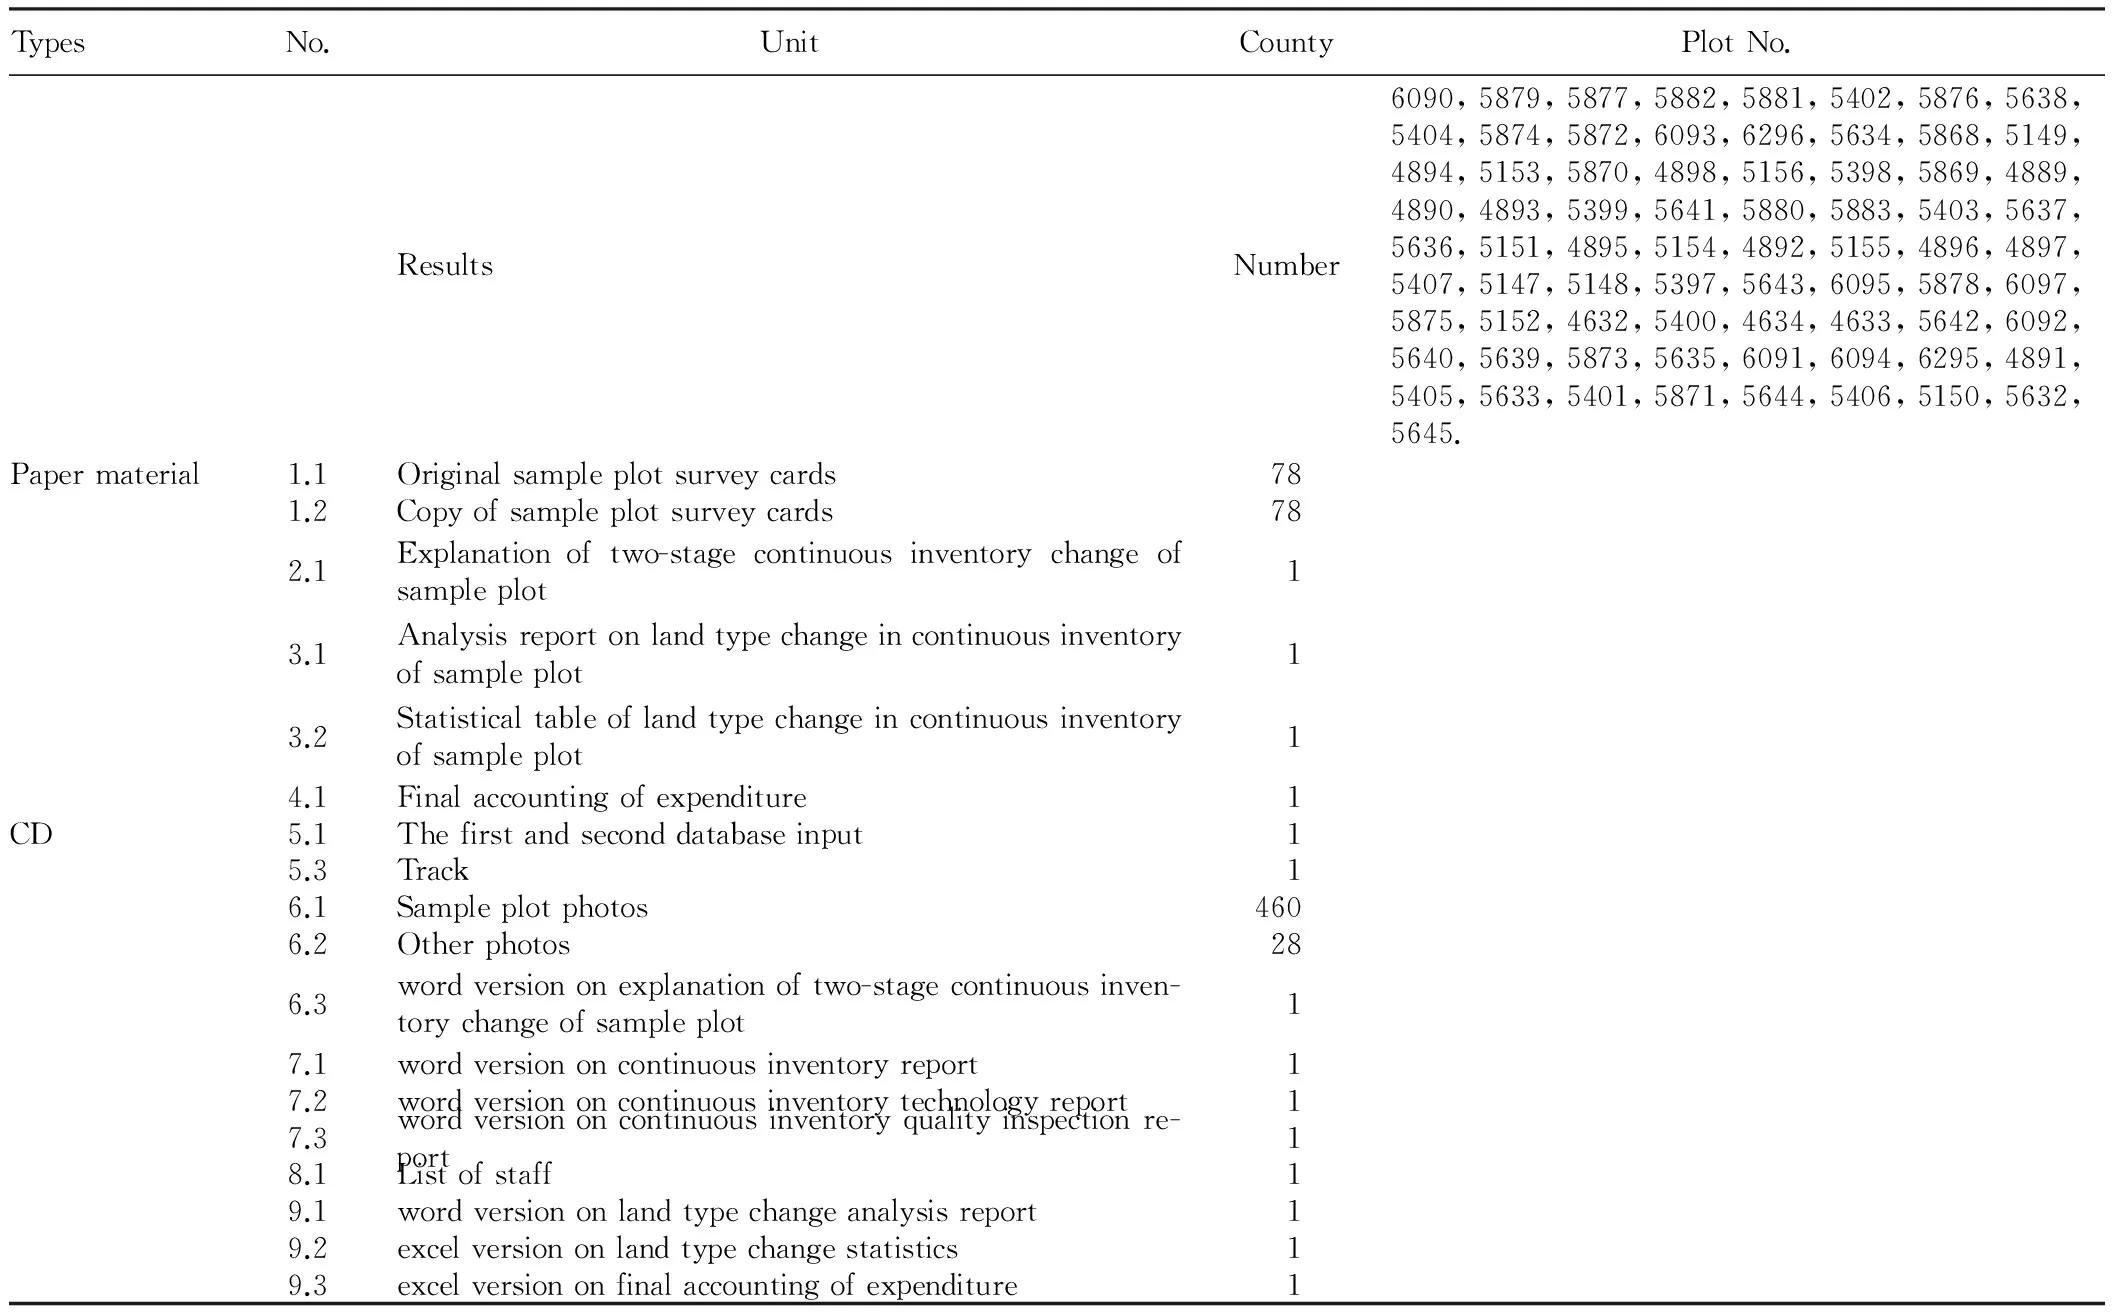
5.4VegetationplotAccording to the 20 km ×20 km spacing distance and systematic sampling method, 5 vegetation sample plots are selected from Zigui County, namely 5150, 5155, 5869, 5874 and 5879. One is water area, one is farmland and the other three are sample plots. There are many results obtained during this survey, as shown in Table 2.
5.5SurveyresultsThere are many results obtained during this survey, as shown in Table 2.
Table2ContinuousinventoryandtheseventhreviewresultsinZiguiCounty

TypesNo.UnitCountyPlotNo.ResultsNumber6090,5879,5877,5882,5881,5402,5876,5638,5404,5874,5872,6093,6296,5634,5868,5149,4894,5153,5870,4898,5156,5398,5869,4889,4890,4893,5399,5641,5880,5883,5403,5637,5636,5151,4895,5154,4892,5155,4896,4897,5407,5147,5148,5397,5643,6095,5878,6097,5875,5152,4632,5400,4634,4633,5642,6092,5640,5639,5873,5635,6091,6094,6295,4891,5405,5633,5401,5871,5644,5406,5150,5632,5645.Papermaterial1.1Originalsampleplotsurveycards781.2Copyofsampleplotsurveycards782.1Explanationoftwo-stagecontinuousinventorychangeofsampleplot13.1Analysisreportonlandtypechangeincontinuousinventoryofsampleplot13.2Statisticaltableoflandtypechangeincontinuousinventoryofsampleplot14.1Finalaccountingofexpenditure1CD5.1Thefirstandseconddatabaseinput15.3Track16.1Sampleplotphotos4606.2Otherphotos286.3wordversiononexplanationoftwo-stagecontinuousinven-torychangeofsampleplot17.1wordversiononcontinuousinventoryreport17.2wordversiononcontinuousinventorytechnologyreport17.3wordversiononcontinuousinventoryqualityinspectionre-port18.1Listofstaff19.1wordversiononlandtypechangeanalysisreport19.2excelversiononlandtypechangestatistics19.3excelversiononfinalaccountingofexpenditure1
6 Review conclusions
The following conclusions of forest resources in Zigui can be drawn by the research on 73 plots and 5 vegetation plots: forest area is increasing, part of agricultural land becomes new artificial forest land, and artificial afforestation area is increasing; forest growing stock is increasing, and in addition to growth of sample trees, there are many ingrowth woods; the adjustment of forest category structure is constantly improved, and the ecological economic forest has formed a scale; the forest quality has been improving, and the original pure forests are changing into mixed forests including mixed broadleaf-conifer forest and coniferous forest; the stand structure is optimized continuously, and the original single-storied forest is changing into multi-storied forest; biodiversity has initially appeared, and there are more than 10 kinds of plants in 4 m×4 m vegetation sample plot.
[1] MENG CY. A brief talk on forest continuous inventory[J]. Forestry Science and Technology Information,2010, 42(1): 15.(in Chinese).
[2] HU WD. Application of GPS in forest resource continuous inventory[J]. Popular Science & Technology, 2011(5): 88-89. (in Chinese).
[3] LI ZH. Application of GPS technology in forest resource continuous inventory[J]. Inner Mongolia Forestry Investigation and Design,2009(4):62-64, 116. (in Chinese).
[4] WANG XK. The improvement of fixed sample in forest resource continuous inventory[J].Forestry of Xinjiang,2007(1): 11-12,13. (in Chinese).
[5] ZHOU J. The state continuous forest resources inventory system of Liaoning province and its application[J]. Jilin Forestry Science and Technology, 2010(4): 56-57. (in Chinese).
[6] ZHAO YM. Study on improvement of the national forest inventory system in Henan[J]. Journal of Henan Agricultural University,2005, 39(4): 402-405. (in Chinese).
November 8, 2015 Accepted: December 13, 2015
*Corresponding author. E-mail: gzm58@163.com
杂志排行
Asian Agricultural Research的其它文章
- Research on Influence Factors of Pig Farmers’ Ecological Farming Behavior:Based on the TPB and SEM
- Biodiversity Risk and Opportunity Assessment in BAT Cooperative Tobacco-growing Areas
- Effect of Different Sowing Dates in South Henan’s Rice-growing Areas on the Growth and Yield of Ratoon Rice
- Quality Information Management and Application of AWS
- Study on Redevelopment of Kunming West Mountain Forest Park in the View of Experience Economy
- Recommendations for Construction and Management of Ecological Public Welfare Forest in Hainan Province
