Quality Information Management and Application of AWS
2016-01-11,,,,
, , , ,
National Meteorological Information Center, Beijing 100081, China
QualityInformationManagementandApplicationofAWS
YanWANG*,FengGAO,ChaoSUN,YuYU,YimingLIU
National Meteorological Information Center, Beijing 100081, China
This paper has designed a unified storage model of Automatic Weather Station Quality Information Inquiries and Feedback (AWSQIF), and has developed an AWSQIF automatic management system, which implements the storage of AWSQIF automatically in national quality information two-way feedback process. Based on the unified storage, AWSQIF data have important application in real-time data management, data quality assessment and quality control effect analysis. The results show that the data quality has been improved significantly, and the data assessment has achieved online operating. In addition, AWSQIF can assist the improvement of the quality control effect.
AWS (Automatic Weather Stations), Quality control, query, Feedback, Quality management
1 Introduction
Since 2009, China has gradually carried out the studies on the real-time quality control methods of basic observation element data of AWS (Automatic Weather Stations)[1-3], to achieve business transformation. By assessing the hourly observation data and quality control results of national ground automatic stations, it is found that there is a high error rate in automatic station data, leading to decreased availability of information. Taking the second quarter of 2012 for example, the average error rate of 2411 national automatic stations was 0.09%, and the average error rate of 29399 regional automatic stations was 0.77%, that is, the data of 2 national stations and 226 regional stations per hour were not available due to quality problems. In order to grasp the accuracy of quality control results and further improve the quality control algorithms, the query and feedback regarding error data are conducted after the service transformation of quality control system. Since some feedback files are compiled by human, there are many abnormal conditions such as messy code and formatting disorder, making it difficult to effectively assess, manage and apply the feedback data. Meanwhile, the feedback data are not applied in the revised working of real-time observational data and quality information, so forecasting and other real-time service users can not effectively use the data, and can not confirm credibility of some suspicious precipitation, thus affecting the forecasting effect. To improve this situation, the National Meteorological Information Center launched automated management and application of QC (Quality Control ) information query and feedback of national automatic stations to further standardize the query and feedback file format of error data, and established national QC information management system; cooperated with Jiangxi, Hubei and Guangxi provincial information center to establish a national and provincial two-way feedback process of national automatic station QC information, and applied it in 31 provinces to achieve the fully automated query and feedback of quality information. This article focuses on the design and implementation of QC information management system.
2 Overview of national and provincial two-way feedback process
After the quality control over the national AWS observation data by the national real-time data quality control system, the erroneous data, as the original data, are entered into QC information management system, and form query documents to be issued to the province. After the quality control over provincial observational data[4-5], the data are blended with the national query information received, and by the immediate alarm function of provincial quality control software, the erroneous data information is released to the provincial data processing personnel and weather stations[6]. After confirmation of the erroneous data, and the province forms feedback files and uploads them to national QC information management system which integrates and stores the feedback information and original query information, and revises the quality control results of real-time automatic station observational data. The overall process is shown in Fig. 1. National and provincial two-way feedback process involves many links such as quality control, quality query and feedback, communication and transmission, which are interrelated. The consistency of data is ensured after passing QC information management system at the national level and passing quality control information fusion subsystem at the provincial level.
3 System design and information flow
3.1SystemstructuredesignThe overall system is designed as three-layered structure (data interface, data processing and data storage), as shown in Fig. 2. With the national storage and retrieval system MDSS real-time database as data environment, the data are stored and the quality management table AWSR is designed to store the query and feedback information of erroneous data. As the data interface for various links in national and provincial two-way feedback process, it determines the format convention of erroneous data, query files and feedback files. Data processing consists of three modules, namely national QC erroneous data storage, national query generation and feedback data storage. (i) National QC erroneous data storage. The erroneous data from the national quality control system are stored as the data source of QC information management system. The storage recording data include station number, observation elements, observation time, observational value of elements, quality control results and other query information, in conjunction with data state, storage time and other process information. (ii) National query generation. The file query is conducted based on unreleased records in AWSR table. The query files are generated in the light of province, and the files are placed in the distribution directory of communication system which transfers the query files to the provincial level. In the process of generating query files, the data state is modified in order to avoid interference from other processes. (iii) Feedback data storage. The feedback data are generated from the content of feedback files one by one and input into database in real time. The query information contained in feedback data is used for positioning the corresponding query record that already exists in AWSR table, and updating the feedback information, feedback time and data state. For the query record that does not exist in the table, it is directly inserted. QC information management is to conduct unified storage and comprehensive application of query and feedback data from multiple sources. Based on such unified storage, we can revise and update the real-time observation data and quality information, and analyze the real-time feedback and quality control results. The confirmation results of feedback data is of great significance to quality information of automatic station observation data. After completing the storage work of AWSR table, the confirmation results of feedback data are directly applied to automatic station hourly data sheet, to revise the quality control code of corresponding observational data. In terms of scheduling configuration, the state-level quality control system takes the multiple quality control processing mode based on scheduling strategy[7], and the quality control results will change over time, so the QC information management system needs to reserve the final erroneous data and store them into database after processing all the results performed within one hour by quality control system. There is successive relationship between erroneous data storage and query generation, and erroneous data storage can be only performed after the end of the current hour, so the two functional modules are combined and started at the fifth minute of next hour after the current hour quality control is completed through the regular scheduling. The feedback data storage is not limited, and it is regarded as the permanent system process to carry out real-time processing of feedback files.
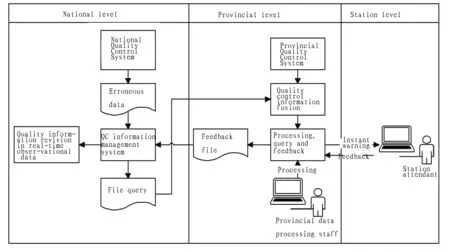
Fig.1 National and provincial two-way feedback process
3.2"Asynchronous"informationexchangemechanismThe national automatic station QC management system consists of three separate sub-processes: national QC erroneous data storage; national query generation; feedback data storage. With AWSR table as a core, the "asynchronous" information exchange mechanism is used and the data state is marked to achieve convergence and interaction of three sub-processes. After the completion of storage, query and feedback processes, the corresponding data state is identified as "having not issued", "having issued" and "having fed back", and "having fed back" is the final data state. In the real situation, storage always occurs prior to query, while feedback generally follows query, but may also occur before and after storage. (i) Storage-query-feedback. It is one of the most common business processes. After the national quality control, the erroneous data are stored and the query data files are formed to be issued to the province by the communication system. The data state is "having issued". After confirming data quality, the provincial data processing personnel perform the feedback, and data state changes to "having fed back". It is often based on the last feedback if the feedback occurs many times. (ii) Storage-feedback. The erroneous data from provincial quality control system would also produce query information, and the QC information management system receives the provincial query and feedback data at the same time. When the erroneous data are stored and have not been issued, the provincial feedback information has been put in storage, the data state changes to "having fed back", and the query sub-process will no longer be executed in accordance with such data state. (iii) Feedback-storage. The national and provincial quality control results are not exactly the same, and when the provincial query and feedback data are stored, there may be no corresponding national query data to be stored. The data state is "having fed back". In order to distinguish query information sources, the auxiliary mark of "query sponsor" is added. If the national erroneous data are stored after the provincial query and feedback data, it will not change the data state of "having fed back", feedback results and query sponsor information, but only update the storage time of national erroneous data.
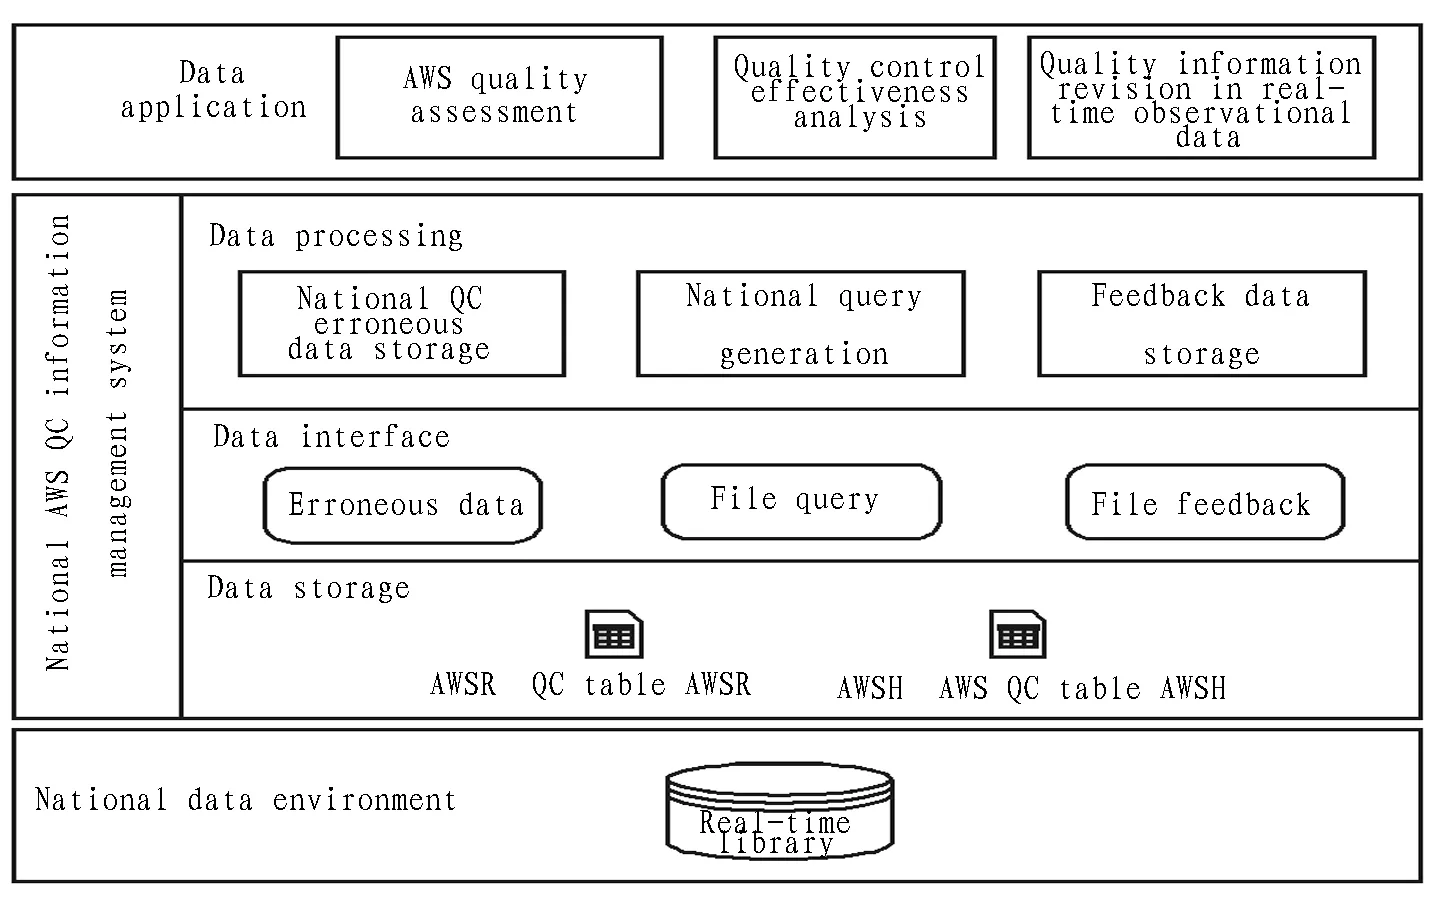
Fig.2 Structure of QC information management system
3.3DatabasedesignThe erroneous data contain the basic query information, namely station number, observation elements, observation time, observation value and quality information. For feedback information, it includes the confirmation of data quality, cause of problems and note information. Seeing query and feedback as entity, a piece of query data is allowed to be fed back many times, but it is based on the last piece of feedback data, that is, a piece of query data corresponds to a piece of feedback data at most. For a piece of feedback data, there must be a piece of query data. Therefore, there is one-to-one relationship between query entity set and feedback entity set. According to the simpleness principle of relational data model design, the two types of entity set are designed as a unified relational data model AWSR, as shown in Table 1. In order to ensure the correct interaction of storage, query and feedback sub-processes and effective management of storage data, the flow information fields are added, including data state, query sponsor, query storage time, and feedback time.
4 System construction and implementation
4.1DeploymentoperationQC information management system was deployed and put into operation nationwide in July 2012. In the system, the feedback data can revise the real-time data quality and modify quality control identification of observational data based on confirmation results in real time as: correct (0), erroneous (2) or can not be confirmed (1). According to the hourly observational data and quality control assessment results of national automatic stations, it is found that the average error rate of national stations was 0.002% and the average error rate of regional stations was 0.07% from July to November 2012. If the quality feedback data is not applied to revision of real-time data quality, the average error rate of national stations is 0.009% within this period, and the average error rate of regional stations is 0.10%. Fig. 3 shows the change in error rate before and after quality information revision of national stations and regional stations from July to November, and we can find that the error rate of automatic stations after being revised each month is significantly lower than before being revised, which means that the revision and application of QC information management system has improved the availability of data. By establishing the query and feedback two-way process, the national or provincial stations can grasp the data quality in a timely manner, and timely solve the data problem caused by various anomalies (such as equipment failure); the data error rate of automatic stations during July to November fell sharply compared with April to June, and the data quality has improved significantly.
Table1StoragestructuredesignofAWSR
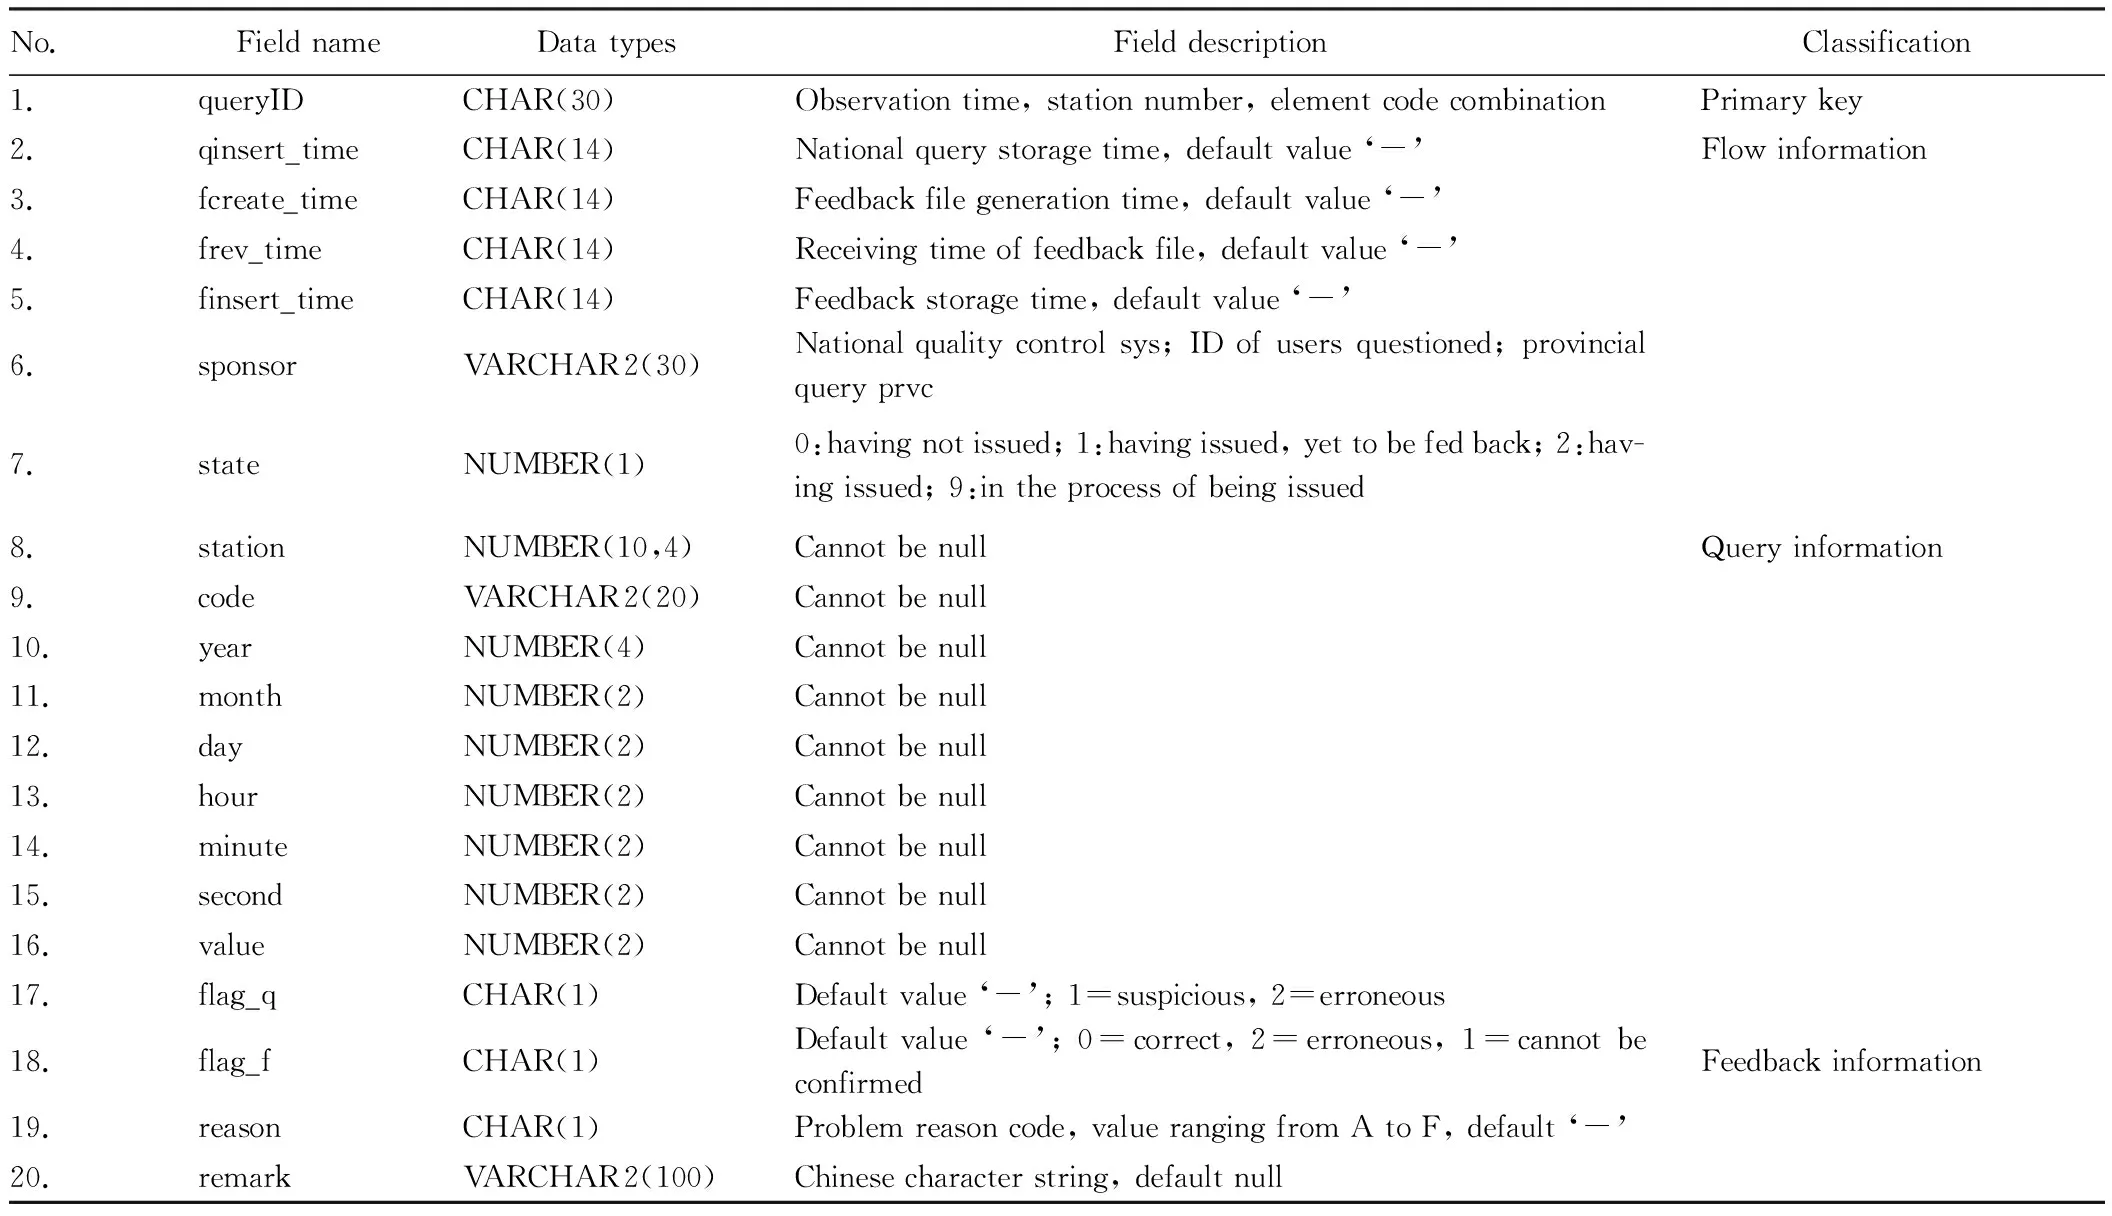
No.FieldnameDatatypesFielddescriptionClassification1.queryIDCHAR(30)Observationtime,stationnumber,elementcodecombinationPrimarykey2.qinsert_timeCHAR(14)Nationalquerystoragetime,defaultvalue‘-’Flowinformation3.fcreate_timeCHAR(14)Feedbackfilegenerationtime,defaultvalue‘-’4.frev_timeCHAR(14)Receivingtimeoffeedbackfile,defaultvalue‘-’5.finsert_timeCHAR(14)Feedbackstoragetime,defaultvalue‘-’6.sponsorVARCHAR2(30)Nationalqualitycontrolsys;IDofusersquestioned;provincialqueryprvc7.stateNUMBER(1)0:havingnotissued;1:havingissued,yettobefedback;2:hav-ingissued;9:intheprocessofbeingissued8.stationNUMBER(10,4)CannotbenullQueryinformation9.codeVARCHAR2(20)Cannotbenull10.yearNUMBER(4)Cannotbenull11.monthNUMBER(2)Cannotbenull12.dayNUMBER(2)Cannotbenull13.hourNUMBER(2)Cannotbenull14.minuteNUMBER(2)Cannotbenull15.secondNUMBER(2)Cannotbenull16.valueNUMBER(2)Cannotbenull17.flag_qCHAR(1)Defaultvalue‘-’;1=suspicious,2=erroneous18.flag_fCHAR(1)Defaultvalue‘-’;0=correct,2=erroneous,1=cannotbeconfirmedFeedbackinformation19.reasonCHAR(1)Problemreasoncode,valuerangingfromAtoF,default‘-’20.remarkVARCHAR2(100)Chinesecharacterstring,defaultnull
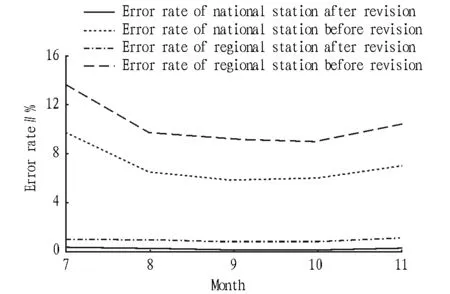
Fig.3 The average error rate comparison of national automatic stations before and after quality revision during July to November 2012
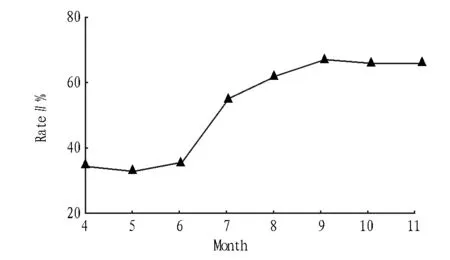
Fig.4 The average feedback rate of erroneous data of national AWS from April to November in 2012
4.2StatisticalanalysisoffeedbackrateThe national automatic station quality assessment business is one of the main applications of AWS quality information, and the specific assessment items involve feedback rate, amount of correct and incorrect suspect data feedback, amount of correct and incorrect erroneous data feedback, etc. The feedback rate is the ratio of feedback amount of data to query amount of data, and feedback amount of erroneous data is counted by the element quality mark (flag_q) and confirmation results (flag_f). AWSR table records the query feedback data content and process information in detail, providing the statistical basis for the feedback rate calculation. All counting indicators can be easily converted to SQL statements to directly complete counting. Given the convenience and operability of this statistical method, we can make automated transformation about it to achieve statistical functions in real time or at any time. Fig. 4 shows the average erroneous data feedback rate of national automatic stations from April to November 2012, the feedback rate from April to June was the statistical value obtained by analyzing and counting the old feedback files, and the feedback rate after July 2012 was the statistical value by statistical analysis of AWSR table. Due to different making methods of old feedback files in various provinces, there are some non-standard file formats and messy codes, leading to inadequate statistical analysis. Since the system business was started in July, the effective recording rate of feedback files has reached 100%, and from the statistical results of feedback rate, it can be found that the average feedback rate during July to November is 29.08% higher than during April to June, with significant effect.
4.3TheapplicationeffectoffeedbackinformationThe quality information is of important application value to the analysis of quality control effect. First of all, only when the erroneous or suspicious data are proved to be correct or wrong can it be effective feedback, otherwise it will be ineffective feedback. According to the statistics, during the flood season from July to September in 2012, it was judged that the amount of erroneous or suspicious basic elements (such as temperature and hourly precipitation) was 167257 by quality control, with effective feedback amount of 110424 and effective feedback rate of 66%. The effective feedback amount and effective feedback rate of various elements are shown in Table 2, and it can be found that the effective feedback rate of various elements is more than 50%, and we can use the effective feedback information to further analyze the quality control effect. Table 3 shows the QC effect indicators of the basic elements from July to September in 2012, including misjudgment rate of erroneous data, accuracy rate of misjudged data, accuracy rate of suspicious data and error rate of suspicious data. For any kind of element, the sum of the above four indicators is 1. The effective feedback rate of erroneous data is the sum of misjudgment rate of erroneous data and accuracy rate of misjudged data; the effective feedback rate of suspicious data is the sum of accuracy rate of suspicious data and error rate of suspicious data. According to statistics, the misjudgment rate of erroneous temperature and relative humidity data is low, and the accuracy rate is high, indicating that the quality control algorithm of the two elements plays a significant role in judging the erroneous data. The difference between the accuracy rate and error rate of suspicious data is only about 10%, without the problem of too high accuracy rate or error rate, indicating that the quality control algorithm also plays a significant role in judging the suspicious data. For hourly precipitation, 2-minute wind direction and 2-minute average wind speed, the effective feedback rate of erroneous data is significantly lower than that of suspicious data, while it is opposite for the air pressure element of the station. For the first three elements, the feedback of suspicious data has greater reference value, and it is found that the accuracy rate is 20% higher than the error rate. To further clarify the reasons for high accuracy rate of suspicious data, we can use the reason and remark in feedback data for auxiliary analysis. Taking precipitation for example, in 33505 pieces of precipitation query data, 23746 are fed back, and 2122 pieces of feedback data contain remark information. Based on the analysis of remark information, it is found that 60% of remark content suggests that due to heavy precipitation, thunderstorms and strong convection weather in local areas, the actual precipitation is correct, and the data containing such remarks indicate that the suspicious data feedback is correct. For example, in Shaanxi Huayin (57055), the precipitation was 55.9mm at 9:00 on July 4, 2012; it is judged to be suspicious by quality control system; the remark information is "storm". If we effectively judge local precipitation based on weather radar and other sources of information, the suspicious precipitation rate will be significantly reduced, thereby improving the usability of local heavy precipitation data. Therefore, the information of feedback data helps to find typical weather or problems and constantly improve quality control effect.
Table2QCfeedbackofbasicelementsfromJulytoSeptemberin2012
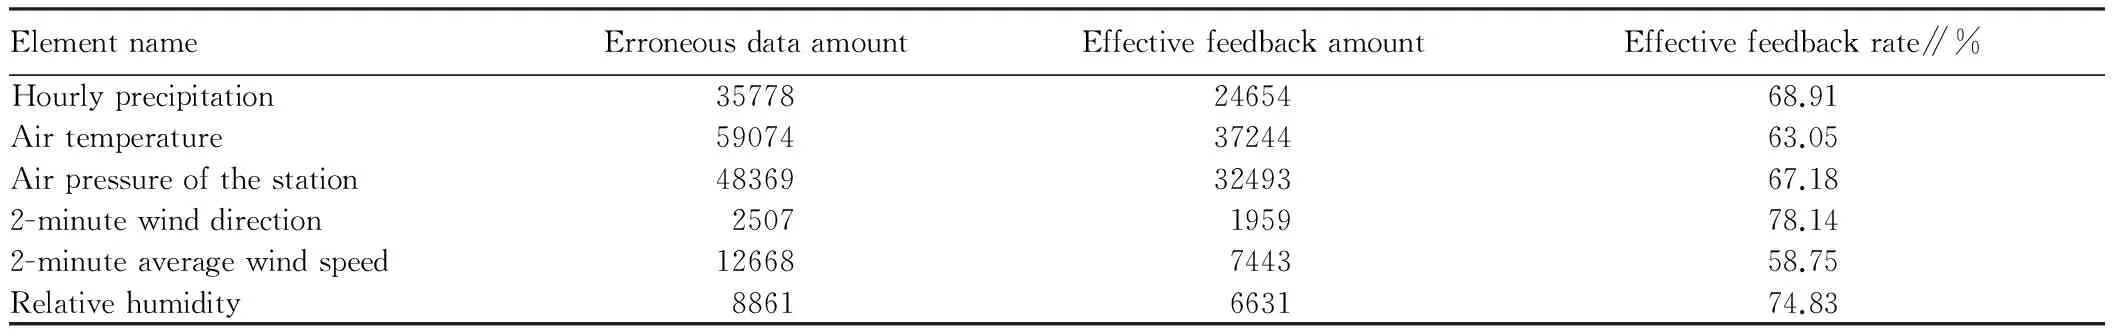
ElementnameErroneousdataamountEffectivefeedbackamountEffectivefeedbackrate∥%Hourlyprecipitation357782465468.91Airtemperature590743724463.05Airpressureofthestation483693249367.182-minutewinddirection2507195978.142-minuteaveragewindspeed12668744358.75Relativehumidity8861663174.83
Table3QCeffectindicatorsofthebasicelementsfromJulytoSeptemberin2012
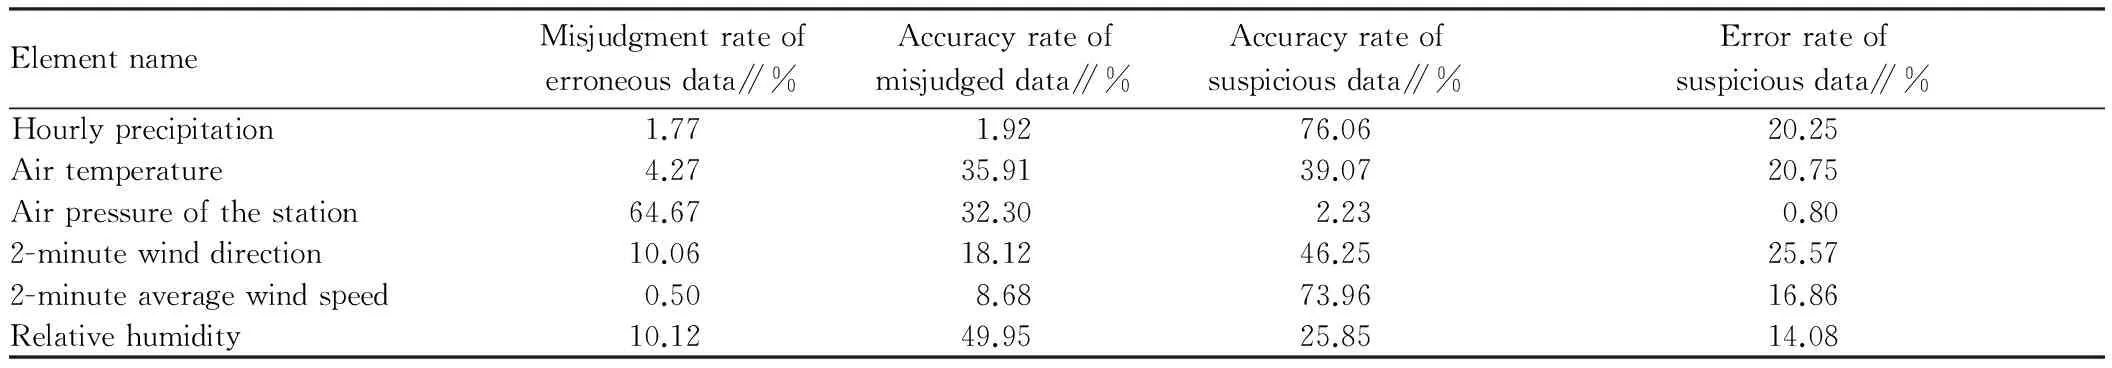
ElementnameMisjudgmentrateoferroneousdata∥%Accuracyrateofmisjudgeddata∥%Accuracyrateofsuspiciousdata∥%Errorrateofsuspiciousdata∥%Hourlyprecipitation1.771.9276.0620.25Airtemperature4.2735.9139.0720.75Airpressureofthestation64.6732.302.230.802-minutewinddirection10.0618.1246.2525.572-minuteaveragewindspeed0.508.6873.9616.86Relativehumidity10.1249.9525.8514.08
5 Conclusions
National AWS QC information management system is a state-level core system having a national and provincial two-way feedback process. With national real-time database as storage environment, it designs unified storage table structure, and achieves "asynchronous" informa-tion exchange of storage, query and feedback based on the data state information in table to ensure data consistency. The real-time revision of feedback information on real-time data quality has significantly improved the availability of observational data. After the establishment of national and provincial two-way feedback process, the feedback rate growth of erroneous data query is very obvious. At the same time, through statistical and visual analysis of quality control effect indicators, combined with feedback data content, the quality control effect can be improved. Since the data interface design is standardized and expandable, QC information management system has been applied in real-time integrated business, to carry out the total factor quality information management of ground data. The next step will be to consider the integrated quality information management of various types of meteorological data.
[1] REN ZH, ZHAO P, ZHANG Q,etal. Quality control procedures for hourly precipitation data from automatic weather stations in China[J]. Meteorological Monthly, 2010, 36 (7): 123-132. (in Chinese).
[2] ZHAO YF, REN ZH, ZHANG Q. Quality control procedures for hourly relative humidity data from national automatic weather stations[J].Scientia Meteorologica Sinica,2011,31(6):687-693. (in Chinese).
[3] JU XH, REN ZH, ZHANG Q. Research on quality control technology of automatic hourly pressure[J].Journal of Anhui Agricultural Sciences,2010,38 (27):15130-15133. (in Chinese).
[4] DOU YW, QU YG, TAO SW,etal. The application of quality control procedures for real-time data from automatic weather stations[J]. Meteorological Monthly,2008,34(8):77-81. (in Chinese).
[5] WANG HJ, YANG ZB, YANG DC,etal. The method and application of automatic quality control for real time data from automatic weather stations[J]. Meteorological Monthly, 2007, 33(10): 102-109. (in Chinese).
[6] LI ZP, ZHANG W, HUANG SP,etal. Design and implementation of the software for real-time quality control over automatic weather station observation data[J]. Meteorological Monthly, 2012,38(3):371-376. (in Chinese).
[7] LIU YM, ZHOU ZJ, YUAN F,etal. ARQBS starting strategy and its relationship with bomputing resource bost[J]. Quarterly Journal of Applied Meteorology, 2014, 25(4):505-512. (in Chinese).
November 18, 2015 Accepted: December 28, 2015
Supported by Business Construction Project of China Meteorological Administration in 2011 and Key Project of Key Meteorological Technology Integration and Application of China Meteorological Administration (CMAGJ2013Z01).
*Corresponding author. E-mail: wangyan8@cma.gov.cn
杂志排行

Asian Agricultural Research的其它文章
- A Study of the Sustainable Development of Rural Sports in Gannan
- Composition and Development Prospects of Scented Rice
- A Content Analysis of the Image Repair Discourses of OSI Group in China’s Food-safety Scandal
- Breeding and Cultivation Technique of Ditian 6
- Study on Obstacles to Continuous Cropping of Vegetables and Soil Remediation Technology
- Development Path for Rural Tourism of Henan Province from the Perspective of Innovation