Analysis of InSAR Coherence Loss Caused by Soil Moisture Variation
2015-12-14YinQiangLiYangHuangPingpingLinYunHongWen
Yin QiangLi YangHuang Ping-pingLin YunHong Wen*
①(University of Chinese Academy of Sciences,Beijing 100049,China)
②(National Key Laboratory of Science and Technology on Microwave Imaging,Institute of Electronics,Chinese Academy of Sciences,Beijing 100190,China)
③(Inner Mongolia University of Technology,Hohhot 010051,China)
Analysis of InSAR Coherence Loss Caused by Soil Moisture Variation
Yin Qiang①②Li Yang①②Huang Ping-ping③Lin Yun②Hong Wen*②
①(University of Chinese Academy of Sciences,Beijing 100049,China)
②(National Key Laboratory of Science and Technology on Microwave Imaging,Institute of Electronics,Chinese Academy of Sciences,Beijing 100190,China)
③(Inner Mongolia University of Technology,Hohhot 010051,China)
Interferometric Synthetic Aperture Radar (InSAR) coherence is important not only in determining measurement quality but also for extracting thematic information about objects on the ground in combination with backscattering coefficient. The decorrelation of repeat-pass InSAR caused by soil moisture change has
little attention in comparison with other sources of decorrelation. In this paper,we use ENVISAT ASAR data and laboratory experiments to analyze the repeat-pass InSAR coherence loss results due to soil moisture change. C-band ASAR data has high coherence over bare soil and grassland areas,which indicates that these two types of land cover are good choices for the analysis of InSAR coherence loss due to soil moisture change. In addition,spaceborne SAR with short revisit capability,has great potential for this specific application,even for agricultural fields. We conducted further analysis of the soil-sample laboratory data acquired in an anechoic chamber because of its controllable environment and the ability to exclude other sources of decorrelation. We found that the lower frequency range,2–2.5 GHz,has the highest coherence and is the most insensitive to the initial soil moisture value. This indicates that the S band is more advantageous than the C band when using InSAR coherence to detect soil moisture change. This is true at least with respect to the S band's high coherence level and insensitivity to initial soil moisture values.
Repeat pass; Radar interferometry; Coherence; Soil moisture
CLC index: TN959
Reference format: Yin Qiang,Li Yang,Huang Ping-ping,et al.. Analysis of InSAR Coherence Loss Caused by Soil Moisture Variation[J]. Journal of Radars,2015,4(6): 689–697. DOI: 10.12000/JR15075.
引用格式:尹嫱,李洋,黄平平,等. 土壤湿度变化引起的干涉SAR相干性损失分析[J]. 雷达学报,2015,4(6): 689–697. DOI: 10.12000/JR15075.
1 Introduction
Being able to accurately quantifying soil moisture is of great importance to a wide range of disciplines and practical applications which has led to it being recognised as an Essential Climate Variable (ECV) by the Global Climate Observing System (GCOS). It exerts a strong control on the soil physical properties affecting vegetation growth,erosion,runoff,and inltration,as well as on the soil biogeochemistry,influencing microbial activity,and carbon dioxide (CO2) production. All of these processes impact on social and economic activities[1]. Several approaches for soil moisture retrieval have been developed over the past three decades using microwave remote sensing technology,especially Synthetic Aperture Radar (SAR) due to its high spatial resolution. However,the majority of soil moisture retrieval studies using SAR data utilize only the amplitude part of the received echo. The use of the phase component and the potential of interferometric SAR to obtain soil moisture information remain largely unrealized.
The repeat pass InSAR technique has been successfully applied in topography mapping and terrain motion monitoring by means of Differential InSAR (DInSAR) for many years. There are several factors could influence the observed interferometric coherence. It is affected by the system spatial decorrelation,the additive noise,and the scene decorrelation that takes place between the two acquisitions. Among the decorrelation source of the scene,volume scattering and terrain deformation are always taken into considerations. However,soil moisture change,which takes place within the time interval of two acquisitions,has not yet been thoroughly studied. The decorrelation caused by temporal changes of soil moisture,on one hand,is a serious source of error for deformation products which should be removed correctly,but on the other hand,provides a significant approach to estimate soil moisture change information.
Previous studies investigating the relationship between InSAR complex coherence and the changes of soil moisture content have found promising results,both on amplitude and phase. It is found that the changes in soil moisture decrease the coherence amplitude,and the phase is highly related to the soil moisture changes[2–8]. However,the exact relationship between complex coherence and soil moisture change haven't been revealed for applications,although a few models have been just proposed for study[9,10]. Furthermore,there are sizeable differences between the different studies with regards to the wavelength,incidence angle,soil type,vegetation cover etc.,and these render comparisons and model assessments are difficult[11]. In addition,the influences of system parameters on the soil moisture change detection by use of interferometric information haven't been investigated.
In this study,we focus on the coherence amplitude analysis with different soil moisture values in spaceborne ASAR data and laboratory data experiments,and especially the frequency influence in laboratory measurement. This is because that low coherence amplitude cannot correctly show the extent of the variations in soil water content through the relation between them,but also severely limit the quality of phase information which links to the soil moisture variations. Interferometric coherence is briefly presented in Section 2,followed by two spaceborne data experiments given as examples of low coherence limitation and possible application in Section 3. Then in Section 4,the experiment implemented in anechoic chamber is described. Finally,after the introduction to data processing steps,the coherence loss caused by temporal soil moisture changes isshown and the influence of frequency is also discussed.
2 Interferometric Coherence
The interferometric coherence is the key product of SAR interferometry,which is the complex correlation of both amplitude and phase information from two interferometric signals. The coherence amplitude is an important parameter to measure InSAR data quality because the area with high coherence could usually obtain qualified interferometric measurements. The coherence of two co-registered complex SAR images I1and I2can be defined as:

The brackets is the estimated ensemble average and the * denotes the complex conjugate. The observed coherence amplitude–which ranges between 0 and 1–is a function of systemic spatial decorrelation,the additive noise,and the scene decorrelation that takes place between the two acquisitions.
3 ASAR Data Experiment
The test sites of AgriSAR 2006 campaign is selected as the study area,because of it containing ground truth measurement such as weather,land type,precipitation,soil and vegetable parameter values etc.. The main coverage of the study area is shown in the map of Fig. 1. In order to compare the data processing results with ground measurements,we checked for all the ASAR APS mode data of exactly the same test site and the whole time span of AgriSAR campaign,i.e. Gormin farmland in Germany from April to August of 2006. Because that only the data of same track can be used to generate interferograms,the available data in archive is screened.
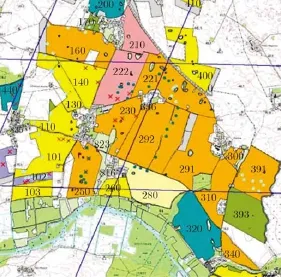
Fig. 1 Map of study area
SRTM 3 Version 4 DEM data is downloaded from the official website,as well as the Doris VOR orbit data of Envisat. It is chosen properly according to the time moments when ASAR data is acquired.
SARscape module in ENVI software is used for interferometric processing of time series Envisat ASAR data. The input of this processing chain is two SAR SLC (Single Look Complex) data of the same track,two orbit data of this interferometry pair,and the DEM data covering the whole SAR data area. The outputs are geocoded images of interferometric coherence and the differential phase.
When examining the coherence level of the time series ASAR data,we choose the data of track No. 444 first because there are 5 scenes within it. Unfortunately the coherence results show that only the interferometric coherence map between the two scenes obtained on 18/05/2006 and 22/06 2006 includes two fields with relatively high coherence higher than 0.5,which is shown in Fig. 2 (marked as 210&222 of maize crop with pink color in Fig. 1). From the in situ measurements,this maize area is basically bare soil between this time periods. Specifically,Fig. 3 shows two photographs on the dates of 06/06 and 21/06. It can be seen that a few centimeters of maize crops grew out of the soil surface on 06/06 and 20 centimeters high crops exist on 21/06. It implicates that the microwave could penetrate the crop vegetation and the volume decorrelation is not significant due to the relative high coherence.
In fact,all possible combinations have been tried to generate interferograms from these 5 images within this No. 444 track. All others show noise-like effects in the agricultural areas. The very similar phenomena happen in the data processing results of other tracks.
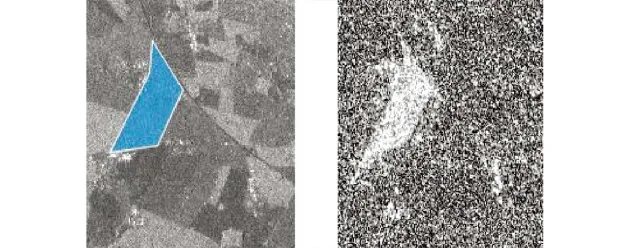
Fig. 2 Quick look and coherence image (18/05/2006–22/06 2006)
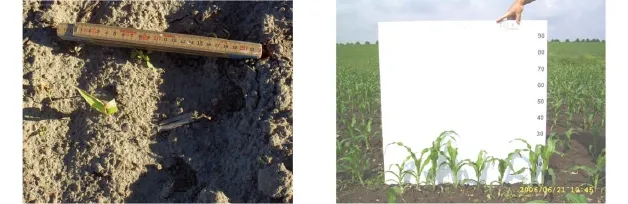
Fig. 3 Photographs of field 222 on 06/06 and 21/06
We can easily understand that it's difficult to get high coherence from two scenes with the time interval of 70 days or even longer for agricultural areas because of the activity of vegetation. But why the coherence is low in other pairs with 35 days apart for this maize area? We check the in situ measurements again. It is found out that between 13/04/2006 and 18/05/2006 there is some plough activities on this maize field. From July the maize crop grew up very quickly and hence the volume decorrelation is severe since then. The reason why high coherence cannot be obtained in other fields such as sugar beet,wheat,and barley etc. is that these crops all grew up very earlier,even since April.
Furthermore,we found the soil moisture in situ data of the concerned field on 17/05/2006 and 21/06/2006,respectively one day before the SAR observations,as listed in Tab. 1 with red numbers. The soil moisture changes a lot during the whole campaign,but for these two time moments,the values from different points within the field are all very close. This fact is consistent with the SAR observation results that the coherence between these two acquisitions is much higher. As is concluded in Ref. [4],temporal decorrelation here in this certain field is not severe,despite of a 35 day long time interval. Conversely,the soil moisture change is probably the main source of decorrelation.
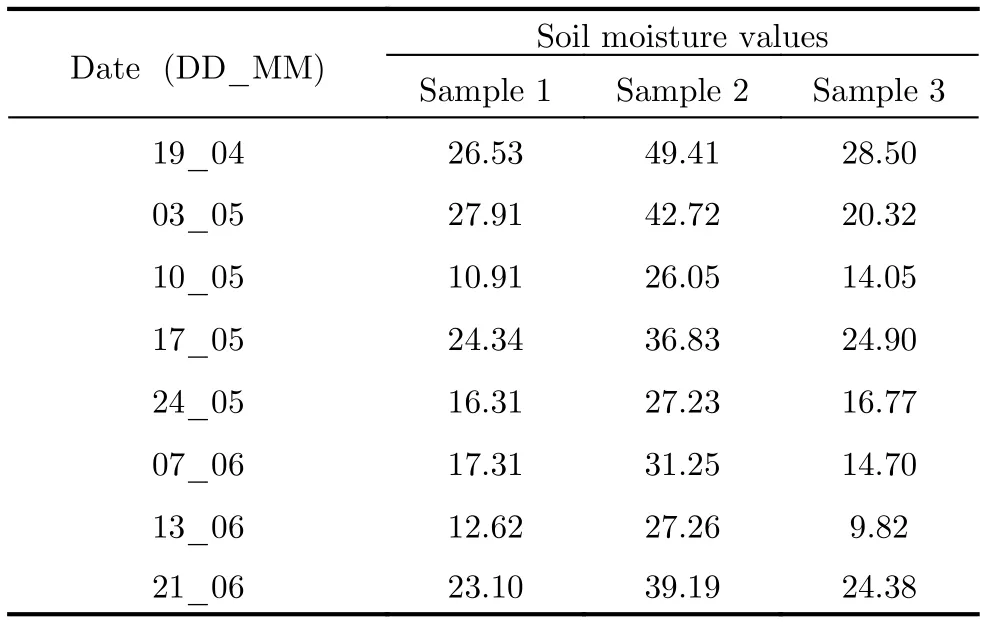
Tab. 1 Soil moisture data measured from 0-5 cm soil of field 222 (unit: volume water content in %)
Compared to this maize field,another experiment reveals the other possible appropriate application for this soil moisture change influence analysis on repeat pass interferometric coherence. Fig. 4 shows the interferometric processing results of a grass field 393 (displayed with green color in Fig. 1) between 19/06/2006 and 24/07/2006. It is quite interesting since this field is covered with grass vegetation high to 35~40 centimeters for the two acquisition time moments. That means the C-band microwave signal can penetrate the grass well and return to the antenna after scattering from soil surface. Hence besides the bare soil,grassland could be another proper land cover type for soil moisture information analysis from InSAR measurements.
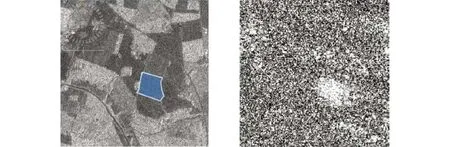
Fig. 4 Quick look and coherence image (19/06/2006–24/07/2006)
The observed coherence losses over bare soil and grassland fields depend not only on the change in soil moisture but possibly on other various contributors to the interferometric coherence. In general the main influences come from the terrain displacement and atmospheric delays. Over grassland areas,the impact of the grass growth,and wind speed must also be taken into account. Since the time span of concerned soil moisture change is from a couple of days to tens of days,which is also possible for nowadays spaceborne SAR revisit capability,the slow displacements of terrain surface usually on the level of several centimeters per year could be reasonably neglected. The phase distortions due to atmospheric effects can reduce the accuracy of the generated coherence maps. It is generally considered that using scenes acquired under anti-cyclonic conditions and/or at night can help reduce atmospheric artefacts more than daytime acquisitions,due to the relative inactivity of vegetation and a more stable atmosphere at night. Meantime,the spatial extent of the study fields considered in soil moisture applications is usually of the order of several hundred meters,while the variation in coherence due to atmospheric heterogeneities is typically of the order of several kilometers. According to this phenomenon,the use of persistent scatter technique in neighbor area,where scatterers not affected by soil moisture such as rock or buildings are used,could show the atmosphere influence on coherence loss as a good reference.
Since the main limitation of the spaceborne differential interferometric technique for soil moisture determination was the temporal decorrelation of the signal,especially atmosphere and vegetation effects,as concluded in Ref. [1],the experiment in anechoic chamber for bare soil is implemented and analyzed in the following section.
4 Laboratory Experiment
4.1 Implementation
The experiment in laboratory was designed and implemented in the anechoic chamber of Science and Technology on Electromagnetic Scattering Laboratory in China. The chamber provides a highly controlled radar measurement environment. The soil sample is contained inside of a cylinder container of 1 m diameter above the turntable base. This container is made of polystyrene foam. Its dielectric constant is very small,close to 1,hence its influence on scattering can be neglected. Inside of the container,the depth of soil sample is 13 cm,with slightly roughness onthe surface. The photo of soil sample on its measured position is given in Fig. 5.
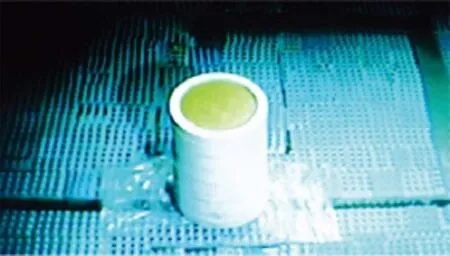
Fig. 5 Photo of soil sample in its measurement position
Radar measurement was carried out in step frequency mode from 2–6 GHz at 15 MHz interval,with the distance of 8.722 meters between antenna and the centre of soil surface. In order to increase the SNR of the scattered wave by soil,the measurement was taken for each azimuth angle with interval of 0.1 degree for the whole range of 360 degrees. The incidence angle is set to be 30 degree during the whole experiment.
To assess the phase stability of the measurement system,a metal ball of 50 cm diameter was measured twice before the soil sample,at time interval of 30 minutes. The soil of different water content was observed for four times. Among these four time measurements,water was added into the soil sample gradually,so the soil moisture increased accordingly. There were 20 minutes left between each watering activity and microwave measurement,so as to assure the stable state of water in soil. As to the ground truth data,TDR 300 was used for the measurement of soil volumetric water content. Each time five sample values of different positions in container were recorded and averaged for further analysis.
4.2 Data processing
The measurement data of four acquisitions is firstly processed for circular SAR imaging using 2–2.5 GHz data. Then the coherence between images is computed respectively,according to Eq. (1). The same processing steps are implemented to 2.5–3 GHz,3–3.5 GHz,3.5–4 GHz etc.,so as to analyze the frequency influences. Fig. 6 is the imaging result of 2–2.5 GHz data with soil moisture value of 5.9%. In the metal ball experiment,the phase difference between two measurements is no larger than 0.1 degree,which implicates the system phase is quite stable.

Fig. 6 Imaging result of 2–2.5 GHz with soil moisture of 5.9%
4.3 Discussions
For the purpose of description,the initial soil moisture value before change is also called the master soil moisture while the value after change is named the slave one. Here we employ the coherence table as the tool to show the trend of coherence loss under different soil moisture change situations. Take the 2–2.5 GHz data for example,the coherence values of all possible combinations for those four acquisitions are given in Tab. 2. For each row,the data means coherence between the same master but different slave soil moisture. The values in row decrease from left to right. On the other hand,the data in each column,which represents coherence between different master but the same slave soil moisture,decrease from bottom to top. This is due to the fact that the soil water contents gradually increase during these four acquisitions. The larger change happens in soil water content,the more coherence loss results from it. Similar phenomena are observed in the experiments of all other frequencies. Here only the coherence table of 5.5–6 GHz data is presented in Tab. 3.
When considering the influence of frequency on the coherence loss,we show the coherence trend of the same initial/master but differentslave soil moisture values under various frequency conditions in Fig. 7. The axis x represents the slave soil moisture values,and axis y denotes the coherence between master and slave data. As is presented,the coherence amplitude decreases as the soil moisture change increases for all frequencies. It can be seen that there is the tendency of saturation for large soil moisture changes. Note that the data of 2–2.5 GHz in red bold line shows a higher coherence than the other frequency. This is in agreement with the common understanding that longer wavelength is less disturbed and hence has better interferometric coherence,even for soil without vegetation.

Tab. 2 Coherence table of four acquisitions (2-2.5 GHz)

Tab. 3 Coherence table of four acquisitions (5.5-6 GHz)
Under the condition that the initial/master soil moisture is fixed,the larger the soil moisture change happens,the lower coherence exists between those two acquisitions. In such cases,the coherence along with the soil moisture change could be thought as a monotonously decreasing function. However,the effect of initial soil moisture value is more complicated when it is considered. For different initial soil moisture values,the same amount of moisture change could result in different coherence loss,and vice versa. In another word,the coherence loss not only depends on the soil moisture change,but also depends on the initial value. Fig. 8 gives the coherence results along with the increase of soil moisture changes,with different initial soil moisture values all together. In this figure,the axis x represents the difference of master and slave soil moisture values,i.e. the delta soil moisture. It is observed that the effect of initial soil moisture is quite large,and the curves are not monotonously decreasing any more. The phenomenon implicates that even if other decorrelation factors have been all excluded for a certain frequency,the same value of coherence doesn't reflect the same amount of soil moisture change.
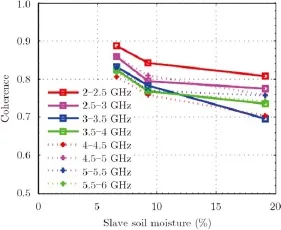
Fig. 7 Frequency influences on coherence caused by soil moisture change (with the same initial soil moisture of 5.9%)
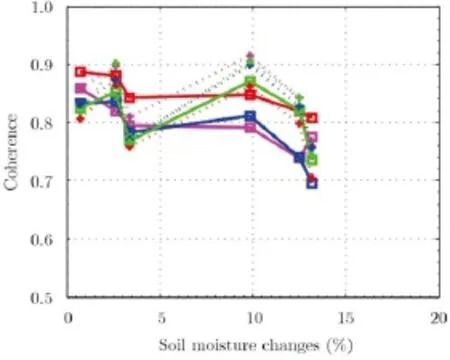
Fig. 8 Frequency influences on coherence caused by soil moisture change with all initial soil moisture values
Nevertheless,among all these frequencies,2–2.5 GHz (in red solid line) displays the most insensitivity to the initial soil moisture values. At least,the soil water addition does not lead to obvious coherence increase. For example,with the soil moisture change from 9.25% to 19.1%,the coherence decreased to 0.847. This is in the same level with the coherence obtained when soil wa-ter content changing from 6.6% to 9.25% (coherence is 0.842). In contrast,for 5.6–6 GHz (in green dash line) the coherence reaches to 0.906 with the soil moisture change from 9.25% to 19.1%,which is much higher than the one corresponds to small soil moisture change from 6.6% to 9.25% (coherence is 0.767). Here small soil moisture change refers to large coherence loss. We can clearly see the big down and up trend in Fig. 8 for data of 4–6 GHz. It means the larger soil moisture change doesn't correspond to larger coherence loss,when different initial soil moistures are considered together. And this effect is undesired,because the bias on the assumed initial moisture value could cause very big errors. Fortunately,it is found in our experiment that low frequency is advantageous in its insensitivity on the initial values,as well as the bias of initial values.
5. Conclusions
Soil moisture change is analyzed as a decorrelation source of InSAR coherence in this study,in terms of ASAR and laboratory data experiments. The ASAR data experiment shows the limitation of long revisit spaceborne InSAR data on coherence,which could be greatly improved by the new launched Sentinel1 and ALOS2 data. Yet many issues have to be solved before the coherence is applied for soil moisture estimation using spaceborne data in practice,such as the exclusions of other decorrelation contributors. Hence the experiment data obtained in anechoic chamber is further designed and investigated. Coherence amplitudes are compared for the combinations of multi-measurements under different soil moisture values by use of coherence table. There is good agreement that larger soil moisture change always causes more coherence loss if the same master or the same slave data is considered. Furthermore,low frequency of 2–2.5 GHz is found advantageous not only for higher coherence level but also for its insensitivity on the initial soil moisture value. More experiments of large frequency coverage should be implemented in future.
Acknowledgement
The authors would like to thank European Space Agency for Envisat ASAR & AgriSAR campaign data provision,and Science and Technology on Electromagnetic Scattering Laboratory for the data collection in their anechoic chamber.
References
[1]Barrett B,Whelan P,and Dwyer E. Detecting changes in surface soil moisture content using differential SAR interferometry[J]. International Journal of Remote Sensing,2013,34(20): 7091–7112.
[2]Gabriel A,Goldstein R,and Zebker H. Mapping small elevation changes over large areas: differential radar interferometry[J]. Journal of Geophysical Research,1989,94: 9183–9191.
[3]Hajnsek I and Prats P. Soil moisture estimation in time with D-InSAR[C]. IEEE International Geoscience and Remote Sensing Symposium,Boston,USA,2008: 546–549.
[4]Hensley S,Michel T,Van Zyl J,et al.. Effect of soil moisture on polarimetric-interferometric repeat pass observations by UAVSAR during 2010 Canadian soil moisture campaign[C]. IEEE International Geoscience and Remote Sensing Symposium,Vancouver,Canada,2011: 1063–1066.
[5]Zhang T,Zeng Q,Li Y,et al.. Study on relation between InSAR coherence and soil moisture[C]. ISPRS Congress,Beijing,China,2008: 131–134.
[6]Nesti G,Tarchi D,and Rudant J. Decorrelation of backscattered signal due to soil moisture changes[C]. IEEE International Geoscience and Remote Sensing Symposium,Firenze,Italy,1995: 2026–2028.
[7]Nolan M,Fatland D,and Hinzman L. DInSAR measurement of soil moisture[J]. IEEE Transactions on Geoscience and Remote Sensing,2003,41(12): 2802–2813.
[8]Morrison K,Bennett J,Nolan M,et al.. Laboratory measurement of the DInSAR response to spatiotemporal variations in soil moisture[J]. IEEE Transactions on Geoscience and Remote Sensing,2011,49(10): 3815–3823.
[9]De Zan F,Parizzi A,Prats-Iraola P,et al.. A SAR interferometric model for soil moisture[J]. IEEE Transactions on Geoscience and Remote Sensing,2014,52(1): 418–425.
[10]Yin Q,Hong W,Li Y,et al.. analysis on soil moisture estimation of SAR data based on coherent scattering model[C]. 10th European Conference on Synthetic Aperture Radar,Berlin,Germany,2014: 739–742.
[11]Zwieback S,Hensley S,and Hajnsek I. Assessment of soil moisture effects on L-band radar interferometry[J]. Remote Sensing of the Environment,2015,164: 77–89.

Yin Qiang (1982–) is currently a Ph.D. candidate in University of Chinese Academy of Sciences. She received her Master degree in signal and information processing from Graduate University of Chinese Academy of Sciences in 2008. She has work experiences in the Institute of Electronics,Chinese Academy of Sciences,and European Space Agency as assistant researcher and research fellow,respectively. Her current research interests include scattering modeling,polarimetric/interferometric SAR processing and soil moisture application.
Huang Ping-ping (1978–) is an associate professor and supervisor of master students. His research interests are SAR imaging algorithms,data preprocessing,and applications.
Hong Wen (1968–) is a professor and supervisor of Ph.D. graduate students. Her research interests include Radar signal processing theory,SAR imaging algorithms,microwave remote sensing image processing and its applications etc.
10.12000/JR15075
土壤湿度变化引起的干涉SAR相干性损失分析
尹 嫱①②李 洋①②黄平平③林 赟②洪 文②
①(中国科学院大学 北京 100049)
②(中国科学院电子学研究所微波成像国家重点实验室 北京 100190)
③(内蒙古工业大学 呼和浩特 010051)
干涉SAR的相干性对于数据质量的衡量和与后向散射结合的目标信息提取,都具有重要的意义。然而相比其他的去相干源,土壤湿度变化引起的重轨干涉SAR的去相干尚未得到充分的研究。该文利用Envisat ASAR和暗室数据分析了由土壤湿度变化引起的重轨干涉SAR的相干性损失。C波段ASAR数据仅在裸土或草地区域具有较高的相干性,意味着这两种陆地覆盖类型比较适合作为土壤湿度变化对星载数据干涉相干性影响的研究对象。此外重访周期短的星载SAR即使对于农田区域具有重要的应用潜力。由于微波暗室的可控环境,特别是能够去除其他去相干源的影响,因而设计开展了暗室实验,并详细分析了土壤样本的观测数据。实验发现低频2–2.5 GHz具有较高的相干性,并且对土壤湿度初值的敏感度较低。这表示在利用干涉相干性信息提取土壤湿度变化时,至少是在相干性水平和对土壤湿度初值的敏感度方面,S波段优于C波段。
重轨;雷达干涉;相干性;土壤湿度
TN959
A
2095-283X(2015)-06-0689-09
Manuscript June 15,2015; Revised October 12,2015. Published online October 29,2015.
Supported by the National Natural Science Foundation of China (61431018,61201404,61461040) and the Special Project of Inner Mongolia Key Science & Technology.
*Communication author: Hong Wen.
E-mail: wendy_iecas@163.com.
Li Yang (1983–) his Ph.D. degree in 2015. His research interests include polarimetric SAR information processing and application.
Lin Yun (1983–) her Ph.D. degree in 2011. She is currently an assistant researcher. Her research interests are Radar signal processing theory and imaging algorithms.
