位移谐振子模型对三(2-苯基吡啶)合铱磷光光谱影响的理论研究
2015-12-05王晓峰左国防李志锋李会学
王晓峰 左国防 李志锋 李会学
(天水师范学院化学工程与技术学院, 甘肃 天水 741001)
位移谐振子模型对三(2-苯基吡啶)合铱磷光光谱影响的理论研究
王晓峰 左国防 李志锋 李会学*
(天水师范学院化学工程与技术学院, 甘肃 天水 741001)
采用谐振子模型理论探讨了振动模式对Ir(ppy)3配合物的磷光光谱的影响. 多原子分子发射光谱的一般形式可以从两个绝热电子态之间的热振动关联函数推导出, 相应地势能面之间的位移和Duschinsky转动的影响也被包含在多维谐振子模型的表达式中, 所得关系式模拟出了Ir(ppy)3较为精细的磷光发射光谱. 计算结果表明T1态到S0态之间的0→1振动跃迁对发射光谱贡献较大, 尤其振动频率小于1600 cm–1的振动模贡献更多, 配体中苯和吡啶环上C=C和C=N的呼吸振动, 是Ir(ppy)3出现肩峰的主要原因. 玻耳兹曼分布使得主峰和肩峰的强度下降, 并且两峰相互接近. 该谐振子模型与密度泛函理论(DFT)结合, 可以较好地定量描述多原子分子光物理过程的发射光谱以及详细了解光谱谱图的细节.
理论研究; 磷光光谱; 位移谐振子模型; Ir(ppy)3
1 Introduction
Transition metal complexes have attracted comprehensive interest among researchers all over the world, in particular as active components in organic photoelectric devices. The transition moment of iridium complexes is not zero between S0and T1states due to the large amount of spin-orbit coupling induced by the heavy metal ion, which can increase the rate of electron spin flip and break the prohibition of spectrum selection rule, so the experimental phosphorescence can be observed and some studies showed that Ir complexes are good organic phosphorescent materials for use in organic light emitting diodes (OLEDs),1–3the internal efficiencies of almost 100%4had been achieved by using the phosphorescent emission from fac-tris(2-phenylpyridine) iridium(III) [Ir(ppy)3]. In addition, these complexes possess the advantages such as versatility, ease of chemical synthesis, convenient processing, low weight, and flexibility, which is suitable for mass production.
A number of theoretical studies have been undertaken on Ir(ppy)3,5,6which indicate that the lower energy excited states are metal-to-ligand charge transfer (MLCT) states, and the observed phosphorescence originates from the lowest lying MLCT state that has a strong admixture of singlet character. Moreover there exists a high density of these spin-mixed states, the character of these states can vary from either being predominantly singlet or triplet to being a mixture of singlet and triplet states via the process of intersystem crossing (ISC). Wu and Bredas7calculated the phosphorescent emission spectra of Ir(ppy)3based on the time-dependent approach according to the Herman-Kluk semiclassical initial value representation method, taking the Duschinsky rotation effect explicitly into account, the potential energy surfaces for the S0, T1, and T2states with the corresponding normal modes for each electronic state were investigated. The results showed emission from the T2state is unlikely, the Duschinsky rotation effect has little effect on the emission spectrum from the T1state. Jansson et al.8calculated the spin-orbit coupling effects and the radiative lifetime of Ir(ppy)3in the high temperature limit by time-dependent density functional theory (DFT) using quadratic response technology, they found that the orbital structure of the T1state has a localized character and that the T1→S0transition is determined mostly by charge transfer from one of the ligands to the metal. Breu et al.9found that the crystal of Ir(ppy)3was severely hampered by systematic twinning and pseudo-symmetry, the packing motifs with intermolecular “π–π interactions” of T-shaped and “shifted π stack" geometry were realized. The systematic twinning leads to the rigorously alternating chirality, which resulted in the differences of the emission spectra in solvent and crystal. Fu et al.10prepared crystalline Ir(ppy)3microrods and nanowires, they found that the phosphorescence decay of Ir(ppy)3microrods and nanowires was much faster than that in degassed solution and the film, the phosphorescence of microrods was green and the nanowires actually emitted yellow light, it afforded a novel strategy of phosphorescence emission color tuning by controlling the nano- to micro-structure dimensions. Hay5investigated the electronic properties of Ir(ppy)3using time-dependent density functional theory (TDDFT), the calculated results were in good agreement with experimental absorption spectra and luminescence, in addition, the calculated results indicated that the metal orbitals involved in the transitions have a significant admixture of ligand π character, all of the low-lying transitions were categorized as MLCT transitions.
Theoretical study and quantitative analysis to the decay processes of the electronic excited states have important significance to illuminate phosphorescence spectrum, we studied the influences of the Duschinsky rotation effect and the reorganization energy between the ground state and the triplet state on phosphorescence spectrum. The Duschinsky rotation effect may affect the results of calculated emission spectral peak, which comes from the mixing of the normal modes in the initial and final electronic states; in addition, the reorganization energy of molecule is an important factor to affect the shape and the width of spectrum, the projection of reorganization energy into the internal coordinates can show the effect of change of the internal coordinates to the reorganization energy.
In this paper, we took Boltzmann temperature population into account by combing with displacement harmonic oscillator model, and all the transition vibration configurations were contained too, thus the sum-over-states of the Franck-Condon (FC) integrals can be transformed into the integrals of the thermal vibration about the correlation function, the phosphorescence spectrum of Ir(ppy)3can be obtained and verified.
2 Theorerical method
2.1 Optical spectroscopy formalism
Suppose an absorption or emission transition happens between initial vibronic state and final vibronic state. In general, the interaction of the electromagnetic field with molecules can be treated by a simple quantum perturbation theory. The corresponding rates of absorption and emission photon can be obtained using Fermi gold rule. The absorption spectrum is given as the absorption cross section σabs(ω) with dimensions of cm2. This cross section is defined as the rate of photon energy absorption per molecule and per unit radiant energy flux, which is equivalent to the ratio of the power absorbed by the molecule to the incident power per unit area, the σabs(ω) can be written as follows:11,12
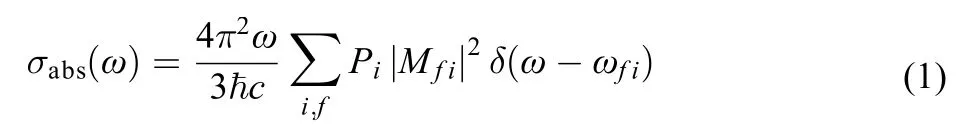
when the incident light intensity is given, the greater the mo-lecular absorption cross section, the greater the molecular absorption power,is reduced Planck constant, c is the velocity of light, Piis the probability of being in the ith state, it is Boltzmann distribution function at thermal〈 equilibr〉ium, Mfiis molecular transition dipole momentω is vibration frequency, δ(ω–ωfi) is delta function, here we apply the Born-Oppenheimer approximation, on which the vibronic states are described by the products of the electronic states and the vibrational statesthe letters i and f are used only as labels of the initial and the final electronic states, respectively. For strongly allowed transitions (that is, the electron transition dipole momentplays a leading role), the Condon approximation can be employed, the equation can be rewritten as follows:13,14
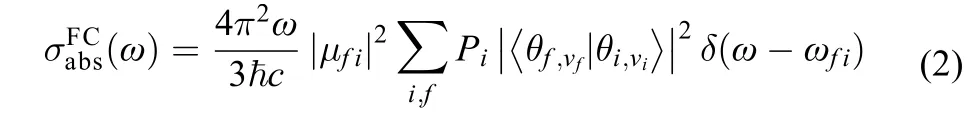
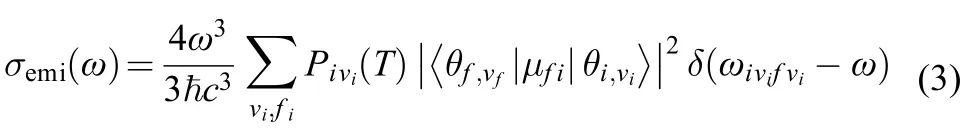
For weakly strongly allowed or forbidden transitions (that is, the electron transition dipole moment μfiis almost zero), the higher order term about Mfimust be taken into account, such as Herzberg-Teller effect. The emission spectrum is given as the differential spontaneous photon emission rate σemi(ω). This is a dimensionless quantity defined as the rate of spontaneous photon emission per molecule and per unit frequency between ω and (ω + dω). The explicit expression for σemi(ω) is given by the following formula:13,14

2.2 Displaced Harmonic oscillator model
For large and semirigid molecules, since nonadiabatic couplings are negligible and displaced harmonic approximation is reliable.15,16In this approximation, supposing the distortion effect of potential energy surface (PES) can be ignored, so Duschinsky rotation effect is little, thus the normal mode frequencies and eigenvectors are the same for both electronic states but the equilibrium positions are shifted relative to each other. Under the harmonic PES approximation, the spectrum is usually dominated by the zero-order term of the expansion (FC spectrum), in this case the integrals in Eqs.(2, 4) reduce to a sum of products of one-dimensional (1D) integrals, the formalism is simple and possesses a clearer physical picture, both the forms of absorption cross section σabs(ω) and photon emission rate σemi(ω) are the same except their respective frequencies.
When absolute temperature T is 0 K, Eq.(4) can be rewritten as:

in which Franck-Condon factor can be expressed as direct product of one dimensional statesfor each mode k, and Franck-Condon factor can be rewritten by a Poisson distribution as follows:17
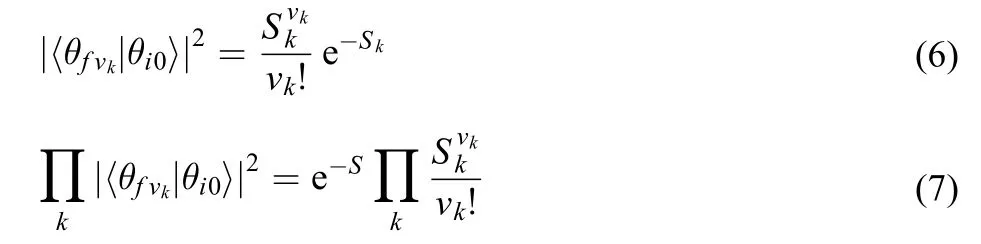
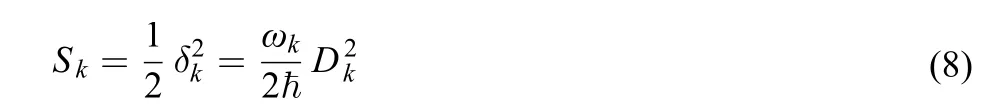
where Skis Huang-Rhys parameter of the kth mode, which is defined as follows:
S is the sum of all the Huang-Rhys parameters.
The one dimensional displaced harmonic oscillator model is illustrated in Fig.1, both the frequencies ω1= ω2due to no distortion effect in PES, and their reorganization energies (λ1,2= Sω1,2) are equal λ1= λ2too. The model indicates that there exists the other transition except 0→0 transition with Huang-Rhys parameter being not zero. When T is not 0 K, Eq.(4) can be rewritten as:


Fig.1 One dimensional displaced harmonic oscillator model
due to Boltzmann population, the transition arises from the quantum number of the initial state νik≠ 0, the Eq.(9) can be simplified by Laguerre polynomials and Fourier transforms as:18
2.3 Computational details
Geometry optimization and frequency calculations were carried out with the Gaussian 03 program package.19The computations of the singlet and triplet geometries, electronic structure, as well as electronic emission spectra for Ir(ppy)3were performed using DFT and TDDFT. The molecular structure of Ir(ppy)3in singlet ground and triplet states has been optimized with B3LYP/Lanl2DZ level of theory. Lanl2DZ is a kind of effective core potentials which consist of a LANL RECP and a double-ζ valence basis set, it has the advantages of relatively low cost, high reliability, and accuracy.20
In general, DFT calculations with the B3LYP hybrid functional overestimate the vibrational frequencies and so we follow the common practice of scaling the computed results by a factor 0.9614, according to Koch and Holthausen.21The correlation function of emission was calculated with home-built programs.
3 Results and discussion
3.1 Geometric structures of Ir(ppy)3in the singlet ground state S0and the first triplet state T1
The geometric structures of Ir(ppy)3were fully optimized in the singlet ground state S0and the first triplet state T1employed B3LYP/Lanl2DZ. The bond lengths of the central atom Ir to C and N atoms in ligand ppy are listed in Table 1, these Ir-N and Ir-C bond lengths in the S0and T1optimized geometries were reported in earlier experiments and calculations as well.9,22,23Although there are small differences in Ir-N bond lengths of about 0.01 nm between our calculations and the crystal structures, such differences are not surprising since the calculations are carried out on a single molecule in vacuum. The bond parameters using mixed basis set (Ir using Lanl2DZ and the other atoms using 6-311G* basis set) are listed too, compared with those by all pseudo potential basis set, of which the calculation error is seemingly larger, however, the optimized geometries of the S0state with both the pseudo potential basis set and mixed basis set have C3symmetry, e.g. all Ir-N bonds have the same distance and so have Ir-C bonds. On the contrary, for the optimized T1state, it only appears A symmetry, the distances between the central atom Ir to N, C atoms in the three ligands are different, Ir-N(3) and Ir-C(3) are the shortest in all Ir-N and Ir-C bonds and it indicates that this ligand is the nearest to the central atom (shown in Fig.2), while the other two ligands are away from Ir atom, obviously the geometry of T1state has great changes when Ir(ppy)3is excited from S0state to T1state.
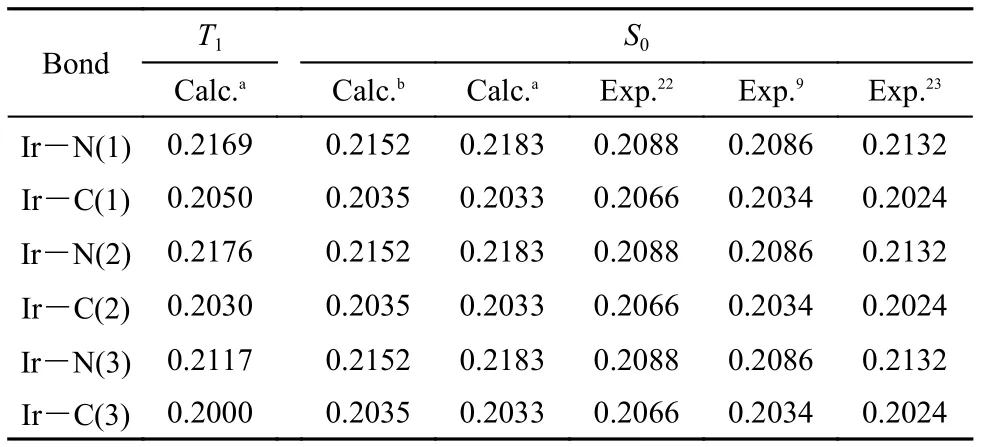
Table1 Part bond lengths (nm) in the optimized S0and T1states
The above change could be understood from the contour plot of frontier molecular orbital. The contour plot of the highest occupied orbital (HOMO) in S0state and the contour of singly occupied molecular orbital (SOMO) in T1state are shown in Fig.2, one can see that the electron density on HOMO in S0is evenly distributed on the three ligands, while those on low SOMO in T1state are distributed mainly on the two ligands, and those on high SOMO are distributed mainly on the other ligand. When an electron is excited from S0state to T1state, the electron density will decrease due to lack of an electron at the HOMO in original state S0, the bond strength between Ir and C, N atoms will weaken, all Ir-N and Ir-C bond lengths are elongated accordingly and all ligands will be away from the center atom, but the excited electron into the LUMO (corresponding to the high SOMO in T1state), which localized in one of the ligands, will give rise to an increase of the electron density on this ligand and Ir atom, so the interaction between the center atom and this ligand is enhanced, which draw center atom and this ligand closer to each other.
3.2 Analysis about vibration mode of Ir(ppy)3
For S0state of Ir(ppy)3with C3symmetry, it has 177 vibrational modes, which can be categorized in A and E irreducible representations based on the group theory. According to the molecule spectrum theory, all the normal vibrational modes of propylene are Raman active and IR active, compared to the S0state, the T1state of Ir(ppy)3has only A irreducible representation, its all vibrational modes are Raman active and IR active too. As for ligand ppy anion, of which molecular formula is C11H8N–and it has 162 vibrational modes, in these modes, there are 15 vibrational modes between the center atom Ir and the ligands, the frequencies of these modes are generally below 400 cm–1due to existence of heavy metal atom. The calculated frequencies of the S0state, the T1state, and the assigned vibrational modes of Ir(ppy)3by B3LYP/Lanl2DZ are listed in Table 2. To understand the vibrational characteristic deeply, the vibrational modes of benzene,24,25pyridine,26and other literature27can be available to assign its vibration. For S0state, the Ir-C and Ir-N scaled stretching vibrations are 156, 172, 174, 278, 311, 312 cm–1by B3LYP/Lanl2DZ, the calculated bending vibrations are 191, 207, 209 cm–1, and there are six low frequency vibrations (twisting) between Ir and ppy. For T1state, its vibrational modes have some change compared with those of the S0state due to the geometry deformation, the modes of 278, 311 cm–1in the Ir-C and Ir-N stretching vibrations disappear, instead of the ones of 220, 227 cm–1, the bending vibrations between both the rings in S0state are taken the place by the torsion vibration too.
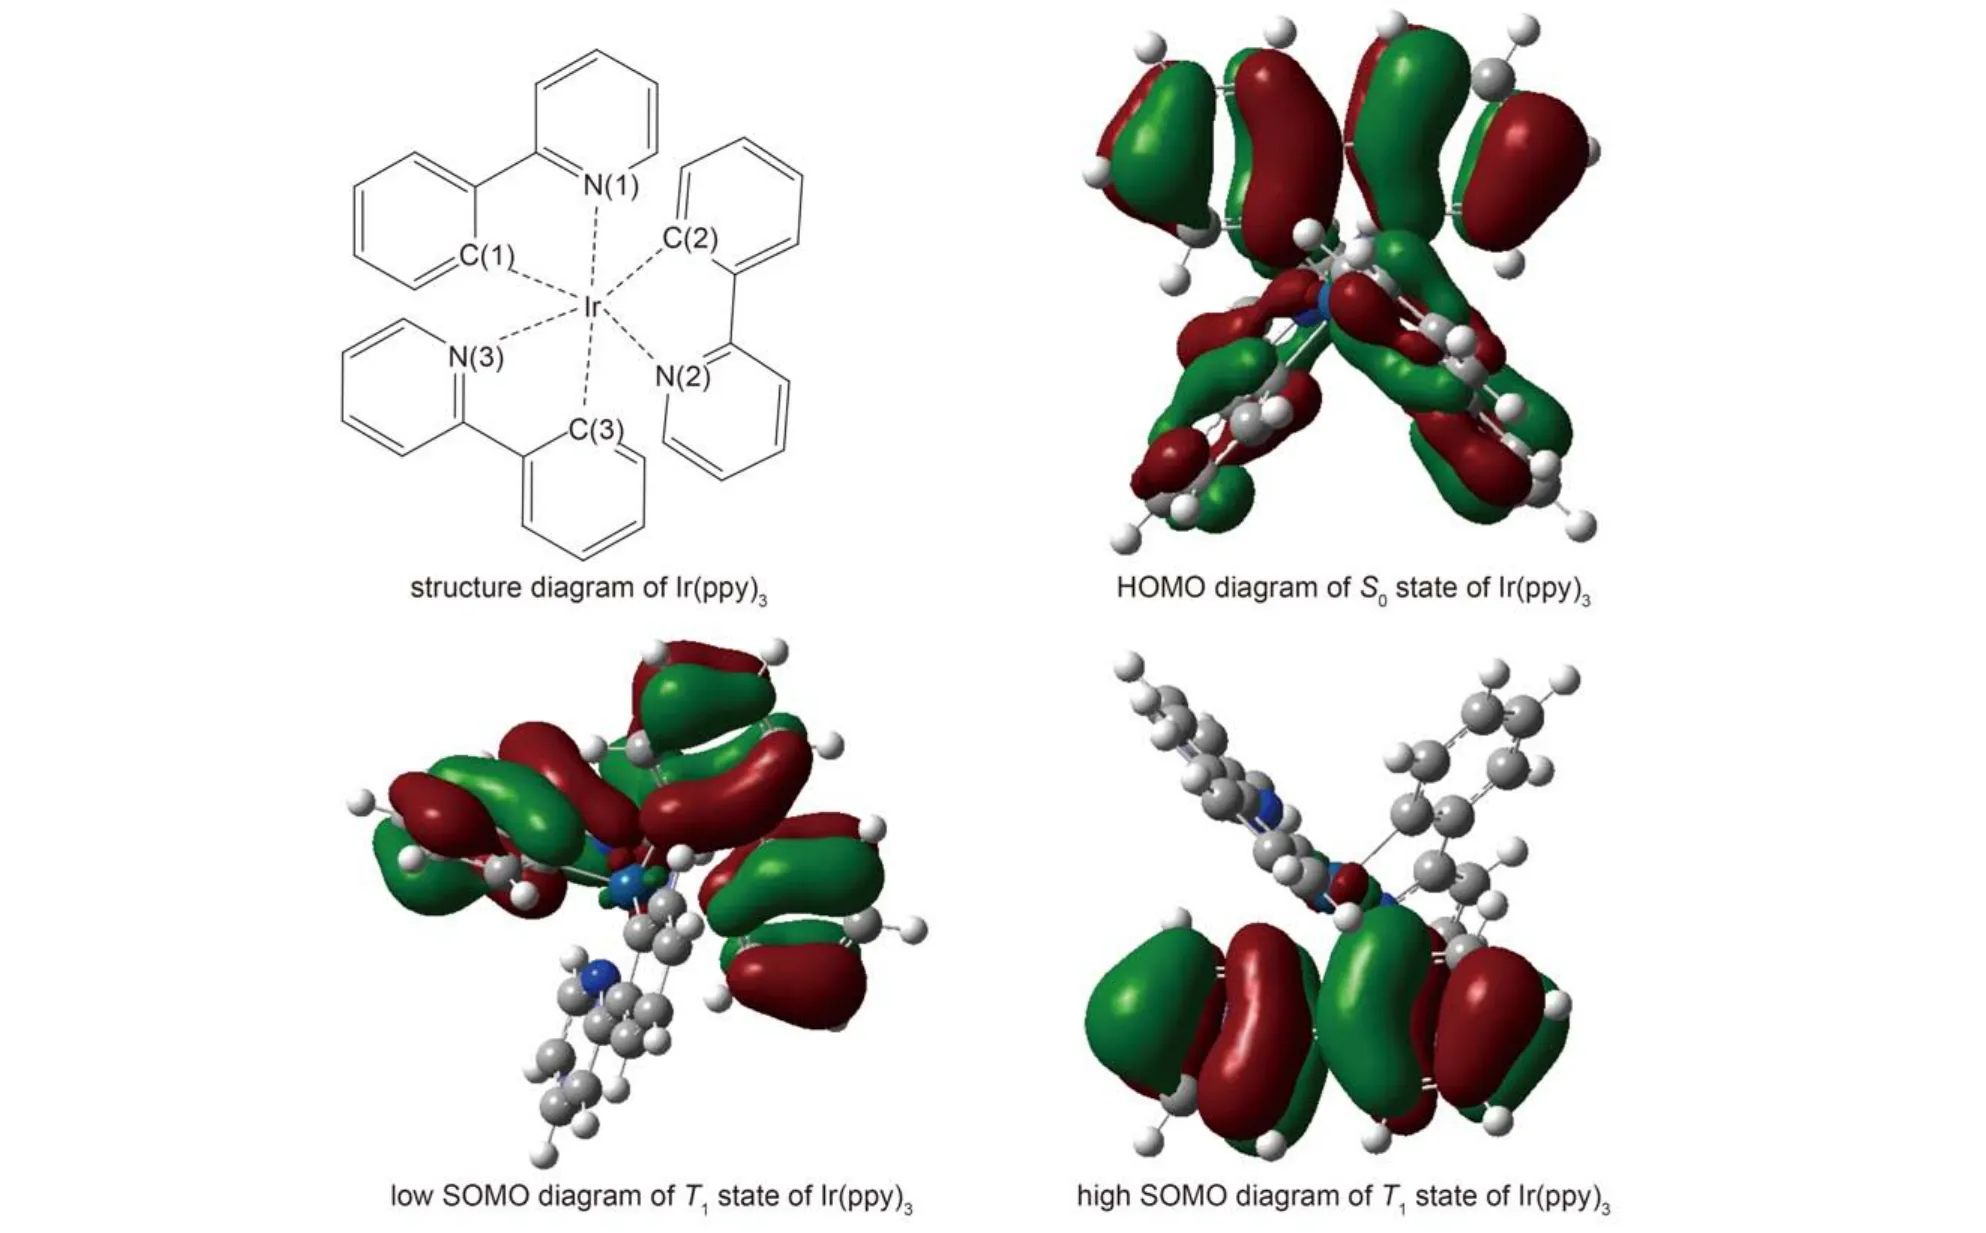
Fig.2 Structure diagram and Frontier molecular orbital diagrams of Ir(ppy)3
The vibrational modes of the ligand itself contain the vibration of benzene ring and pyridine ring, those between both the rings are contained too, generally these vibrations are greater than 400 cm–1. In S0state, the modes with 84, 86, 89 cm–1can be assigned to butterfly vibration between the three ligands. In addition, the twisted vibrations (125, 128, 131 cm–1modes), the scissoring vibrations (231, 232, 267 cm–1modes), the wagging vibrations (280, 283, 291 cm–1), the stretching vibrations (375, 376, 384 cm–1modes), and the rock vibrations (490, 493, 494 cm–1modes) are assigned between the benzene ring and pyridine ring, respectively. The vibrational modes with 1346, 1347, 1348 cm–1are C-C stretching vibrations in benzene ring or pyridine ring. The 1500–1600 cm–1vibrations mainly come from C=C or C=N stretch in the benzene ring and pyridine ring, the other high frequency modes are C-H stretching vibrations. The most of the vibrations in S0state were validated by experiments.27The other vibrational modes in T1state have their counterpart in S0state, only the frequencies are different.
Though the frequencies are listed in sequence, that does not mean the vibrational mode at final state is derived from the same sequence number one at the vibrational level of the initial electronic state, such as the 143rd vibration mode at T1state, the frequency is 1531 cm–1, however, the corresponding one is 1554 cm–1at S0state, the computed results show that the 143rd vibrational mode at T1state is composed of the mode with 1554 cm–1(accounted for 60.5%), the mode with 1534 cm–1(accounted for 12%), and the mode with 1584 cm–1(accounted for 12%) at S0state using Dushin program.
3.3 Simulated phosphorescence spectrum of Ir(ppy)3using discretely spectral line method
The reorganization energy of phosphorescence process is λ1as illustrated in Fig.1, which is from the energy of reorganizing the S0state with the structure of T1state back to the equilibrium structure of S0state, and usually it is called an adiabatic potential energy surface (APES) method.30,31Another widely used approach to calculate the reorganization energy is based on thenormal-mode (NM) analysis method.32When we know the vibrational frequency and displacement of each mode of the S0and T1states about the system, the total relaxation energy from all the vibrational modes is obtained employed Eq.(8). The λ1was 0.239 eV using the APES method, and the one is 0.236 eV using the NM analysis method, we can see that both thereorganization energies are close to each other, so the contribution of each vibrational mode to the reorganization energy can be analyzed by the displaced harmonic oscillator model.

Table2 Part calculated wavenumbers (w) and the assigned vibrational modes of Ir(ppy)3by B3LYP/Lanl2DZ
For both the different electronic states of a real molecule, it is impossible that the displacement of potential energy surface completely accords with the displaced harmonic oscillator model, thus the other transitions can appear except the strongest 0→0 transition. Suppose the displacement of potential energy surface is small, generally 0→1 transition makes a greater contribution to the spectrum, 0→2 transition and higher order terms can be ignored. For 0→0 transition, the Huang-Rhys parameter is e–Swith Eq.(6), which can be used as a criterion for the evaluation of contributions of the other vibration modes, we calculated FC factors from the vibrational ground state (v = 0) of electronic triplet state to the first vibrational excited state (v = 1), the phosphorescence spectrum of Ir(ppy)3has been simulated with given the full width at half maximum (FWHM). The reorganization energy of each vibration model and the displacement of PES between the singlet and triplet states using Dushin program were obtained.33,34

Table3 Calculated vibrational wavenumbers (ω) of Ir(ppy)3by B3LYP/Lanl2DZ at T1state, the reorganization energy (λ) corresponding to T1→S0transition process, Huang-Rhys parameter (Sk), exp(–Sk) and the FC factors of 0→1 transition
In order to investigate the influence of vibration on phosphorescence spectrum, we calculated the each FC factor that corresponds to the transition of each 0→1 vibrational mode, however, some displacements between T1state and S0state, which is corresponding some vibration modes, are too small to be ignored, the calculated results showed that only the Huang-Rhys parameter of 13 vibrational modes are big enough, so their contribution to the displacements is significant. The frequencies of these vibrational modes, the Huang-Rhys parameters, the reorganization energies, the FC factors of 0→1 transition, and the e–Svalues corresponding to 0→1 transition are listed in Table 3. One can see that the FC factors corresponding to 34.6, 35.4, 42.9, 44.4, 52.6 cm–1low frequencies are considerably large in spite of their reorganization energy being small, it can be understood that Huang-Rhys parameter is inversely proportional to vibrational frequency based on equation (6), especially FC factors corresponding to 42.9, 44.4 cm–1are the largest, thus the impact on the emission spectrum is the most significant. However, both the emission peaks overlap together with 0→0 transition peak position due to close to 0→0 transition, therefore, both the 0→1 transition only strengthens the intensity of the largest emission peak, and it makes the emission peak frequency redshift about 50 cm–1. The high frequency vibration modes of 1033.6, 1511.6, 1534.1, 1554.8 cm–1have large FC factors, this is due to large displacement in both the PES before and after the electron transition, the corresponding reorganization energies are large too, which indicates that the breathing vibration and stretching vibration of the ligand have a significant impact on the spectrum, it is this 0→1 transition that leads to the appearance of shoulder peak in phosphorescence spectrum. The data of other vibration modes are given in supplemental file, however, their FC factors are just a little smaller than the above modes due to the frequencies themselves, the contributions to the spectrum are not significant comparatively. In addition, considering that the experimental FWHM of the phosphorescence spectrum about Ir(ppy)3is 2900 cm–1at low temperature (1.5 K),29and the difference is 1210 cm–1between the main peak and the shoulder peak,10suppose that the experimental spectrum mainly includes the 0→0 transition and 0→1 transition, the FWHM should be taken 845 cm–1(2900/2–1210/2), but the spectral line at room temperature is broadened compared with the one in low temperature, so will the FWHM be set to 900 cm–1.
The contribution to organization energy of each vibrational mode is shown in Fig.3, the phosphorescence spectrum of Ir(ppy)3is simulated after taking 0→1 transition into account in Fig.4, the difference between the main and the shoulder peak is about 1370 cm–1when these frequencies are corrected, there are about 160 cm–1error compared with the observed value (about 1210 cm–1),10it was clear that the error derives from the ignorance of higher order term transition and the simplification of model. Fig.5 shows the shape of the simulated phosphorescence spectrum using the discrete spectral line method and the observed spectrum of Ir(ppy)3.29
3.4 Simulated phosphorescence spectrum of Ir(ppy)3using the displaced harmonic oscillator model with T > 0 K
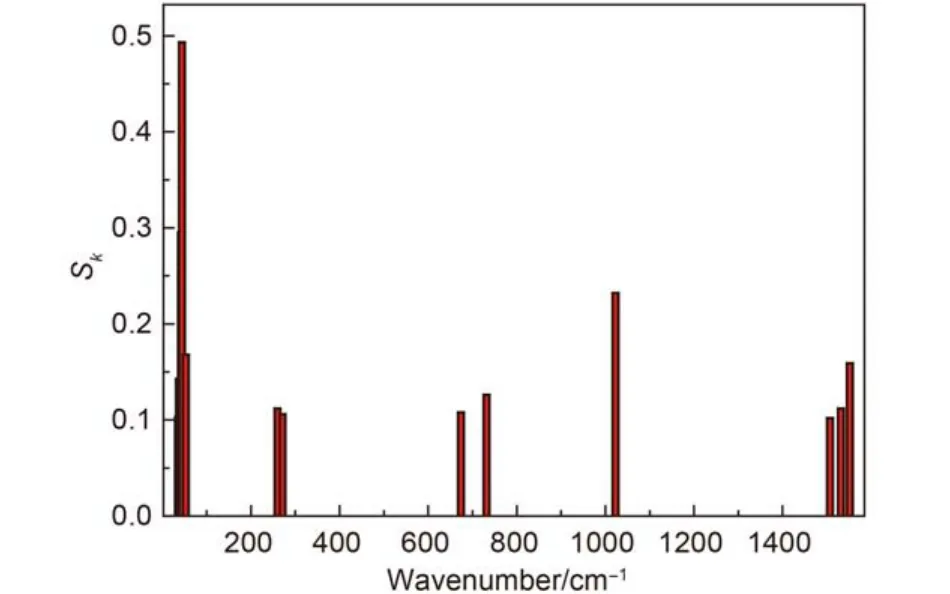
Fig.3 Contribution of the vibrational modes to the Sk
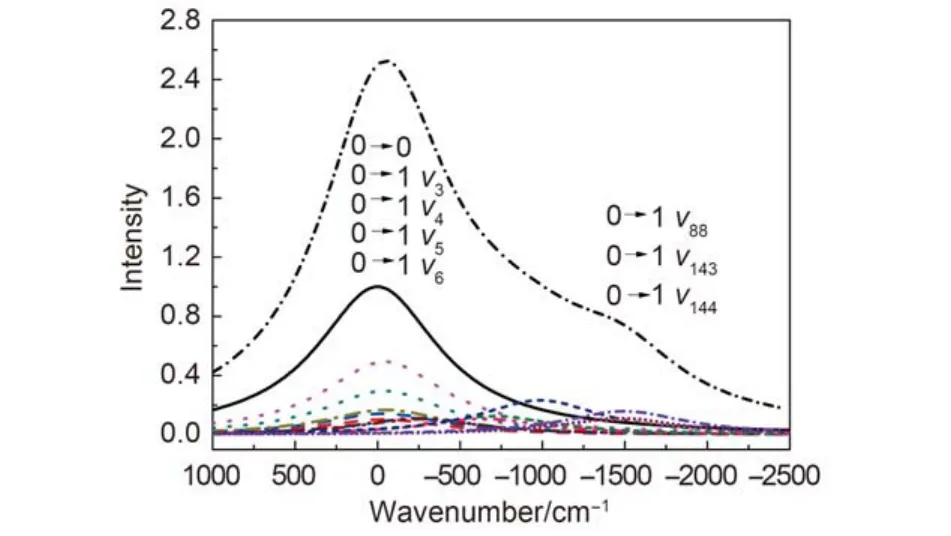
Fig.4 Simulated phosphorescence spectra of Ir(ppy)3using the discrete spectral line method

Fig.5 Simulated phosphorescence spectra of Ir(ppy)3using the discrete spectral line method and the observed spectra29
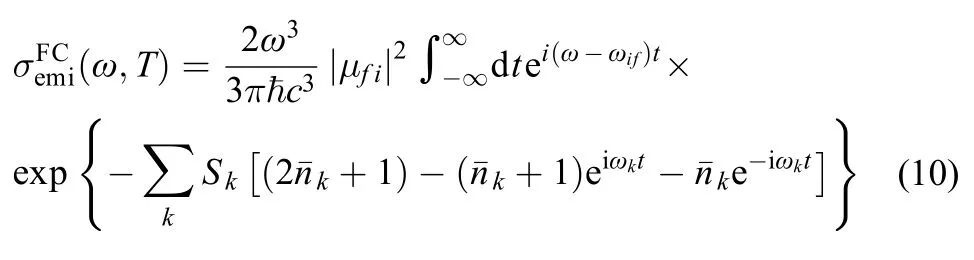
In order to eliminate the defects of the discrete spectral line method, we simulated the phosphorescence spectrum of Ir(ppy)3using the correlation function method (Eq.(10)), a Gauss broadening of 900 cm–1is applied to ensure convergence of the numerical integration for the correlation function. The total time interval for the correlation function is set to [–2457.6 fs, 2457.6 fs], with a time increment, Δt, of 1.2 fs. The phosphorescent emission spectrum contains the contribution of FC factor with the different temperature in Fig.6, two emission peaks can be seen in the spectrum, one is at about 19700 cm–1and the other is at 18500 cm–1, which correspond to about 507 and 540 nm, in addition, the intensities of the main peaks are stronger than the second peaks at 30, 80, and 100 K, obviously the simulated spectra are in good agreement with the observed spectra.

Fig.6 Simulated phosphorescence spectra of Ir(ppy)3using the displaced harmonic oscillator model with T > 0 K
With the increase of temperature, the intensity of emission spectrum decreases accordingly, and the spectrum lines widen in Fig.6, this is mainly due to the Boltzmann distribution, which makes the molecular number of the vibrational ground state decrease when the temperature rises, this cuts down the molecular number of transition from T1to S0state, thus the intensity of spectrum also reduces, thewill be also redshift for the Boltzmann distribution, the calculated value in 300 K is redshifted 81 cm–1than the one in 30 K, in addition, due to broader distribution of vibrational modes, the spectral lines are widen little by little with temperature increasing. As mentioned above, the molecular number in excited vibrational state increases while those decreases in vibrational ground state, the more molecules with extra energy in T1state contribute to the secondto achieve slight blueshift when they transit back to S0state, the secondin 300 K is blueshift 33 cm–1more than the one in 30 K, both the emission peaks have a tendency to close to each other with the temperature increasing, the difference between two peaks is 1293 cm–1in 300 K, which is in good agreement with the experimental value and better than the one by discretely spectral line method.
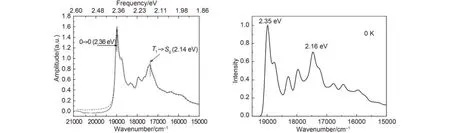
Fig.7 Simulated emission spectra of the T1state
Wu and Bredas7considered the Dushinsky rotation effect to simulate phosphorescent spectra of the complex, the spectrum diagram is shown in Fig.7, theof 0→0 transition is at 2.36 eV and the of Ir(ppy)3T1→S0transition peak is at 2.14 eV, compared with it, we simulated the emission spectrum of at 0 K employed the correlation function without taking Dushinsky rotation effect into account, which is similar to the spectrum by Wu and Bredas for either peak position or peak shape, it indicated that the displaced harmonic oscillator model can well describe the spectral characteristics.
4 Conclusions
In this paper, a general formalism to calculate emission spectra between two adiabatic electronic states was given, which is based on a thermal vibration correlation function formalism within a multidimensional harmonic oscillator model. The formalism can automatically include all the transitions between the vibrational states of the two electronic states. The phosphorescence spectrum of Ir(ppy)3was investigated with the displaced harmonic oscillator model, the calculated results indicated that the 0→1 transition between T1state and S0state has larger contribution to the emission spectrum, especially the vibrational modes below 1600 cm–1contribution more, the breathing vibration of ligands, the C=C and C=N stretching vibrations of benzene, pyridine rings are the main cause of appearance of the shoulder peak in the spectrum. The Boltzmann distribution makes the intensities of both the main peak and the shoulder peak decrease and both the peaks are close to each other.
Acknowledgment: We thank Prof. SHI Qing for the support and guidance in this work. Parts of the calculations were performed on the computer workstation of SHI Qing's group in Institute of Chemistry, Chinese Academy of Sciences.
(1)Baldo, M.; Thompson, M.; Forrest, S. Nature 2000, 403, 750. doi: 10.1038/35001541
(2)Yersin, H. Highly Efficient OLEDs with Phosphorescent Materials; Wiley. com.: Betz-Druck GmbH, Darmstadt, 2008.
(3)Yang, T. T.; Xu, H. X.; Wang, H.; Miao, Y. Q.; Du, X. G.; Jing, S.; Xu, B. S. Acta Phys. -Chim. Sin. 2013, 29, 1351. [杨婷婷, 许慧侠, 王 华, 苗艳勤, 杜晓刚, 景 姝, 许并社. 物理化学学报, 2013, 29, 1351.] doi: 10.3866/PKU.WHXB201303281
(4)Adachi, C.; Baldo, M. A.; Thompson, M. E.; Forrest, S. R. J. Appl. Phys. 2001, 90, 5048. doi: 10.1063/1.1409582
(5)Hay, P. J. J. Phys. Chem. A 2002, 106, 1634. doi: 10.1021/ jp013949w
(6)Nozaki, K. J. Chin. Chem. Soc. 2006, 53, 101. doi: 10.1002/ jccs.v53.1
(7)Wu, Y. H.; Bredas, J. L. J. Chem. Phys. 2008, 129, 214305. doi: 10.1063/1.3027514
(8)Jansson, E.; Minaev, B.; Schrader, S.; Agren, H. Chem. Phys. 2007, 333, 157. doi: 10.1016/j.chemphys.2007.01.021
(9)Breu, J.; Stossel, P.; Schrader, S.; Starukhin, A.; Finkenzeller, W. J.; Yersin, H. Chem. Mater. 2005, 17, 1745. doi: 10.1021/ cm0486767
(10)Wang, H.; Liao, Q.; Fu, H. B.; Zeng, Y.; Jiang, Z. W.; Ma, J. S.; Yao, J. N. J. Mater. Chem. 2009, 19, 89. doi: 10.1039/ B814007C
(11)Niu, Y.; Peng, Q.; Deng, C.; Gao, X.; Shuai, Z. J. Phys. Chem. A 2010, 114, 7817.
(12)Santoro, F.; Lami, A.; Improta, R.; Bloino, J.; Barone, V. J. Chem. Phys. 2008, 128, 224311. doi: 10.1063/1.2929846
(13)Xu, G. X.; Li, L. M.; Wang, D. M.; Chen, M. B. Quantum Chemistry——The Basic Principle and ab initio Calculation Method; Science Press: Beijing, 2008. [徐光宪, 黎乐民, 王德民,陈敏伯. 量子化学——基本原理和从头计算法(下). 北京: 科学出版社, 2008.]
(14)Liang, K. K.; Chang, R.; Hayashi, M.; Lin, S. H. Principles of Molecular Spectroscopy and Photochemistry; Chky Publish: Taipei, 2001.
(15)Jankowiak, H. C.; Stuber, J.; Berger, R. J. Chem. Phys. 2007, 127, 234101. doi: 10.1063/1.2805398
(16)Dierksen, M.; Grimme, S. J. Chem. Phys. 2005, 122, 244101. doi: 10.1063/1.1924389
(17)Scholz, R.; Kobitski, A. Y.; Kampen, T. U.; Schreiber, M.; Zahn, D. R. T.; Jungnickel, G.; Elstner, M.; Sternberg, M. Phys. Rev. B 2000, 61, 13659. doi: 10.1103/PhysRevB.61.13659
(18)Lin, S. H.; Chang, C. H.; Liang, K. K.; Chang, R.; Shiu, Y. J.; Zhang, J. M.; Yang, T. S. Adv. Chem. Phys. 2002, 121, 1. doi: 10.1002/0471264318
(19)Frisch, M. J.; Trucks, G. W.; Schlegel, H. B.; et al. Gaussian 03, Revision E.01; Gaussian Inc.: Wallingford, CT, 2004.
(20)Wadt, W. R.; Hay, P. J. J. Chem. Phys. 1985, 82, 284. doi: 10.1063/1.448800
(21)Koch, W.; Holthausen, M. C. A Chemist's Guide to Density Functional Theory; Wiley-Vch Weinheim, Berlin, 2001.
(22)Allen, F. K.; Kennard, O. Design Autom. News 1993, 8, 131.
(23)Garces, F. O.; Dedeian, K.; Keder, N. L.; Watts, R. J.; Acta Crystallogr. Sect. C-Cryst. Struct. Commun. 1993, 49, 1117. doi: 10.1107/S0108270193000836
(24)Herzfeld, N.; Ingold, C. K.; Poole, H. G. J. Chem. Soc. 1946, 316.
(25)Varsanyi, G.; Hilger, A. Assignments for Vibrational Spectra of Seven Hundred Benzene Derivatives; Wiley: New York, 1974.
(26)Long, D.; Murfin, F.; Thomas, E. Trans. Faraday Soc. 1963, 59, 12. doi: 10.1039/tf9635900012
(27)Lai, S. X. Build and Application of Raman Spectroscopy System: the Research of Vibrational Modes in Tris(2-phenylpyridine) iridium Compound and the Linear Three Nuclear Metal Compound. Master Thesis, National Tsinghua University: Taiwan, 2007. [赖思学. 拉曼光谱系统架设与应用: 在三-(2-苯基吡啶)合铱金属错合物之振动模式研究与直线型三核金属串错合物之振动模式研究, 国立清华大学: 台湾, 2007.]
(28)Hedley, G.; Ruseckas, A.; Samuel, I. Chem. Phys. Lett. 2008,450, 292. doi: 10.1016/j.cplett.2007.11.028
(29)Finkenzeller, W. J.; Yersin, H. Chem. Phys. Lett. 2003, 377, 299. doi: 10.1016/S0009-2614(03)01142-4
(30)Zhang, W.; Liang, W.; Zhao, Y. J. Chem. Phys. 2010, 133, 024501. doi: 10.1063/1.3456545
(31)Nelsen, S. F.; Blackstock, S. C.; Kim, Y. J. Am. Chem. Soc. 1987, 109, 677. doi: 10.1021/ja00237a007
(32)Kwon, O.; Coropceanu, V.; Gruhn, N.; Durivage, J.; Laquindanum, J.; Katz, H.; Cornil, J.; Brédas, J. L. J. Chem. Phys. 2004, 120, 8186. doi: 10.1063/1.1689636
(33)Reimers, J. R. J. Chem. Phys. 2001, 115, 9103. doi: 10.1063/1.1412875
(34)Cai, Z. L.; Reimers, J. R. J. Phys. Chem. A 2000, 104, 8389. doi: 10.1021/jp000962s
Theoretical Study of the Phosphorescence Spectrum of Tris(2-phenylpyridine)iridium Using the Displaced Harmonic Oscillator Model
WANG Xiao-Feng ZUO Guo-Fang LI Zhi-Feng LI Hui-Xue*
(College of Chemical Engineering and Technology, Tianshui Normal University, Tianshui 741001, Gansu Province, P. R. China)
We present a comprehensive investigation of the phosphorescence spectrum of Ir(ppy)3(ppy = 2-phenylpyridine), which is greatly influenced by vibration of the complex. General formalism of the emission spectrum is derived using a thermal vibration correlation function formalism for the transition between two adiabatic electronic states in polyatomic molecules. Displacements and Duschinsky rotation of potential energy surfaces are included within the framework of a multidimensional harmonic oscillator model. This formalism gives a reliable description of the emission spectrum of Ir(ppy)3. The calculated results indicated that the 0→1 transition between the T1state and the S0state makes a large contribution to the emission spectrum, especially the vibrational modes below 1600 cm–1. The breathing vibration of the ligands and the CC and CN stretching vibrations of benzene and pyridine rings are the main reasons for the appearance of the shoulder peak in the spectrum. The Boltzmann distribution makes the intensities of both the main and the shoulder peaks decrease, and the peaks are close together. When coupled with first-principles density functional theory (DFT) calculations, the present approach appears to be an effective tool to obtain a quantitative description and detailed understanding of the spectra and photophysical processes of polyatomic molecules.
Theoretical study; Phosphorescence spectrum; Displaced harmonic oscillator model; Ir(ppy)3
O641
10.3866/PKU.WHXB201507092
Received: May 7, 2015; Revised: July 9, 2015; Published on Web: July 9, 2015.
*Corresponding author. Email: li_hx2001@126.com; Tel: +86-15097274526.
The project is supported by the National Natural Science Foundation of China (21465021, 21463023), Key Project of Chinese Ministry of Education (211189), Natural Science Foundation of Province of Gansu, China (1208RJZE139), Program of Gansu Provincial University for Leaders of Disciplines in Science, China (11zx-04), Key Subject of Tianshui Normal University, China.
国家自然科学基金(21465021, 21463023), 教育部重点项目(211189), 甘肃省自然科学基金(1208RJZE139), 甘肃省高校领军人才项目(11zx-04)及天水师范学院重点学科项目资助
© Editorial office of Acta Physico-Chimica Sinica