Upregulated hepatic expression of mitochondrial PEPCK triggers initial gluconeogenic reactions in the HCV-3 patients
2015-11-30TaimoorIslamSheikhTashfeenAdamIshtiaqQadri
Taimoor Islam Sheikh, Tashfeen Adam, Ishtiaq Qadri
1Institute of Medical Science, University of Toronto, Toronto, Ontario, Canada
2Department of Gastroenterology, PIMS Islamabad, Pakistan
3King Fahd Medical Research Center, King Abdul Aziz University, Jeddah, Saudi Arabia
1. Introduction
Approximately, 170 to 200 million people are infected with hepatitis C virus (HCV)worldwide, which is about 3.3% of the world’s population[1,2]. Infection with HCV is associated with an increased risk of fatty liver disease, diabetes type-2 (DT2)and a condition referred to as non-alcoholic steatohepatitis (NASH)[3].fatty liver disease is a state in which abnormal retention of massive vacuoles of triglyceride fat and glycogen accumulates in liver cells through the process of steatosis. NASH is a chronic liver condition in which both FLD and DT2 are present but other causes of fat accumulation, such as alcohol abuse, autoimmune hepatitis,alpha-1 antitrypsin deficiency, corticosteroids and estrogens use are absent[4]. In Pakistan, more than 10 million people are assumed to be infected with HCV and the most prevalent genotype is 3[5]. Among all HCV genotypes, genotype 3 has more significant association with accelerated fibrosis comparatively[6]. Insulin resistance and DT2 can adversely affect HCV infected patients by reducing SVR and accelerate disease progression[3,7]. In addition to that, sustained virological response is one of the major causes of HCV associated steatosis and an increased risk of hepatocellular carcinoma[7,8].Furthermore, higher incidence of transplant-related morbidity and mortality is observed in patients with insulin resistance and DT2[9].In recent years, the association between HCV infection and gluconeogenesis has been extensively described[10,11]. Microarray analysis of HCV infected subjects (in particular genotype 3)has shown the induced transcription of several metabolic genes in the liver tissues[3, 6]. Expression levels of hepatic phosphoenolpyruvate carboxykinase (PCK)which is an important gluconeogenesis enzyme, greatly influences the modulation of glucose synthesis[11].Mitochondrial PCK is encoded by the PCK2 gene located at 14q11.2 chromosome in humans. A cytosolic form of this protein is encoded by a different gene, PCK1, which has received the most attention due to its higher expression in mouse liver, but in humans both isozymes are expressed approximately equally[12]. G6PC catalyzes the hydrolysis of D-glucose 6-phosphate to D-glucose and orthophosphate and is a key functioning enzyme involved in gluconeogenesis and glycogenolysis. Forkhead box O1 (FOXO1)is a transcription factor responsible for the regulation of PCK and glucose-6-phosphatase, catalytic subunit (G6PC)gene expression.Mis-regulated expression of hepatic PCK, G6PC and FOXO1 in HCV infected hepatocellular carcinoma cell lines (namely huh7.5 and huh.8)have shown a direct involvement of the HCV core and nonstructural 5A protein[10,11,13,14]. Higher expression levels of PCK, G6PC and FOXO1 mRNA in the liver biopsies of HCV patients with steatosis were observed when compared with normal liver hepatocytes[15].
Clinical symptoms of HCV infection such as fatigue, joint pain,belly pain, itchy skin, sore muscles and dark urine, only develop in minority of cases. This paucity of symptom keeps most cases undiagnosed even after many years of HCV infection[16]. As the association of HCV infection and DT2 is present before the onset of cirrhosis, here we aimed to evaluate the expression of PCK2, G6PC and FOXO1 as potential biomarkers to induce HCV associated glucose hemetistasis and associated metabolic liver disorders.
2. Materials and methods
2.1. Patient(s)characteristics
All patients were enrolled for sampling according to the ethical guidelines of the 1975 Declaration of Helsinki after approval of hospital ethic committee. The routine histopathological test was ordered by the patient’s physician after explaining the risks and benefits of testing to the patient and had obtained written informed consent. A recent clinic note summarizing the case and the prior workup was also provided by the patient’s physician. A short clinical questionnaire was constructed to collect the patients’ history by interview. Subjects of varying gender and age were enrolled. As our aim was to look at the expression levels exclusively due to HCV replication, we adopted stringent enrolment criteria and only those patients who met the following conditions were enrolled:1)chronically infected HCV patients of diverse age, sex (male/female)with positive viral RNA in serum; 2)No other known viral and/or bacterial co-infection, alcoholism or diabetes. 3)Patients without any drug or chemical treatment and/or interferon, pegylated interferon and ribavirin therapy treatment history. Postmortem liver samples of healthy individuals with negative HCV viral RNA (RTPCR)and ≤40 alanine transaminase (ALT)levels with no apparent liver abnormalities were taken as HCV negative controls (First Choice® Human Tissue Total RNA AmbionR, Life TechnologiesTMUSA). Blood tests such as HCV viral load (copies/mL)and HCV genotyping were conducted at the National University of Science and Technology’s molecular diagnostic facility as recommended by center for disease control USA (http://www.cdc.gov/hepatitis/HCV/GuidelinesC.htm).
2.2. Sample collection
The sampling was done at PIMS Islamabad, following approval by the Hospital Ethics Committee. Written informed consent was obtained from the patients for publication of this report. Two mL whole blood samples were collected in a sterile blood collection tube for histological evaluation and partly for RNA extraction. The surgically removed biopsy samples were processed for routine histopathological examination. The sample part unnecessary for histological diagnosis was placed in RNAlater (AmbionR, Life TechnologiesTMUSA)for gene expression studies. The negative control sample was prepared from the tissues that had been frozen and stored in RNAlater. All samples were placed at -80 ℃.
2.3. Clinical diagnostics
Blood samples from each subject were used to conduct clinical diagnostic assessments including complete blood picture,blood glucose and ALT levels, HCV Genotyping and viral load quantification (Table 1). Each patient was examined for histopathological abnormalities and by abdominal ultrasound for visible change in liver echotexture.
2.4. RNA preparation
Total RNA of all tissue samples was extracted by using RNAqueous®-4PCR Kit (Ambion®, Life TechnologiesTMUSA)according to manufacturer's instructions. Total RNA prepared from normal liver tissues that had been frozen / stored in RNAlater before extraction were used as an HCV negative control. Final concentrations of all the RNA samples including HCV negative healthy control were adjusted to 50 ng/µL by using 260/280-nm absorbance ratio (BioPhotometer Plus &Hellma® Tray Cell,Eppendorf).
2.5. Reverse transcriptase quantitative real time polymerase chain reaction (qRT-PCR)
Primers for PCK2, G6PC and FOXO1 were designed with the assistance of the Primer Express 3.0 software (Applied Biosystems,USA). First strand cDNA was synthesized by RevertAid™ First Strand cDNA Synthesis Kit by using random hexamer primers (All from Fermentas)were then amplified by using oligos targeting transcripts of PCK2, G6PC and FOXO1. Glyceraldehyde-3-phosphate dehydrogenase (GAPDH)was used with all cDNA samples as an endogenous control.
qRT-PCR of first stand cDNA of three replicates of each sample targeting transcripts of PCK2, G6PC and FOXO1 were performed on 7300 Fast Real-Time PCR Systems (Applied Biosystems USA). 50 µL reactions with Taq Polymerase with optimal 5× Taq buffers, 2 mM dNTPs mix and 25 mM MgCl2(All from Fermentas)were prepared. Forty cycles of amplification at 95 ℃ for 30 s(denaturation), 55 ℃ for 30 s (annealing)followed by 72 ℃ for 60 s(extension)were used to measure the fluorescence signal. Reaction concentrations and conditions were adjusted according to the manual instructions of Platinum® SYBR® Green QPCR Super Mix UDG(Invitrogen, U.S.A). Equal quantities of cDNA from normal patients were taken as a negative control. All samples were normalized with reference genes (GAPDH). Five µL PCR products along with control samples and 100 bp ladder (Fermentas)were electrophoresed in ethidium bromide stained 2% agarose gel and resolved using a gel documentation system (Wealtec Dolphin USA). GAPDH PCR products were also electrophoresed to determine PCR efficiency.
2.6. Data analysis
Quantitative analyses of the data were carried out using 7300 system SDS software v1.4 (Applied Biosystems, USA)and>35 cycle threshold (Ct)value, out of 40 cycles of amplification were considered as un-detected[17]. Fold difference in gene expression was calculated by using a comparative method (△ △Ct method)[18]. Statistical differences (mean △ Ct values, SDV and SEM)were analyzed using Microsoft Excel. SEM is indicated in error bars. The descriptive statistical data analysis was calculated using Microsoft Excel and P values were calculated using two tailed Student’s t-test for statistical significance.
3. Results
3.1. Patients’ details
Patients’ details and reports of all clinical tests conducted for the study are summarized in Table 1.
3.2. Hepatic expression of PCK2, G6PC and FOXO1
Our semi-quantitative analysis showed dramatic upregulation of PCK2 transcriptional expression in eight chronically infected HCV genotype 3 (CHV3)subjects in comparison with six normal controls but no noticeable or consistent differences were observed between both groups for G6PC and FOXO1 expression (Figure 1& Table 2 for amplicon size). The band intensity analysis revealed that, although these expression levels are significantly different between both groups, they also vary among CHV3 patients. To describe the risk intensity of developing DT2 in individual patients,the differences in expression were further quantified with qPCR in separate experiments (Figure 1). Due to low RNA yield from liver biopsies we could not precede with two CHV3 patients (HCP7 and HCP8)for further fold change analysis.
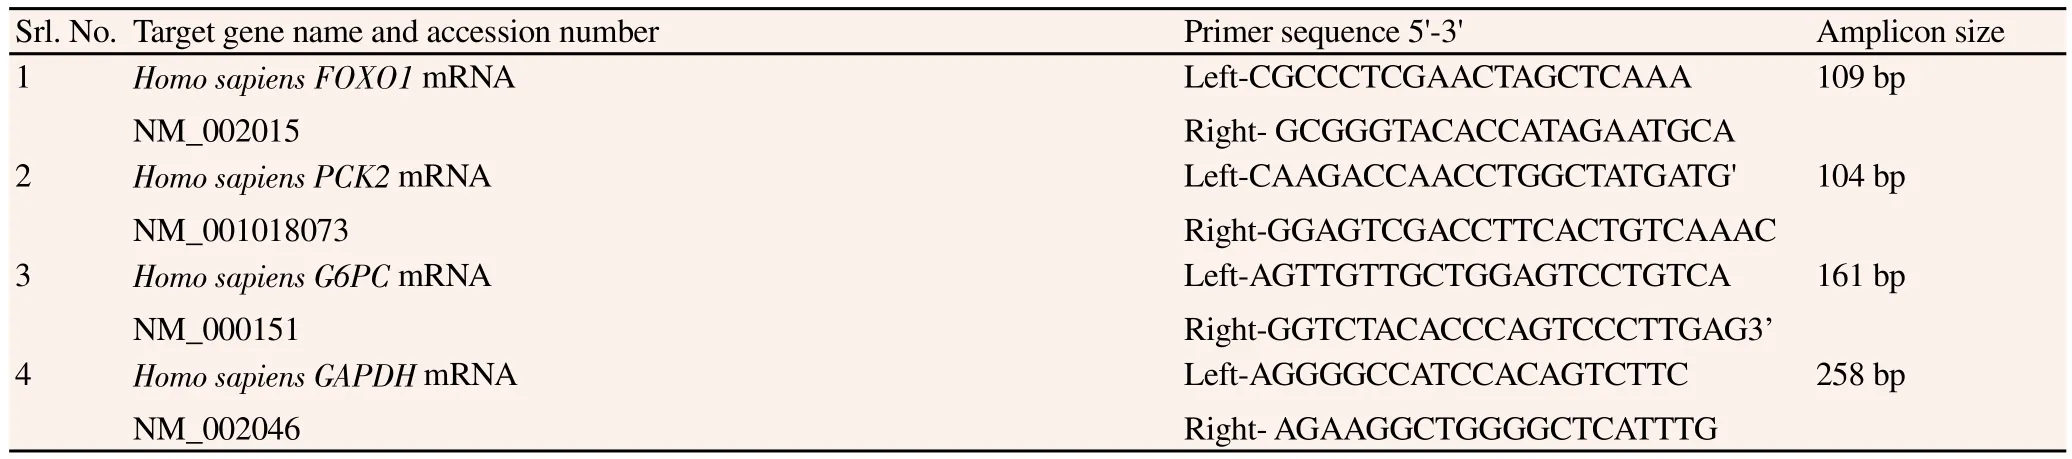
Table 2Detailed specifications of oligos.
Six CHV3 samples were evaluated with quantitative fold change analysis and compared with two normal controls. GAPDH normalized expression of PCK2, G6PC and FOXO1 in HCP1 was~7.78, ~1.58 and ~3.27 fold, respectively. For HCP2 GAPDH normalized expression of PCK2, G6PC and FOXO1 was ~9.71,~1.69 and ~1.07 fold, respectively (Figure 2). For HCP3 the GAPDH normalized expression of PCK2, G6PC and FOXO1 was ~15.77,~1.04 and ~1.1 folds, respectively. For HCP4 the GAPDH normalized expression of PCK2, G6PC and FOXO1 was ~20, ~1.1, ~1.02 fold,respectively. For HCP5 the GAPDH normalized expression of PCK2,G6PC and FOXO1 was ~38.05, ~1.68, ~2.17 fold, respectively and for HCP6 the GAPDH normalized expression of PCK2, G6PC and FOXO1 was ~20.24, ~4.19, ~1.95 fold respectively (Figure 2). Based on these results we have suggested a hypothetical model of glycogen accumulation in the liver which ultimately results in the development of fatty liver disease in the HCV infected patients (Figure 3).
To exclude the possible effects of other factors such as gender,HCV viral load and age in the development of glucose homeostasis,correlation analysis of PCK2, G6PC and FOXO1 gene expression was done. No correlations were found among HCV infected patients,between altered gene expression of PCK2, FOXO1 and G6PC with gender and HCV viral load (Data not shown).
4. Discussion
HCV nonstructural proteins interact with gluconeogenic enzymes(PCK, G6Pases)and associated transcription factors (FOXO1)and dramatically affect their gene expression regulation in HCV infected hepatocellular carcinoma cells such as Huh 7.5, Huh.8. The dominant effect of FOXO1 proteins among other transcriptional factors and cofactors such as peroxisome proliferator-activated receptor gamma coactivator 1-alpha, cAMP response element-binding and CCAAT enhancer-binding proteins has recently been reported[10,11,13,14].To our knowledge, this is the first study highlighting upregulated mitochondrial PCK as an early biomarker of metabolic disorder in the HCV-3 patients. In the normal human liver PCK2 express with equal proportion as cytosolic PCK isozyme, PCK1[19]. The mitochondrial location PCK2 is crucial for initial gluconeogenic reactions as the carboxylation of pyruvate to oxaloacetate by pyruvate carboxylase occurs in the mitochondrion. For cytosolic PCK, oxaloacetate needs to be shuttled out, but for mitochondrial PCK, no shuttle of oxaloacetate is needed[4,19]. Furthermore FOXO1 is a well known transfection factor which induces expression G6Pases and PCK1[13]but its role in the regulation of PCK2 was unknown. In our results, we found upregulated expression PCK2 but on the other hand expression of FOXO1 was similar in HCV patient as compared to normal control. This therefore suggests that FOXO1 is not involved in the expression of PCK2. Normal expression of G6PC also confirms that PCK2 mediate gluconeogenic reactions by independent mechanisms.
In our results we observed a dramatic change in the expression of PCK2 consistently on HCV infected patients. Whereas in the case of FOXO1 and G6PC, this dramatic change of >3 and 4 folds was only observed in HCP1 and HCP6, respectively. All other HCV patients showed almost similar expression of FOXO1 and G6Pase that of normal subjects. As the upregulated expression levels of FOXO1 and G6PC were reported in the Huh. Cells which represent hepatic steatosis or hepatocellular carcinoma, here we assume that these changes in the expression may only appear in the later stage of the disease. Moreover, HCP6 has unusual liver damage as indicated by his abnormally high ALT levels (117 U/L)which may also have some relation to the elevated expression of G6PC. This may also be true for HCP1 (ALT 86 U/L). On the other hand, PCK2 showed a consistently high expression level ranging from ~7 to 38 folds,independent of any other factor such as age, gender, HCV or ALT.Therefore, we suggest that PCK2 triggers initial gluconeogenic reactions which result in the accumulation of glycogen in the liver hepatocytes. Furthermore, functional effect of PCK2 must be considered in the future studies to study the overall physiology of metabolic disorder associated with HCV infection.
Conflict of interest statement
We delcare that we have no conflict of interest.
Acknowledgements
We thank the hospital ethics committee of PIMS for facilitating us for sampling and cooperation of subjects and their families for this research work. We also like to thank Mr. Bryan Degagne and Mrs.Shamim Akhtar for manuscript review, editing and English language support.
[1]Global surveillance and control of hepatitis C. Report of a WHO consultation organization in collaboration with the viral hepatitis prevention board. J Viral Hepat 1999; 6: 35-47.
[2]Tran G. The role of hepatitis C virus in the pathogenesis of hepatocellular carcinoma. Bioscience Horizons 2008; 1: 167-175.
[3]Zekry A, McHutchison JG, Diehl AM. Insulin resistance and steatosis in hepatitis C virus infection. Gut 2005; 54: 903–906.
[4]Berg JM, Tymoczko JL, Stryer L. Biochemistry. New York: W. H.Freeman and Company; 2002.
[5]Waheed Y, Shafi T, Safi SZ, Qadri I. Hepatitis C virus in Pakistan: A systematic review of prevalence, genotypes and risk factors. World J Gastroenterol 2009; 15: 5647-5653.
[6]Bochud PY, Cai T, Overbeck K, Bochud M, Dufour DF, Mu¨llhaupt B,et al. Genotype 3 is associated with accelerated fibrosis progression in chronic hepatitis C. J Hepatol 2009; 51: 655-666.
[7]Pattullo V, Heathcote J. Hepatitis C and diabetes: one treatment for two diseases? Liver Int 2010; 30: 356-364.
[8]Fartoux L, Poujol-Robert A, Gue´chot J, Wendum D, Poupon R, Serfaty L. Insulin resistance is a cause of steatosis and fibrosis progression in chronic hepatitis C. Gut 2005; 54: 1003–1008.
[9]Giordanino C, Ceretto S, Bo S, Smedile A, Ciancio A, Bugianesi E, et al. Type 2 diabetes mellitus and chronic hepatitis C: Which is worse?Results of a long-term retrospective cohort study. Dig Liver Dis 2012; 44:406–412.
[10]Choudhury M, Qadri I, Rahman SM, Gloeckler JS, Janssen RC,Friedman, JE. C/EBPβ is AMP kinase sensitive and up-regulates PEPCK in response to ER stress in hepatomacells. Mol Cell Endocrinol 2012; 331: 102-108.
[11]Qadri I, Chouradry M, Rahman SM, Knotts TA, Janssen RC, Iwahashi M. Insulin resistance, steatosis, and increased PEPCK gene expression during hepatitis C virus (HCV)subgenome replication: Role of NS5A and C/EBPβ. J Biol Chem 2012; 287: 37340-37351.
[12]Beale EG, Harvey BJ, Forest C. PCK1 and PCK2 as candidate diabetes and obesity genes. Cell Biochem Biophys 2007; 48: 89-95.
[13]Banerjee A, Meyer K, Mazumdar B, Ray RB, Ray R. Hepatitis C virus differentially modulates activation of forkhead transcription factors and insulin-induced metabolic gene expression. J Virol 2010; 84: 5936-5946.
[14]Deng L, Shoji I, Ogawa W, Kaneda S, Soga T, Jiang DP, et al. Hepatitis C virus infection promotes hepatic gluconeogenesis through an NS5A-mediated, FOXO1-dependent pathway. J Virol 2011; 85: 8556-8568.
[15]Valenti L, Rametta R, Dongiovanni P, Maggioni M, Fracanzani AL,Zappa M, et al. Increased expression and activity of the transcription factor FOXO1 in non-alcoholic steatohepatitis. Diabetes 2008; 57: 1355-1362.
[16]Shiffman ML. Chronic hepatitis C virus advances in treatment, promise for the future. New York: Springer-Verlag; 2011.
[17]Sheikh TI, Qadri I. Expression of EBV Encoded viral RNA 1, 2 and antiinflammatory Cytokine (interleukin-10)in FFPE lymphoma specimens:a preliminary study for diagnostic implication in Pakistan. Diagnostic Pathol 2011; 6: 70.
[18]Livak KJ, Schmittgen TD. Analysis of relative gene expression data using real-time quantitative PCR and the 2- CT method. Methods 2011;25: 402–408.
[19]Kleiner DE, Brunt EM, Van Natta M, Behling C, Contos MJ, Cummings OW, et al. Nonalcoholic Steatohepatitis Clinical Research Network.Design and validation of a histological scoring system for nonalcoholic fatty liver disease. Hepatology 2005; 41:1313-1321.
杂志排行

Asian Pacific Journal of Tropical Medicine的其它文章
- Antidiabetic and antioxidant activities of Nypa fruticans Wurmb. vinegar sample from Malaysia
- Anti-inflammatory and analgesic activities with gastroprotective effect of semi-purified fractions and isolation of pure compounds from Mediterranean gorgonian Eunicella singularis
- Natural products: Perspectives in the pharmacological treatment of gastrointestinal anisakiasis
- Analysis of human B cell response to recombinant Leishmania LPG3
- Rifabutin reduces systemic exposure of an antimalarial drug 97/78 upon co- administration in rats: an in-vivo & in-vitro analysis
- Protection effect of trigonelline on liver of rats with non-alcoholic fatty liver diseases